
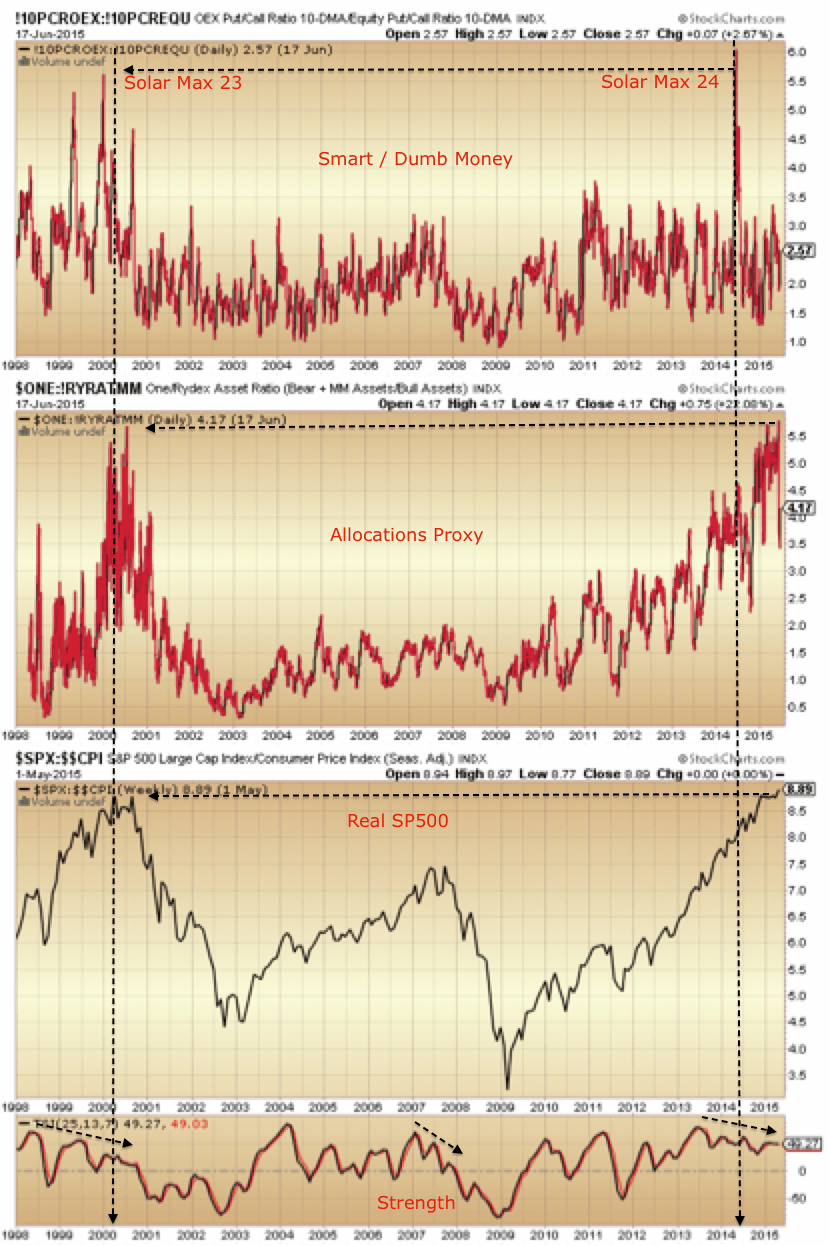
The biggest stock market mania of all time peaked out in March 2000, which was the exact month the smoothed solar max of SC23 peaked. Solar cycle 24 appears to have made its smoothed peak in April 2014, into which we experienced another mania in equities.
Below we see put/call (smart to dumb money variants), allocations (Rydex, as a proxy for the wider market), valuation x2 (real SP500, and relative to bonds) and strength (TSI) all displaying similar behaviour to 2000. What’s interesting is the extremes reached in these indicators have hit levels very close to those reached in 2000, as designated by the horizontal arrows.
 Source: Stockcharts
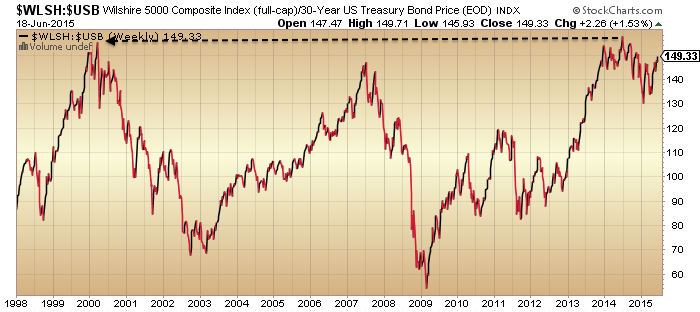
And we can add margin debt to GDP for one more:
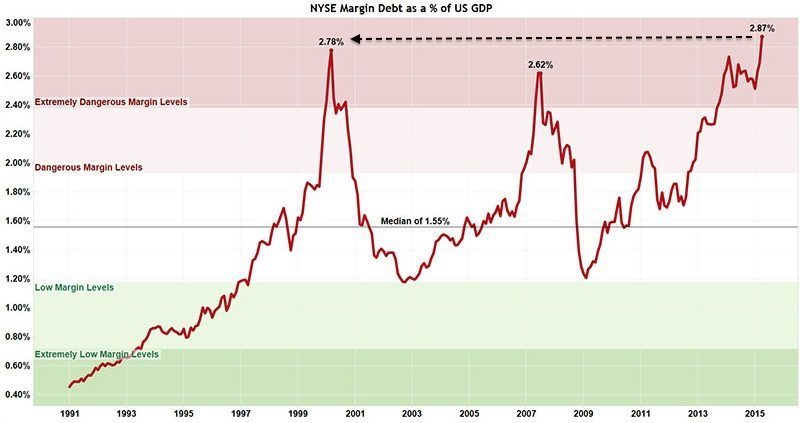
Source: Octafinance
In all the indicators, we see the intermittent 2007 stock market peak printed lower or milder. The difference? No solar max to drive speculation.
In short, various measures and indicators reveal a close mirror of 2000, both in behaviour and level. The question is whether those levels represent ceilings or whether we go on to see all new extremes. So back to the opening comment: 2000 was the biggest stock market mania of all time, and in various ways we are matching it. Wow, no? This is despite a demographic headwind (rather than tailwind into 2000) and despite a weak world economy (versus strong growth into 2000). Can we really go higher?
Timewise, equities are on borrowed time since the solar max of mid-2014. Although nominally they have not topped out, various measures under the hood (see previous posts) reveal a peak back then, and the divergences remain. The TSI divergence back at the SC23 peak lasted from mid-1998 to the top in 2000; the current TSI divergence began in mid-2013, making for a similar duration. Drawing it all together, I maintain the likelihood of a mid-2015 switch into an equities bear and I am staying on the attack.

Agreed.
The apo-peri table gave the end of the inversion between june 10 and 22nd.
Next week we’ll see first quarter at apogee, surely the lightest gravity in this period.
Crashes almost always start with a square. The heavy expiration today keeps the market up.
Next week will be 9 months after the sept 19 2014 high (=quarter) and 1 quarter in the Gann year (vernal equinox).
By the end of next week mars will be extreme north and we will be within a week of sun-node square, so volatility must go up.
Heliocentric sidereal Venus changes sign on sunday (scorpio) and wednesday mercury is at max west (+-3 days).
So next week is a promising week for some serious decline and potentially the change in trend we have been waiting for.
also this weekend is the Summer Solstice—Sun comes to a standstill and starts its declination descent into next December…… price pointed to this numerical equivalent at the SPX high yesterday
You may have to wait till mid-July or potentially September.
I notice another gap up in the Dax today. The previous two gaps have been good shorting opportunities. But, I’m not a trader (if I were, I would short this though).
Are we supposed to be laughing at this? After the huge slap in the face you received from the markets yesterday, you’re straight back in with more trading advice! Yesterday morning, you issued a smarmy and conceited “tick-tock” warning to those who were buying US indices; on your cue, those indices promptly had one of their best days ever.
What was your response? To take a back seat for a while and hope that nobody noticed? Non. To offer an explanation why you got it so spectacularly wrong? No,no. To apologise? Oh no! Your reponse was to issue more unsolicited diatribe to someone who had made a profit that (even having the audacity to give him specific targets).
Can you not even allow someone to enjoy their profit? Apart from a couple of links to other peoples sites (while you accuse me of reading too much) and posting a bearish rising wedge chart which had already been posted by someone else, all you have done in your comments is to agressively and often vindictively criticise others. “Keeping people honest”, as you said, while the markets have repeatedly made a fool of you.
There must be a limit to your propensity to self-humiliate, but you haven’t found it yet!
I like GM, he sees the same warnings and outcomes as I do. I like Mark because he has been a useful solar sounding board and has so far been proved correct. I hope you will both continue to post and leave the baiting behind.
Agreed – it’s gotten a little personal. Time to take it down a notch.
Thanks JH, I will strive to avoid upsetting anyone as I post. I like you too, and this blog.
Anyone else noticed that the big bond crash has apparently been aborted. Shorting US bonds is still a bad trade, with a huge deflationary recession dead ahead the yields are headed sub 1% I reckon.
Calm down Mark, anger leads to fear, fear leads to the dark side. or vice versa, it works both ways.
Most readers will appreciate that ‘tick tock’ alludes to a clock ticking, time running out, rather than any specific day trading call.
I note that the Dax gap has filled already. Yay!
GM, no need to tell Mark what to do. Focus on markets, please.
Hey Gary. I did laugh at loud at your comment ‘no need to tell Mark what to do’ by the way. I’m sure you’ll grasp why. Best wishes.
Hi John
Great blog and agree with your Russell 2000 analogy, I have also jumped into shorting this as well(BOATLOADS). If one were to use a hurst cycle with your solar cycle theme we would see a 4 1/2 year trough until 2020 bottom which I completely agree will happen. I came across an interesting chart that rhymes with this thought I think you will like Sid Norris of Elliot wave predictions http://elliottwavepredictions.com/wp-content/uploads/2015/06/RUT-monthly-6-12-154.png
Thanks
Hi Mike,
Very nice contribution. That is a very unique view of the last 15 year and next 6.
thank you.
I rediscovered some notes i made last year about highs and lows using Armstrong’s 8.6 years. Voltaire uses them and i decided to play with dates.
March 2009 low
Late April 2011 high (2/8 of 8.6)
Late May 2012 low ( a further 1/8)
Late June 2013 (out by a few weeks, a further 1/8)
I wondered if that would be the high but CB intervention means we chug higher.
Late July 2014 low (a further 1/8)
LATE August 2015 a HIGH ? (a further 1/8) AND 10×8.6=86 years from the late August 1929 high.
Late October 2017 a low ? (a further 2/8)
Of course these lows have only been pullbacks in a bull market but something i’m looking at. Price is the be all and end all though.
Hello Plates, If you still have Voltaire’s chart, please repost it for me as i lost it … Thanks Nicola2910
I haven’t even kept the chart myself. Next turn date is Aug 18. I will post at end of stream an example of the theory from the 2003 low.
Thank you..Voltaire
There was also a low in October 1931 ie 2/8 but it carried on down into July 1932
JH, good post.
Shanghai is now in a bear market. I expect a short term bounce as the government announces some stimulus. However, whipsaw aside, I think this is a good reason to be on the attack.
In terms of margin debt, China’s contribution has led to global margin leverage exceeding 2000 in my opinion. Europe banks are seeking to raise capital in Asia; QIHU is bought out by China, since P/E of 41 in the US can 10x to 410 in China. If Shanghai shows middle school dropouts that the market is not a sure bet, and with the house charging 10% for margin, this hot money could dry up. This has a consequence globally, and I argue never before in history. Greece is seeking Russia/EM support for its debt for example. We are all in the same boat.
Awaiting the latest margin figures from NYSE and China…but on the attack seems right.
John Li….my note below suggests something similar from an EW perspective. Good to see some fundamental analysis to back that up.
Thx.
I think what we were expecting to ‘see’ is transpiring.
John H I’m beginning to think that the frequency of your posts may in and of itself be an indicator. Lol!! (Not completely sure which direction yet) I am, however, deeply grateful and appreciative of them ALL.
Since your ‘conundrum’ posts the market has been ‘down’ but not yet in the manner that you were suggesting or what we (me) were ‘hoping’ for.
However for ‘what its worth’ (using my EW hat) I have a count of 5 ‘tiny’ waves down on the DJIA from the ATH to the June 2nd low (including overnight sessions). Every thing since then has been corrective despite the huge down and up waves. In my books they amount to a ‘running flat’ + a zig zag.
So now I’m looking for a 3rd wave down which should be impulsive.
Alternately any break of 18180 in the DJIA suggests that we are heading for another ATH.
G’Luck all.
P.S. Any other E Wavers here would like to chime in then that would be very much appreciated. Thx in advance.
You want wave counts, have some wave counts:


Nice charts Alphahorn. Thx very much.
Thanks for the EW count.
Playing devil’s advocate, why DJIA?
If Wave A has occurred, would the new high in Nasdaq Composite invalidate the Wave B count?
I remember EWI thinking that 1/2000 was wave A down, but we made a higher high 3/2000. We could argue today is 1/20/2000 or it is 3/24/2000.
John Li, my preferred trading vehicle (for historical reasons) has been the DJIA and hence that’s what I track.
Also regarding 2000 are you referring to the DJIA or the S&P?
On the DJIA the Jan’2000 remained the high. You also have to count (for EW purposes) each index independently. Whilst they all rhyme they don’t necessarily resonate at the same frequency.
So, in my books, under the current count, we should not expect to see another ATH in the DJIA.
Please remember none of this is an ‘exact’ science.
G’Luck to all.
I was burnt by the Elliott Wave International count in 1/2000, which called for a top at the start of the year. I am going by memory — this is 15 years ago. I believe it was on the S&P 500. Not to say that EW is useless — there are always alternate counts which then became correct.
As for the “grand” 5 of 5 of 5 of 5 calling for -90% to -99% drops, I am no longer a believer that that can possibly happen today. There is a limit to fractals.
Again, purvez, just playing devil’s advocate.
I think EW counts can be magnified if we can tune in to the sentiment in the intermediate waves. Perhaps the “most hated rally” in 2013 was a sign that we were in Wave 3 and not Wave 5 in hindsight. If this is Wave A-B, we will need to be looking for an unexpected setback, and then the brushing off of this setback.
Problem with astro/lunar/seasonal or EW is that they form a fractal of what happens most of the time. However, what happens is manipulated by non natural events such as Fed meetings, annual rallies (Thanksgiving, Xmas, 4th of July), etc.. Also, much of the move with these techniques are concentrated or nested within counterindicating price moves which makes it tempting to leave the trade before the correct price action is completed.
John Li, Valley, I believe I’ve said this before and it is definitely worth repeating in my view.
John, like you I too got burnt with EWI’s view of Elliott Waves. However I no longer use EW in ‘that’ way. In fact my use of EW has been for quite some time entirely ‘defensive’. It is the ‘only’ methodology I know of that gives me a set of ‘rules’ which provide ABSOLUTE ‘failure’ points.
So although, yes there are always alternate counts. I tend to work with what, I believe’, is the main count. Then I look at what point that count would be invalidated. (Remember ALL EW counts invalidate at some pre-defined point). Provided that invalidation point is within my risk tolerance I take the trade. If not I pass.
Then I stick with my ‘invalidation’ point like SUPERGLUE!!
So that limits my losses but allows me to let my winners run.
Like most people I have more loosing trades than winning ones. But my losses are tiny compared to my WINS. That’s how I survive this game.
I also update my ‘invalidation’ point as the wave progresses….if it goes in my direction. That way I often get out with a small(er) profit than I was expecting but still no loss.
It’s the hardest work I’ve ever undertaken in all my ‘differing’ careers. Still it allows me freedom and an escape from the corporate ‘culture’.
I would urge you to learn EW principles and apply them the way I’m doing. It will hopefully improve your trading.
As an example in real time. As at the time of writing this (19:33 UK time) the DJIA approaching 18024. I can count 5 waves down from yesterday’s high. (A tiny first wave of the W3 down that I’m looking for) Now that means it SHOULD go further down after a correction. However I’m going to take my profits and see what happens with the correction.
At some point I’ll jump in again and continue down.
As I said it’s intensive work but when there is no one to disturb you then you can do it.
Hope this ramble explains where I’m coming from with EW.
Good point that EW is disciplined.
US Margin debt to GDP was 12%. We probably never get there anymore due to regulations. That was the wild west. Volatility was 25% pre-1929 crash.
China margin debt is at 3.6%. Shanghai volatility is 50%. I argue that we have to multiply margin with volatility to get a true sense of the sensitivity of a move to snowball. (For Eurodollar contracts, we can leverage 2000x because the volatility is sma, for example.) Therefore, we are at 7.2% risk adjusted. Now add the fact that many billionaires have borrowed from banks with their own shares — I don’t think that counts as margin, as it is not broker financed. (Does anyone know?) Add to that margin from trust products. (Again leverage from other trust investors, not broker) Add to that corporates trading the stock market rather than doing real business. (Ponzi) Add to that P2P loans that are the principal for brokerage accounts. I think China today could easily match/exceed US in 1929.
Maybe a key difference is that the Chinese authorities have spotted the problem and are tackling it. In the 20s it died of natural causes. A good sign that the powers-to-be are a tad more sensible than the US/Jap/UK contingent. Gives us a shot of hope.
I have really appreciated the quality and quantity of these recent updates. Thanks.
The color of my perspective is tinged by my positions in precious metals. I contend this era most reflects the situation in 1973, as opposed to 1929 or 2000. The Dow was then worth, as it is now, about 15 times an ounce of gold. I reckon we will see the ratio fall to one ounce (as we did in early 1980). The nominal stock losses will not be as severe. This, of course, implies an inflationary event that would rival if not exceed that of the 1970s. The catalyst that would bring about such a devaluation of the almighty dollar is something I can not presently pinpoint. I know the patient is dying yet I know not the cause.
Interesting –
Gary, this reminds me of a ‘Gartley’ wave count, if I’m not mistaken. Should head down rather sharpish if it is a Gartley.
That’s exactly what it is.
December 21, 2000 should never be forgotten let alone discounted.
Human intervention can warp all indicators (and irrevocably change the future)
We all know about the dump of the gold standard.
Why are we blind to the event that overshadows everything?
The event that will destroy all humanity for the sake of pure evil greed.
Makes you want to call someone and pray together via telephone.
OK, Peter_ you got me. What are you referring to, please?
Lest it lies forgotten and considered hardly moot or otherwise inane I will tease you first before revealing the devils foremost tool that is hidden in full view – it was signed into law by President Bill Clinton on December 21, 2000 on soil made fertile by the prelude facilitated by the same devils advocate in 1999.
Peter_ are you talking about the repeal of the Glass Steagal, or something else? My history is admittedly sketchy here.
Well I knew it wasnt anything to do with Madonna marrying Guy Richie with George Clooney amongst those present: https://en.wikipedia.org/wiki/Commodity_Futures_Modernization_Act_of_2000
The Commodity Futures Modernization Act of 2000 (CFMA) is US federal legislation that ensured over-the-counter derivatives (OTC) derivatives transactions between “sophisticated parties” would not be regulated as “futures” under the Commodity Exchange Act of 1936 (CEA) or as “securities” under the federal securities laws. Instead, the major dealers of those products (banks and securities firms) would continue to have their dealings in OTC derivatives supervised by their federal regulators under general “safety and soundness” standards. The Commodity Futures Trading Commission’s (CFTC) desire to have “Functional regulation” of the market was also rejected.
The legislation is in full view – it legalizes heinous financial behavior and related non-disclosures.
(The Glass-Steagall Act of 1933, passed during the Great Depression, prevented commercial banks from trading securities with their clients’ deposits and created the FDIC as a guard against bank runs. Passed in 1933 as the Banking Act, Glass-Steagall was chipped away over the years and eventually repealed during the Clinton Administration with the Gramm-Leach-Bliley Act of 1999).
seems to me that was about the time of proof of Exchange Stabilization Fund intervening in the Gold market.
hard to believe it now- gold was around $266/oz
I wonder if this downturn in prices has tested Nicolas’ mettle with regards to IBB, QQQ, and SPY. He may find that Mr. Market may decide the direction without consulting Mrs. Fiat Currency.
Found an interesting SP500 pattern today. “Price Arc” is the name. Refers to price up move month before Venus/Mercury lining up on same side or on opposite side of sun regardless of where Earth is. The inner planets lining up directly seems to pull on the sun in a way that increases market supporting energy directed towards earth. Since the 2009 lows this has happened 28 times, 23 of those times the market rose greater than 2% the month prior to the event; this is an average of 82% of the time. The average gain was 4%. The next event is 7/18. If price show unseasonal and unreasonable strength over next month it could be to this rather consistent bullish planetary alignment.
(I didn’t curve fit this, backtested to 1998 with similar results tho’ the number of positive months was lower because even tho’ the alignment is generally more positive than negative, during the negative times it can accelerate price move down. Kind of like the new moon being usually bullish but sometimes is CIT to downside as well.)
Unfortunately for the bullish perspective, we are in the seasonal duldrums and Venus inferior conjunction is on 8/10 and two months prior to this are strongly bearish. But, one possible move could be a unexpected and direct move up from here of 4 to 6% into the 7/18 date which would catch most traders away from the computer, and then a 6 to 10% drop from there into 8/10.
Calculated total return for these 28 months since the Mar lows 2009. Losing and winning months combined would yield a compound return of 200% of initial capital, yet one would have been invested only 28 out of 65 months or 43% of the time.
Total return all months from 1998 to Mar lows 2009, yielded compound return of 43% again being invested 43% of the time and SP500 dropped from 74 in Jan 1 1998 to 66 on Mar low 2009 a drop of 12%.
Conclusion, investing the month before Mercury Venus lining up on same or opposite sides of Sun and selling on the day of the event has had above average returns since 1998.
excellent information, valley. Do you know a site where these Mer Ven moves are tracked or reported?
http://www.theplanetstoday.com/
Using the time tab you can scroll back and forward in time.
Hi John,
Great work all this years, I have been following your site since it started but only posted once.
It is coming and we all know it, just when.
Another item to note is that the last of tetrad blood moon is due on Sep 13 this year.
“Things ” happen in and around this timing for many hundreds of years.
This timing matches with your overall general direction.
Thank you for work and kindness in sharing.
Vince
I have mentioned using Armstrong cycles from major turns rather than his fixed time dates.
On this basis, from the March low date the next turn is theoretically Aug 18 2015, rather than his fixed date of Sep 30/Oct 1. Both could work.
Gann used 1/12ths, 1/8ths and 1/3rds and halves, quarters etc.
1/12th of Armstrong’s 8.6 years is of course 8.6 months.
Some who study galactic cycles suggest 1/32 is the best frequency.
Certainly that creates all the Gann fractions as multiples.
Are these fractional moves infallible ? Of course not.
They can add to other ideas.
In the chart below, I have used the Australian market (which I mostly trade) and use 1/12ths (red) and 1/8ths (blue) vertical lines from the 2003 major low as an example.
Where they look blurred is because the lines match and I offset one line by a day.
Its not the whole cycle and its not perfect but there does seem to be something going on.
Should have made that longer chart.
Longer chart here.
Thanks Again
Voltaire, Armstrong’s cycle charts can look very impressive to the naked eye, but has any work been done on the results of investing according to these dates? For example, what would have been the results of buying the market around major cycle-turns when the price was low and selling it on turn-dates when the price was high?
Healthy profits? 😉
GM, that’s what I’d like to know for sure. It should be fairly straightforward to establish a rule for backtesting purposes, e.g. buy if there’s a major Armstrong/Pi turning date and the market is low etc, sell up and switch into T-Bills when opposite applies. The problem is surely which market to test, as Armstrong seems to claim it is not specific to a market and works for different assets at different times.
decorate
decorate
decorate
This chart shows the correlation between sun spot number and 3 month Treasury bill rates. Thank you, Chien-Jen.
decorate
The latest COT report suggests the equity markets are running on fumes, with the commercials positioned 224K Long Vs. 653K Short E-Mini S&P 500 contracts (a slight increase from last week).
Also, the commercials are heavily long the Vix (115K Long Vs. 18K Short) adding further evidence to bear case.
The commercials play the long game, but it provides more evidence of how the “big money” is positioned.
DYOR etc.
http://stockcharts.com/h-sc/ui?s=IBB%3AGDXJ&p=W&yr=5&mn=0&dy=0&id=p29286691482
from 0.5 to 15 ….just thirty times
Lunar Chord bearish all week. But, since everyone is expecting lower prices, price will probably gap up on Greek news on Tuesday, and then continue down.
XLK seems conducive…
http://barestbodkins.blogspot.com/
This Monday US an existing home sale report is expected to be good to be followed with Lennar reporting good new home sales on Wednesday. This is what everyone has been waiting for: Old houses selling briskly so that new houses (upgrades) can be bought by those very same prior house owners.
Should both these reports prove good then the odds are high that the stock markets will take off to their blow off speculative tops latter this year.
Welcome back, Richard. Maybe housing will be the reason for blip rally.
Richard, maybe housing in the US will turn things around, but it’s unlikely, given all of this:
http://www.hussmanfunds.com/wmc/wmc150615.htm
Welcome back Richard.,,.We need your comments…..n
We have focused mostly on solar maximum, which in this cycle is tough die to the flat peak. How about we change that focus?
Any opinions as to when the solar minimum will be? Forecasts don’t show zero sunspots on 1/2020, which suggest the minimum might be beyond 2020.
I refer you to the follow article, which show growth stocks bottoming in 1976 at solar min.
http://www.aaii.com/journal/article/valuing-growth-stocks-revisiting-the-nifty-fifty
From there, subtract 4 years to get the date of the peak. Therefore, if as analog as a weak SC, 1/2020 solar minimum would mean 1/2016 peak…and if solar min is past 1/2020, you can do the math. Of course, just one data point, so there is probably a 12-24 month standard deviation around this window.
Comments?
I am looking to cover shorts and possibly go long to the blow off top.
Should good used housing sales be reported this Monday along with good new housing sales reported on Wednesday then I expect Small Specs to really put the “petal to the metal” in buying stocks on leverage. It may not take a return to a “normal” housing market but only a “take off” from well below trend to rising up only to trend (and not a break out to another crazy housing bubble) to send stocks up to their expected blow off top.
Note some recent increases in solar activity as several CMEs are expect to hit Earth dead on this week. Several CMEs hitting Earth straight on this week could really set off people’s minds in a speculative buying mode especially with two good housing reports too (its not over until the fat lady sings).
Look at it this way: If the housing reports this week are good then the housing –Wall of Worry– may have been climbed with smooth sailing ahead. Remember: Reality is one think and Perception is another. This is all about getting the Public to go nuts on further leveraged buying of stocks. If historical indicators say that more leveraged buying by the public is possible then the odds are against the top being in –yet.
It should also be noted that should housing take off with a rallying stock market means that the “wealth effect” will be in full swing and good times will roll.
Hello Richard.
Just a few months ago I recall you were touting oil prices falling as the saviour for the US consumer (they didn’t spend). Then you were touting a weak dollar as the saviour for the US markets (stronger overseas earnings as a result).
Now, it’s housing.
Perhaps you will consider cycles at some point, and realise that these interesting concepts you mention are all beholden to the grand cycles unfolding. Plus, to date, none of them have actually panned out as you predicted.
Here is a powerful warning: Late cycle highs mean the market is strong and will go higher in the next cycle. The 19 year cycle high was due in early 2006 but did not happen until early 2007 and that lead to higher highs with the next cycle high due in 2025. This SC cycle high is also late. With two powerful cycle highs being late back-to-back is a powerful warning that the bull market is still very strong and has a long ways to go in both time and price.
It might be that “The Top” won’t happen until both the 19 year cycle AND the Solar Cycle come together (some how) in 2025 which produces a super crash.
So some form of greek backing down sends the dax up 350 points. As I said the big risk at the moment is being short and their being a resolution as a sharp upward move will happen even if it doesn’t last long. US markets will not have the same sharp reaction so shorts their make far more sense considering they are more overvalued than europe.
Krish
I think I speak for many when I say that the European situation is not really tradeable right now. Yes, one can just take a wild punt and hope, but this is not a situation where one wants a lot of exposure imho. This week or next we will know more about Greece and any deal struck, for now I am on the sidelines – I don’t often trade this type of hysterical situation. As you say, 350 points on a positive rumour? What about if Greece come to their senses and tell Germany to fuk off…..what would that be? Down 2k points?
Just be careful out there….
J
True. A grexit might lead to a 2k drop but a solution probably paves the way for a 2k rise over the rest of the year. Could go either way so best so stay on the sidelines unless you feel like taking on more risk. Today is a catastrophic day for the bears so lets see if the gains hold over the week or we drop back.
Lab 7442 update – after low near 7/2, wave 3 is ahead. Target 2410 http://www.ustream.tv/channel/7442-analytics
Hello Peggy.
2410 is a high target, so I’m wondering when that target is predicted to be hit? Will it coincide with Armstrong’s 2015.75 I wonder?
I think it will be awhile. First target will be 2201, then 2268, then 2335.
Hi all ! I don’t want to brag but once again I was right. Greece was a non-issue and it’s very easy to fix it. The ECB just has to print a bunch a money and buy greek bonds and that’s it.
I see that IBB and QQQ are trading at new highs. You just can’t deny that my strategy a working like a charm.
Regards,
If buying government bonds always fixes things then markets will never fall. Based on that you must be a permabull. If not please explain at what stage buying bonds will not fix anything and lead to a bear market instead?
IWM and IBB at new highs this morning, confirming a continuation of this historic bull market. Congrats to all long !
Please do yourself a favor and don’t follow John’s recommendations. I respect him a lot but you can’t deny he’s been way off for a long time now.
My respect for JH is only enhanced by the fact that he didn’t kick you out a long time ago. But I guess every blog has its troll, and you choose to come here with your nonsense, until the market turns, when you will vanish. Soon one hopes.
He is a good contrarian indicator.
Hi GM ! You don’t kick out someone just because he has a different view of the markets. I’ve always been very respectful.
My track record is there for everybody to see: i’ve been recommending IBB, QQQ, AAPL, GILD for a long time. More recently I’ve been suggesting CRM and AMZN.
My record is excellent.
John is very kind but he’s been wrong for the past 18 months. It’s not my fault. You cannot change the facts.
Your record is just broken, sadly for us.
nicolas.. i don’t post often, but can’t resist today.
John has been right a few times this past 18 months, there have been a few shallow pullbacks, which turned out to be buying opportunity at least for now.
what if.. TPTB are loading up on the short side, based on some indicators i follow, TPTB are selling into strength. They have HUGE positions and need price strength to unload their shares, so they manipulate the market and orchestrate a short squeeze driving prices higher and unloading their shares to dumb money.
it seems for several years now.. every dip continually gets bought and has been the right play. but based on John’s analysis, and other blogs i read, an intermediate or ATH top may be near.. can you just imagine the mayhem. what if –> next time the 150 DMA is hit and the trap door is open and BTFD crowd gets screwed big time.
so remember bulls make $$ bears make $$ but pigs get slaughtered.
you have been correct on QQQ & IBB – hopefully you are actually trading this ETF
IMO.. perhaps it’s time to take some profits off the table.. the charts look very stretched.
remember feb-2014 Janet Yellen said bio-techs were overvalued. IBB was at $274 and sold-off sharply to $208 in a matter of a few weeks.
as of today IBB is at ATHs around $384. maybe double top? which is 85% from apr-2014 lows ($208) and 40% higher then when Janet said bio-techs were overvalued. what would she think now (lol)
i recently read an article that advised that only 3 of the stocks in IBB had reasonable P/E (under 30) and 8+ had NO EPS. at some stage sooner than later valuations will matter and some analyst will come out and downgrade the sector for overvaluation. which IMO … would result in IBB nose diving .. have a look at look at AMBA..
good luck..
US used home sales increase in both numbers and price:
http://finance.yahoo.com/news/us-home-sales-jump-may-140041108.html
For once I agree with the troll Nicolas. Throwing someone off because they don’t agree is wrong. Hopefully AMZN will be back at 449usd soon.
J
6/22 12:34 short term Spiral forecast 2091-2092 low
Here’s the gist of a trade that I’m taking.
Somewhere between now (DJIA 18111 & 18179) I’m taking a down side trade where the ‘stop’ is 18179 and the target (allowing for ‘up’ waves…but below 18179) is 17690.
Now if that is not a ‘risk / reward’ ratio that you can handle then you should find another profession. LOL.
The risk reward ratio is worth much less if the probability is very low:) However, atm it looks like my July SPX puts may close at zero:D
J
Yes of course J….I’m expecting the R/ReW to be quite high. You pays your money and you makes your choices!!
Had you ‘bought’ or ‘sold’?
Oh, I never sell options:D
By the way, if that trade comes off it will basically mean that you have caught the intermediate top perfectly which with such a tight stop I deem to be quite unlikely. But I wish you all the best of course!
J
Thx J for your best wishes. Most money is made with ‘selling options’ from what I’ve observed. The MMs are stuck with trying to charge a higher price for the calls ……but that means that they also have to give higher prices for the puts.
Most Puts, from what I’ve seen, end up valueless….so a short is IMO a very good trade.
Of course, as always, timing is of the ‘essence’.
Price is stalling intraday, lunar chord phase, declination, and distance bearish (tomorrow is apogee, farthest distance of moon to earth surface), seasonals not conducive to gains this week, took short on US equities 1:38EST. Hopefully projections of 2091 short term realized next three days.
Note to kurt: not sure if you are still reading this site. Just wanted to note that I am dead wrong in calling the market top a few weeks ago. Have to admit that my original EW counts are a mess, but my alternative count is playing out, that SPX is on its way to 2150. You are right that the intermediate cycle correction is being stretched out again, and there is no 4%-10% correction in June. Who knows when this market will start having a natural cycle again. Good calls on your part.
Purvez
Selling an option means your exposure is almost limitless. Don’t try that unless you have very deep pockets indeed.
imho
J
J, yes you are right, I wouldn’t do it without a stop.
Any way options is not my trading style.
if you don’t like “unlimited” exposure and you don’t want to use a stop, then sell vertical spreads. That way you get theta decay in your favor and you limit your potential loss to the difference between the short and long option, less the credit you receive when you sell the spread.
I am unable to find any statistical evidence for the lunar standstill model. I checked the cycle versus market volatility and found nothing vs what Gann expected. Does anyone have any evidence to share?
6/22 5:04 Spiral update – tomorrow is up until midday. another high is possible before the drop to 2091-92
please stop
why?
Thanks, Peggy! Hope you are right about the 2092 price target.
Thanks, Peggy.
6//23 10:19 Spiral update: if 2107 is not broken, and 2122 is broken, the targets are 2134, 2145-2151. If 2107 is broken, then 2092. Is the current wave a B or a 2?
For what it is worth, my present count from March 2009 indicates we are completing
5 waves with a move above 2134 but below 2154 completing an ending diagonal. As everyone knows EW forecasts have had a terrible record. Too many believe that as long the Fed keeps rates down the S&P will continue up. In fact, one good trading service forecasts 2300. However, we need the NH above 2134.
We should top out this week.
http://www.theolivepress.es/spain-news/2015/06/18/exclusive-baron-rothschild-indicted-in-france-over-fraud-case/
S&P500 has been stuck in a choppy upwards trending channel since Mar 2015. I know many folks out there utilize various techniques as indicators for possible future price action. But if you ignore the media noise (i.e. Greece, Fed interest rate hike timing, economic data) and purely focus on the price and past trends,this is what can be observed.
1. After bouncing off the upper channel and it sells off for four TD’s and is followed by a failed “mini bounce” rally (i.e. 2 TD surge up, 2 TD surge down) that successfully retests and holds the lower level, an extended bullish run of approximately two weeks typically follows that either brings it back up to its previous high or establishes an incrementally new 52-week high.
2. So far in 2015 the market has been establishing interim peaks around the 20-26 of each month. Jan 22, Feb 24/25, Mar 20/23, Apr 23/24(27), May 20-21 of 2015.
After the Jun 3rd one day surge up, a selloff of four TD’s occurred ending Jun 9, followed by two TD’s up bounce (Jun 10, 11) and two TD’s down bounce (Jun 12, 15) that formed sort of a small shoulder that held.
This pattern is similar to what occurred in both early April and early May and both had extended bull runs lasting at least nine TD’s or more for about 65 points. If we count Jun 15 as the bottom before the extended bull run rally then Jun 22 is only the fifth TD so far and technically it could run as far as Jun 26.
My notes indicate a potential peak in the Jun 24-26 time window and assumes an incrementally new 52-week high gets hit of maybe 10 points higher than the old high. So far Jun 22 essentially retested the previous May 20 high and is in the calendar days 20-26 time window to qualify as a peak. But since it is only halfway in duration relative to the prior April and May bull runs and the MACD indicator has just triggered bullish on Jun 17, I believe there is further upside later this week.
Steve, that’s a good point. Until that pattern breaks, the bull lives on.
Steve-I just posted. I am calling a new high above 2134 but below 2154 possibly this week. If we go past this week and higher than 2154, I’ll just hv to say – wrong again. Happy to send my email post to anyone who wants further details.
libadvsor@gmail.com
I worked counts from March 2009 several times this week and right or wrong came to the above conclusions.
If interested in European indexes(I do not know how to post charts) – http://practicaltechnicalanalysis.blogspot.co.at/2015/06/european-indexes.html
Bottom as I have expected, but the door is open for another leg lower.
It depends on news… Greek drama. It can change the short term pattern, but not the intermediate term picture.
Hi Crazyworld2013. Thank you for your post. I am convinced central banks want the markets to go higher and are willing to support them.
Look, if central banks begin to raise rates, stop QE, and even start to sell assets, then I would turn bearish. But that’s not the case right now. The FED is still not raising rates, the ECB is still printing 60B a month, and so is the Japanese central bank. So, in my book everything is going smoothly.
And yes, AMBA looks very interesting here. I will probably initiate a new position soon.
best regards.
Parabolic picking if fun but usually leads to regret and loss of capital
http://stockcharts.com/articles/decisionpoint/2015/06/parabolic-fail-for-ambarella-amba.html
IWM and IBB are printing new highs this morning. Way to go !
Can I have a complete list of your recommendations?
AMBA as in Ambarella?
What do you think of the China ADRs, such as VIPS, YOKU, CTRP?
John LI, don’t do it….don’t do it to yourself.
imho
J
Well…it is a coin toss if we go parabolic from here, or if we crash. In BOTH cases, it is good to get the list of hot stocks ahead of time.
There will no be vertical move higher! That is a fantasy. No it is not a coin toss. Is it someone at this board watching charts at all?????
The pattern higher is not over but the next bigger move is lower.
Hands off from this list. After 20% correction you can buy it for the final parabola .
Maybe I have all but given up hope….
😦
Cheer up John Li, I’ll take your comment as a ‘contrary’ indicator. 🙂
If i can cause the top, all the better. Honestly, if that is what it takes, i am fine paying the costs to liquidate and chase the crash down.
Hi John ! As is well known, my biggest positions are QQQ, IBB and AAPL. I also have significant positions in IWM and GILD. I have smaller positions in AMZN, CRM, BHP and RIO.
I woudn’t touch chinese stocks as this market is too opaque for me.
So, yes continue to buy the leaders and don’t follow John’s recommendations.
Thanks. I am monitoring the list as a portfolio to see if it ramps up parabolic, and when it reverses.
hi nicolas..
i see IBB & XBI & GILD all made new ATH today and then sold off hard, but bounced back near the end of the day.
Hanging man candle doesn’t look good.
a guy on FAST MONEY said time to SHORT IBB.
btw. were you aware that GILD is major holding in IBB QQQ SPY XBI
90% of IBB stocks are in IWM.
big cap bio-techs (CELG GILD REGN BIIB) are in IBB QQQ SPY
so if these are your largest positions, it looks like you have overlap, and if something goes array with bio-techs, well your portfolio will take a big hit.
Hmm…another one bites the dust!! So today’s slightly higher high above 18179 (DJIA) changes the dynamics of the wave count. Looks like we may have to allow for further highs (as per Peggy/Spiral) before heading down.
Poor Nic. he thinks the short end of the curve matters at all. Does he even grasp the yield curve I wonder. No matter.
Various business cycles are painting a bleak picture for 205-19:
http://moneymovesmarkets.com/journal/2014/8/7/cycle-analysis-suggests-2016-17-us-recession-risk.html
” I am convinced central banks want the markets to go higher and are willing to support them”
Actually, not so. CB’s understand full well that overextended markets are dangerous to their longer term plans. Why do you think that the Chinese PB are taking the heat out of their markets? Smething thatnthey should have done months ago btw.
The problem is that history shows that CBer’s are notorious for being well behind the curve in relation to monetary/interest rate policy.
So it is not by purpose that CBer’s have blown bubbles,it is merely through their never ending incompetence and inability to understand the bigger picture.
It is “the nature of the beast”.
Just to play Devils Advocate. Why would CBer’s continue to mever learn from their mistakes?
I suspect that is where John’s work and research comes into play and the effect of SC’s upon human behaviour.
I would add that CBs are ultimately beholden to the governments they serve (except the ECB), and so are just doing what they can to manage the mess that’s developed since we came off gold in 1922. But they have a plan (hatched at the BIS).
The hardest part lies ahead, the final reckoning.
GM you’ve alluded to this many times. Yet I’m struggling to understand what exactly you believe will happen and in particular why you believe the Euro will prove to be ‘different’?
Your thoughts on this would be very much appreciated.
Thx in advance.
I’ve been lax in completing the Screwtape blog post which will provide some detail on this topic purvez. I’m back from holiday, so will crack on with it this week.
Thanks. I am monitoring the list as a portfolio to see and finally got here at your blog!
Further to my last comment above … there is going to be an imminent impulse move up higher within the next four TD’s. The reason for this is because the angle of the short term upper trend line is slightly steeper than the previous runs in early April and early May, and there is not much wiggle room left below as of today’s low. So either the trendline fails or it moves decisively higher and my analysis concludes the latter.
I now think the optimal high will likely occur on Jun 29 but price could be similar to Jun 25, 26 high also depending on the move later this week. Also starting either end of June or early July there will likely be a counter impulse one day decline of 30-35 SPX points shortly after this new high is made.
If price for whatever reason stalls and runs sideways by Friday then that would be a rather ominous sign. So trade accordingly …
6/23 4/26 Spiral update – Lab 7442 forecast expecting 2131-2134 next. 2111 is wave C low. Confirmation is break of Wave 1 high.
thanks peggy…..u r good…..pl. keep posting!
M6 solar flare last 24 hours, elevated geomagnetic disturbance arriving around midnight EST in US. Interesting to see the effects if any on futures markets early morning and equity markets tomorrow. Today also had elevated geomagnetics all day and didn’t seem to effect market much. .
If you are wondeing how DUMB these CBer’s are, just under 12 months ago Janet Yellen warned about overvalued sectors of the stock market, particularly Bio.
At the time IBB was selling at around $270.
Where are we today……..
That proves how bloody dumb these people are. History is littered with instances of CBer’s allowing valuations to become overextended resulting in parabolic rises ending in collapse and dire consequences as a result
They are unquestionably dumb as dog …..!
http://stockcharts.com/h-sc/ui?s=IBB&p=W&yr=5&mn=0&dy=0&id=p79394764907
I suspect their shortcomings is the reason they are in the job. Definitely can’t have free thinkers in a position that has to tow the line!
It’s not the CBers fault Allan, it’s mad humans, big government, socialism. Central bankers are just trying to keep it all together as best they can.
https://twitter.com/Trident_one/status/613056913438339073
They are not dumb but totally bereft of wisdom, insight, and courage
I posted couple weeks ago…..when most here were in crash mode….that we were heading to 2140……we are almost there now!
There should then be a stop and correction…..but if we break 2140…..then we r going vertical to 2350…..and bears will be gored!!
it seems many of you are bullish…
food for thought INSTITUTIONS sold lots and lots of stock..
http://www.zerohedge.com/news/2015-06-23/smart-money-just-sold-record-amount-us-stocks
especially health care IBB XBI XLV
what happens if greece situation falls apart –> are you guys still bullish because of various SPIRAL COUNTS and other pattersn some have seen?
nicolas.. here’s some more food for thought from some other blog i follow..
5 of the Russell 2000 top 10 holdings are biotech stocks. I think it’s something like 60% of the entire index is dog crap money loser biotech small caps. Looking here to the $BTK index which has been on fire, today’s ‘hangman’ top looks like a possible bigtime top which portends a big fall for TNA. July is also one of the worst months for the Russell.
hope you are taking profits in IBB & IWM
I wondered why the IWM has a price earnings of 79 in the financial pages. Guess it is all of the biotechs. I always thought IWM was small value companies, guess they have shifted to small high growth potential companies.
I am short US equities still. Today’s apogee often followed by price weakness, tomorrow is equatorial crossing of moon to the south which may add volatility, tomorrow is day of geomagnetic disturbance, moon phase is in the weak zone, and price is drifting sideways in post option expiration week (weak). Will exit short no later than Friday.
Good call so far, Valley. Well done.
Thanks, Gary. So far, so good.
I’m trying to ascertain the usefulness of Armstrong’s confidence model for investing in stocks. Since 1881, buying the S&P upon major turning-dates when CAPE was below 15 would have produced an average real annualised total return over the next five years of 9.6%. Buying on turning-dates when the market had fallen in the prior twelve months would have produced an average 6.2% annualised return over five years. By contrast, the average annualised real total return after major turning dates when CAPE was above 20 was -2.6% yearly over 5 years. Whether a strategy built on this approach would have beaten buy-and-hold remains to be seen.
http://www.independent.co.uk/life-style/gadgets-and-tech/news/huge-solar-storm-hits-earth-power-grid-and-gps-could-be-disrupted-but-auroras-might-be-seen-10338332.html
The short of the decade!
http://stockcharts.com/h-sc/ui?s=NFLX&p=D&b=5&g=0&id=p02449158892
Yeah, but what about their original series such as “House of Cards”? Surely, this quality programming justifies a price earnings of 400. Thanks for the tip about SHAK, Shake Shak with a price earnings of 600. Their new chicken burger will be sure to please investors.
6/24 12:22 Longer term Spiral update. 6/25 and 7/1 are potential lows for this Contraction. First target 2091.
Just an observation…..One of the few times in recent months we are seeing a low volume sell off. 1/2 way through trading session. Spy down over 8 points on 35mm shares.
I had typo’d my email address. sorry for the double post.
Just an observation…..One of the few times in recent months we are seeing a low volume sell off. 1/2 way through trading session. Spy down over 8 points on 35mm shares.
Scott,
If you can let us know on the jun 19th dividend on your short call it will help us. I had been badly treated by IB previously so want to know others experience.
One reliable pattern that has happened each cycle last 16 years. Venus inferior conjunction on 8/10. 40 calendar days before (7/2) a band of weakness has happened each cycle that lasts 10 calendar days. That would be 7/2 to 7/12. On several of the cycles the sell off continued until the conjunction. One possible play is that the market rebounds to ATH by 7/4 and then 5% or greater sell off from 7/4 to 7/12.
Valley, I see this conjunction 8/15. Same Venus ? 😉
You are correct.
Hi folks, hope everyone is keeping well.
I mentioned the Russell a couple of weeks ago as
to me this gave a indication that the US cycle did
not appear to be rolling over, at this point.
Since then we have a clear new high in the RUT,
so yesterday’s revision to Q1 US GDP comes as
no surprise.
My own window, first mentioned 18 months ago begins
next week, however for this to be validated US macro has
to come off hard over the summer – and at this point
that does not appear to be happening.
You can still have a correction without the cycle rolling
over, however there is a big difference between a correction
and the ending of the current bull market.
Stay openminded folks to the upside, as well as downside.
The US economy is firing on all cylinders?
http://www.alhambrapartners.com/2015/06/23/manufacturing-better-be-isolated-or-the-aberration-becomes-universal/
Only if you get your news from the BBC.
Bruce, in terms of a crash( short term) you may need a
Greek default imv and some dislocation following this.
We are overdue a 10% correction on the SPX on
about any historical metrics, a crash, if you define
this as some condensed short term rapid decline,
will require something significant on fundamentals imv.
Welcome back Phil, great to see your ‘new’ insights.
Why do you think ‘something’ has to happen to cause a crash?
This wasn’t the case previously:
‘There was no particular event which caused the crashes in 2000 and 2008. Extreme overvaluation, created by warped Federal Reserve monetary policies and corrupt Washington D.C. fiscal policies, is what made the previous bubbles burst and will lead the current bubble to rupture.’
https://www.theburningplatform.com/2015/05/26/why-stocks-will-crash-in-two-charts/
Is it just something you *believe*?
6/25 8:52 Spiral expecting a low 10 – 11 ET and a sharp reversal UP.
GM,
I can’t take you seriously.
You have been Wrong on the timing of a correction –
it never happened.
Wrong on Gold.
Wrong on longer term US rates with
your “fake out” comment.
You are fantastic at sniping though.
At least Man Up and admit that your
correction call for March was Wrong.
You must be due a half decent call at some
point, stopped clock etc.
Keep sniping, it’s funny.
Phil, am I not allowed to present some serious research to help readers here be duped by the stuff you post?
As for the correction, no, it hasn’t happened yet (I’m not a trader, so I’m not bothered by that). Medium to long-term is my area.
As for gold and bond rates, it’s far too early to declare a verdict on either of those, and I remain confident in my view, especially with regard to gold.
Enjoy your window, I’ll be glad when it’s out of the way and you stop the daily mentions.
Any more holidays due?
In 1980 the Sun Spot cycle did not pull Gold and Platinum higher but only Silver. It was Silver that pulled Gold and Platinum along for the ride and not the Sun Spots.
In 2000 the Sun Spot cycle pulled the NASDAQ higher but not the DOW or S+P 500. It was the NASDAQ that took the DOW and S+P 500 along for the ride.
In 2014 the Sun Spot cycle pulled Crude up but not to a new all time high and only Crude and not stocks.
Stocks are not crashing because SC 24 never did pull them higher.
This means the next potential stocks crash will be in 2025/2026 by the 19 year cycle that might just include something of the Sun Spot cycle with it.
To put it bluntly, the Bull Market in Stocks has nine more years to go.
Opps, I meant the Bull Market in Stocks has eleven more years to go. I now look for “The Top” to be in January, 2026.
Ref event to cause a crash. The event was inverted yiels curve. Even after it happened, it took a while to actually hit. A rise in interest rates are negative for the mkt. It is not that simple though. Interest rates went up from the late 1940’s to 1980. The stock mkt had a tremendous bull market from the late 1940’s to 1966. After that the market had a tremendous bear mkt to 1982. During the bull mkt phase (1950 to 1965), sharp rises in rates associated with a very strong economy caused short relatively minor bear market. The demographic and solar sell signals have not worked. The deflationary spiral sell signal in Jan did not work. The end of QE has not worked. Will this rise in interest rates, if it continues, work?
Kent, don’t you think inverted yield curves (or any curve shape) is just the state of the bond market? Hard to deem that an ‘event’. Just money moving, and ultimately that’s what causes a crash. Why the money moves? Solar activity, human emotions, business decisions….many many factors, which are cumulative as a bubble develops.
My understanding of the inverted yield curve it shows the real economy is putting on huge credit demands for expansion, inventories, payrolls, etc. The immediate demand causes short term rates to rise. This real economy demand for money leaves the financial markets, esp the stock mkt, high and dry causing it to drop even though the economic news is great. The opposite happens during a recession when the mkt is low.
The 1929 stocks crash was caused by two major Cycles aligned together: the 19 year cycle and the Sun Spot cycle. The last 19 year cycle top and crash was one year late in 2007 and isn’t due again until 2025/2026. Because it was a late high points to the market being a strong Bull Market and that is exactly what it was and most likely still is. Add to that the Sun Spot cycle high not having any major negative effect on stocks points to it being another late major cycle high and that means a continued major Bull Market in stocks.
Two major cycle tops being late highs points most strongly to the stock market being a very, very, strong Bull Market with many years to go before it tops and crashes.
Is the 19yr cycle the lunar standstill cycle? I did a backtest and statistically could not find anything. I did find a correlation with the solar cycle.
Richard, do you mean a secular bull market will continue until 2025/26? Presumably we will have cyclical bear markets along the way? How do you square this view with US valuations, which are already indicative of a miserable decade of returns ahead?
6/25 11:02 Next price target on the upside is 2134
6/25 11:09 short term price target 2120
6/25 11:11 very short term price target 2115
thanks peggy for the frequent updates. how are we doing?
Peggy, is there any way you can track how well these calls have done? That would be helpful.
6/25 10:30 pm Spiral update. Expecting a lower low at 2062 July 1-2. Forecast a low of 2091 for 6/25. Target hit tonight. Expecting a bounce now but tomorrow is forecast to be another down day.
When will gold ever go up?
Harry Dent: no, due to demographics.
Marc Faber Jim Rogers: sometime soon, accumulate.
MSM: could go down to $850
Peter Schiff and Jim Sinclair: $3000 next year, $5000 year after.
Me: high of $1400 in October, ends year at $1275. Next year average price $1300.
Wait for the real rate of inflation to turn positive –
John Li, thanks for making me laugh with that comment.
I share your sentiment entirely, it’s been a long 4 years.
The answer is it will go up when the confidence in all the other sh*t goes down.
Not much longer to wait I reckon, the ‘sale’ goes on, so keep buying the hard stuff, and keep patient. Our rewards will compensate us for our patience.
This year in autumn and the final low is next year ´8 year cycle low… EW shows the same.
http://practicaltechnicalanalysis.blogspot.co.at/2015/06/goldsilver.html
The first descent gold analysis I have read so far…. great EW and cycle analysis.
Confirms my theory and counts.
http://www.safehaven.com/article/38076/gold-the-big-picture
Exited short position today. Looking to go long next week. Have a good weekend!
Are you taking Friday off then? Alright for some!
welcome back Phil, hope you had a good break.
My suggestion to you is to share some idea how you are trading (or whatever you do) your view. At the moment, it seems that your contributions are more concerned about providing a general commentary (and perhaps, to be proven right for some internet penis extension) that to be honest may only be of very vague interest to long term investors…and even then that is stretching it.
I obviously know that I don’t have to read your posts, but in order for them to be vaguely relevant to anyone, this would be my feedback.
I haven’t counted, but I suspect the percentage of your posts that contain the words “as mentioned last week/month/previously/18 months ago” etc – has to be over 60% at least. I don’t know why you feel the need to do this, but as I said above – I would try to share something worthwhile once in a while to keep yourself relevant in some way.
Thanks
J
Jegersmart, I feel differently. Perhaps by referring to his past comments, Phil is only saying in a roundabout way it’s important to acknowledge what one has said in the past, and whether it’s been right or wrong. Now someone may construe that as pumping oneself up (assuming the poster has been right in their past calls). The key will be when those past calls turn out wrong – does the poster also cop to that as well.
Look, no one is going to be right 100% of the time, we all know that.
Hi Gary
Sure, but what is the point of discussing his predictions over and over again without any practical views around how he is positioned? Surely then the only motivation is to be right because there is no action. I am pointing this out purely to highlight that in case that was not his intention.
I think the market is going to go up or down in the next month, and this will either be due to more sellers than buyers or vice versa. I have been saying this for 20 years. I have been right for 20 years.
What is the point? When GM gets into him above, he then finally reacts violently and sarcastically saying that “you must be due to correct call soon”…..etc……so maybe it is just about being right on an internet forum?
imho
J
My 2 cents
The best elliot analyst I know has publicly put it on the line
http://www.pugsma.wordpress.com
thank you…
Interestingly his count would mirror precisely what Armstrong is expecting.
Those returns may look high, but factor in rising inflation, and you’ll still be losing money. We shall see.
The average Sun Spot cycle is eleven years. Eleven years from the 2014 peak would mean that the next peak should be expected in 2025 which is the exact year that the 19 year peak is also expected. The last time that happened was in 1929.
The last 19 year cycle peak was a year late in 2007 which tends to mean a stronger bull market than normal. The current market did not peak in 2014 which is also pointing towards a stronger bull market than normal. Both those cycle highs being late points towards a very strong bull market and to the next tops, in both cycles, which are due together for the first time since 1929.
This is a profound possibility that is not being considered (and helps to explain a great deal of what is going on and what is not going on).
Sorry but too much posts about crappy cycle counts – so here some Hurst cycles.
The next top will be much earlier…… the 18 years cycle top will be before 2020.
http://practicaltechnicalanalysis.blogspot.co.at/2015/03/very-long-term.html
Thanks Karni. Interesting but why the f**k do these people use 9 year cycles when they seem to be either 7-8 years in length? Why not a 149 year cycle that is actually only 7/8 years in length but explain the difference by the nonchalant use of the word “nominal”?
I will have a 7 inch foot-long hotdog please……
J
The theory says Hurst cycles are 54 years 18 years 9 years 54 months 18 months 9 months and so on.
But cycles for different stocks, indexes, gold what ever asset have different length. Sometimes 7 years sometimes 7,5/8/8,5 years, but this is the same “nominal” 9 years cycle from the theory.
Take something what you want to trade mark the important bottoms count their length and find the average – you work with this.
The 9 years “nominal” cycle has 7-7,5 years average length for stocks, 8 years average for gold and so on:)
Karni, I am open-minded as to the existence of cycles, but what results would have following them have produced over time? Would investing around these dates have beaten buy-and-hold?
I do not know, I am not long term investor.
Cycles are great in spotting bottoms and how important the bottom is, not so good for tops. So they tell you when there is a low risk for an entry point, but you need other rules when to exit the market.
I combine technical analysis, elliot waves and cycles for better results.
There are guys using cycles for trading…. but this is not my style.
http://hurstcycles.com/
Slater and Karni
These counts display potential similar longer term results it seems to me? The main issue I have right now relates to debt and the fiscal drag it has started to impart and will increasingly do into the future. This doesn’t relate particularly to stock markets, as they are almost always wrong in terms price, so it is absolutely conceivable that the SPX can go to 4000 or even 6000 over the next 10 years but in terms of price action it makes sense to me that we have to have a decent correction to backtest the structure we came out of after 2009 – 1575 SPX seems reasonable. I did say that it is conceivable that the SPX can go 4-6k in the next 10 years (mainly because the market is always wrong imv) but I do struggle to see where that money is going to come from, and here is why:
I think we will have declining incomes in real terms for some time, perhaps decades. I don’t think we have felt the real hit of our money being devalued in order to bail out banks yet. John has mentioned demographics a number of times. Over longer periods these can become very important. There will probably be a large war in the next 10-15 years. Governments will not be able to control “deficits” and so on, whether by austerity or printing money so the only way to rescue the situation is to wage war on the taxpayer or put in place new regulations that basically gets around the problem (for a while) or a mix of both. That doesn’t mean that the SPX can’t go to 4000+ in 10 years I guess, but I do find it hard to see where this “money” is going to come from……
J
I can read charts economy is not my strength:)
I see exactly the same things like you and I am especially scared of war… very bad thing and high probability there will be one when everything starts falling apart.
But what the charts are saying:
-stocks – I see descent correction like you and probably testing the breakout in 2016 than final bubble.
– gold – I have posted above link to the charts – low next year(or early 2017) than huge rally with new highs
– EURUSD – the end of major correction and major cycle low(18 years nominal cycle:) are close probably early next year. The other pairs yen aud cad are telling the same story. Multi year decline for the USD.
All this is pointing to the same at the same time – huge moves higher in different assets, the USD thrown under the bus… this translates to me high inflation.
My explanation the bankers cartel will try to save the system which benefits them at any costs…. what is the only think they can do an doing all the time – creating money/debt.
This will cause the events above and work for a while until some day all falls apart and the reset starts.
New post is out