
In six charts.
1. Showing a 6 month negative divergence in breadth and strength like that in 2011:

Source: Stockcharts
2. Plus a similar period of divergent money flows:
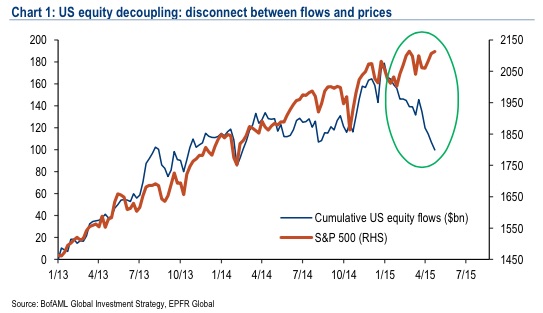 Source: Emma Masterson
3. Plus a sharp divergence with the economy:

Source: Yardeni
4. A mid-2014 peak versus the dollar
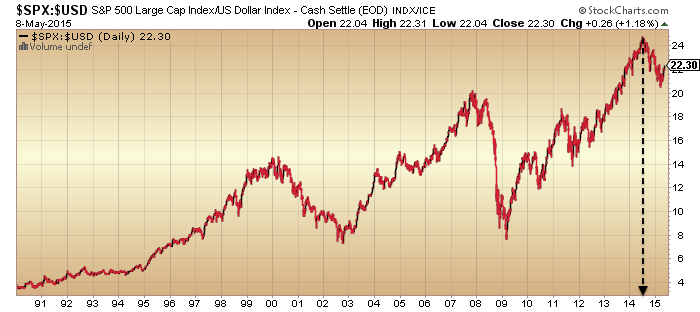
Source: Stockcharts
5. And a mid-2014 peak versus bonds
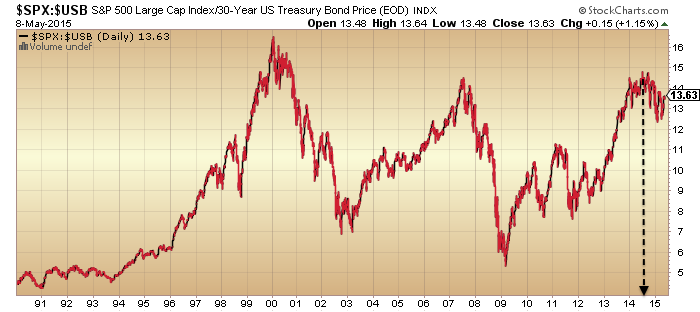 Source: Stockcharts
6. And put/call ratio at a level previously associated with a peak:
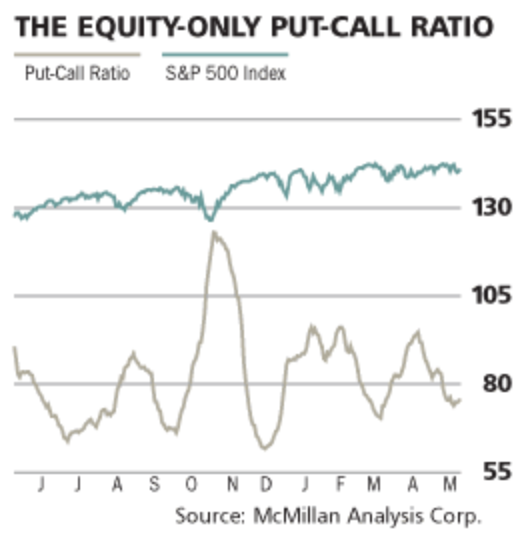
Source: Barrons

Thanks John. Concise and to the point again.
Loading up on silver miners from here over the next few months. Over 90% of silver producers can not produce profitably at these levels and BHP is hitting the wall in RE to silver.
There has to be a major wake up call in regards to the global silver market, it is 100% inevitable. Silver production is unsustainable at these price levels.
Hey Allan.
Re your comment on the previous post:
‘You couldn’t speak a bad word about it without getting dragged out into the street and beaten to within an inch of your life.’
That was a classic line, thanks for the laugh.
It has, however,slightly put me off visiting Oz!
😉
Silver is a by product and miners will produce just for cash flow if nothing else.
It is true that the 7 and 11 year cycles plus seasonals are due to bottom this summer in silver, but in long term bears like now they can extend quite a bit and not rally that much. Looking better for the bears but when I anthropomorphize the market as a sadist, it would have a smash to a new low this summer to wipe out the bulls just before a good rally does start.
Yes Kent and therein lies the problem. The whole global base metals mining complex is headed into deep trouble. There are some very serious issues developing.
GM, glad I can give someone a laugh occasionally.
Just to expand. I don’t believe for one moment the figures that GFMS publish regarding suplly/demand and significant silver oversupply.
Secondly the scaling back in base metal production coupled with a dramatic increase in investment demand will start the ball rolling and as time goes on it will fuel itself until the bubble bursts.
Given current “market conditions”, such as a shortage of Treasuries, the argument for a stock crash should be based on a desire to hold Cash instead of stocks (or Treasuries). A stock crash might also be in the works if the market comes to believe that the FED can no longer control short term rates.
The move higher in stocks is not being caused by the FED but by government (US and northern European) treasury departments not supplying enough government treasuries for the market’s investment desires. Investment money does not want to go into real estate or commodities (at this time) so, by default, money keeps moving in to stocks because money can not go into treasuries due to the declining supply of desired treasuries –unique in this time period.
Should current “market conditions” persist, as in a low supply of desired government treasuries, then if money stops going into stocks it may start going into commodities or somewhere else.
I know that this is difficult for the Middle Class to understand but the FED has lost power. The FED has become impotent. The FED’s god like power was always conditional upon the government requiring more money to borrow than what the market could provide. But that is no longer the case. In fact, the government is decreasing the amount of money it needs to borrow thereby cutting the balls off of the FED.
Low interest rates is not feeding stocks higher but the decreased amount of debt instruments available to invest in is what is continuing to “push” stocks higher.
Now, with decreased government borrowing needs, the FED is the Wizard of Oz or the emperor with no cloths.
Get a blog bro. Stop hijacking John’s site with your aimless drivel.
echo that, and same to all the other incognitant parasitics
‘if money stops going into stocks it may start going into commodities or somewhere else’.
Pure genius.
Richard whilst I agree with the logic that you propose it’s incorrect to say that it’s not the Fed who caused it.
It’s their unnecessary easy money balance sheet expansion that has provided the ‘extra’ cash that is trying to find a home. Without the Fed there would not be that extra cash….so in my opinion they ARE the cause.
The rise in the SM due to lack of Treasuries is an EFFECT.
Just put a small long on the dax. Still expecting 12000 to be hit this month.
So what? You want applause here?
Hampson, you know I agree with you, but to counter your 6 charts, what do you think of these 4?
http://www.bloomberg.com/news/articles/2015-05-11/a-former-pessimist-on-why-the-bull-market-isn-t-dead-yet
BTW, do you mind sharing your thoughts on the SPX near new highs again? Is it time to reduce positions or hang on?
IMO, the first two reflect the longer term demographic trends, the third the money flow neg divergence and the fourth the deflation danger. I don’t see the bullish case from them that he does.
Me, I’m hanging on, mainly due to the first chart in the post – I don’t see any momentum break upwards as likely – just a few points max.
It sure has the feel of a pullback (4th primary wave?) imminent (commencing), but in all power of imagination it is difficult to imagine the incredible absurdity that would give the laggards a second chance to offload and create a higher high. Unfortunately that is exactly what EWT predicts. Yes – beyond belief.
What is not so framed is the consequence. An unbelievably harsh winter.
‘So what? You want applause here?’
Dear GM
Suck it, form a queue
I agree that stocks are going to crash but now is not the time. There is 900 billion sloshing around trying to find a home in German and American short dated debt instruments. The German and American treasury departments aren’t creating a “supply” for that “demand”. Soon, that money will slosh into equities just when the equities stock-buy-back machine cranks up again. This will result in new ATHs for the major indexes especially with the Chinese CB encouraging ongoing speculation in Chinese stocks.
Gold is going to do the exact opposite of Copper for the same daily pattern reasons. Copper made daily higher highs and higher lows then surged higher. Gold is making daily lower lows and lower highs and will break lower just like Copper broke higher. I don’t agree with everything that Prechter says but this point is valid: “There is no such thing as triple bottoms”. Gold has made a “double bottom” and when it breaks lower, soon, it won’t make a “triple bottom” but will break to new lows as stocks break to new highs.
Also note that even though solar activity declined in the past several weeks it is increasing again. Research needs to be done to see how close to the Sun’s equator Sun Spots must trend to before they totally disappear.
Sometimes the MACD Histogram signals a “turn” at its on extreme but other times the “turn” doesn’t happen until the Histogram crosses the zero line. This analogy may apply to this Solar Cycle in that the “turn” in stocks isn’t timing in with the top/turn in Sun Spots but when Sun Spots totally end which would be similar to the MACD Histogram totally ending by crossing the zero line.
As a self-professed reincarnation of Nostradamus what more should we do for you but kneel and kiss your ring?
Thanks, Richard. You agree with Nicolas and give the reasons for your thesis. You’re big picture view is credible. You don’t preach, just provide facts interconnected with logical reasoning and whether your predictions are realized (as the market can be turned in any direction in the short term), well worth keeping in mind the possibilities you outline. Gold will probably have its day, as well as silver, but as you have stated there could be a better entry point this summer, maybe in August.
Thanks. I agree that it is not really the equity and bonds that matter — it is the fact the equity+bonds=100% now at extreme highs, when in the past, people wanted private equity, hedge funds, commodities, gold and real estate as well.
John Hampson: Here is a new thought. What if the Human Herd of speculators are Drug Addicts? Meaning that some minimum level of Solar Activity has to be absorbed –before– the Human Herd “feels” satisfied? This Solar Cycle has been so impotent that the “minimum” of the solar drug hasn’t been absorbed to get that “high” feeling. Therefor, the Human Herd of speculative drug addicts will keep pursuing that “high” with low quality “drugs” (low Sun Spot numbers) until convinced there won’t be any more (Sun Spot numbers go to zero and remain there).
Mathematically, does the area under the current Sun Spot Cycle equal the average area of the average Sun Spot Cycle wherein what-ever speculative “high” was reached?
John Hampson: Your Solar Cycle theory may be correct but you may have made a false assumption. Instead of setting the first derivative of the Solar Cycle equal to Zero (the tangent line horizontal) as to when the speculative Human Herd has reached their “high” it may always have been the second derivative (area under the curve) set equal to an unknown amount. What this means is that you have been lucky in calling for the speculative Human Herd’s “high” to coincide with the tangent line equal to zero when in fact the area under the curve was the real indicator and it always had been met by the time the tangent line equaled zero or there abouts. But this time your luck has run out as the truth has never been when the slope of the tangent line equaled zero but always some unknown amount of the area was reached and that amount has not been reached in this Solar Cycle and might never be reached. Thus, the speculative Human Herd hasn’t had its “high” and might never get its “high” in this (drug) Solar Cycle.
Could be, interesting angle
I don’t mean to sound critical, just questionable? Why ask this now, versus in the past?
I have made a point that QE and demographics have created ripples in the pond that alter the wave pattern. It’s like cheating death, healthcare has helped us live longer, but you still eventually die.
There is likely a confluence of other waves going on here that we haven’t been able to point to. If I throw a rock into the pond at X,Y and somebody else throws another into point C,D of the pond a little while later, does the first person know about X,Y? John has been measuring C,D so far as X,Y was further back in time with less reliable data.
At a molecular level, absent psychology, all matter behaves by the same laws, but not everyone gets Cancer. It’s not always genetics (laws) , but people’s environment (rocks thrown into ponds by different people) that alters the future pattern.
Clearly John has not incorporated all pattern into amalgamated pattern, but he has tried and its quite convincing. He is not the first, and won’t be the last. The problem globally, is science is not focused on molecular behavior as a source of psychological behavior in investing, but proven to influence cellular activity through molecular changes in energy absorption and dispersement.
It all comes down to in quantum mechanics that light and matter are interchangeable. It’s going to take a long time before a lot of this becomes common understanding like Chemistry was in 1700’s and 1800’s.
Something appears to be a-brewing.
I’m watching the gold/silver ratio, it’s signalling risk-off, and a liquidity shortage.
US/UK bonds being sold as equities fall also signals a liquidity squeeze.
Margin call anyone?
Yup, your margin of arachnid embodiment deserves a call.
And the call is Please Leave, on all legs if possible.
Are you William Wiser using another login?
Same superior style.
I like you.
Suck it
‘Suck it’.
Seems this gentleman is eloquent as well as brim full of good manners. (Such a personality can only have been formed amidst a truly miserable and loveless life, I for one pity the poor soul.)
I do hope JH is watching, for everyone’s sake.
Peter_, please share your knowledge of markets, EW etc. Value your opinions.
Dear Valley GM,
I choose the left handed version.
Please tell your right hand side to suck it.
Dear Purvez,
I was originally just one of the myriad. It cost me quite a lot to be a believer.
And I stumbled, but I did not fall further.
Because then I stumbled upon a difficult thing to get a grip on.
You see I was like the myriad, I was looking for the enlightened.
So that I may mimick them, because I doubted myself.
I found the greatest enlightenment here, but to no financial avail.
Even though I went along with all the certainty, I hedged every step and thereby survived it.
Nonetheless I know the long term truth resides here, and I would like that I should not discard it.
And I realise that I have prehistoric influences which resurged into my reaweking via EWT.
And if you are taken in by this waffle then you have no hope against the influx of the pros hereon.
You see the pros can smell a mark from the moon.
And you are a mark
Peter_, please may I ask, what is your motivation in visiting this blog?
Peter_, lest you chide me for my grammar, let me rephrase:
What is your motivation for visiting this blog?
Jeez, shocking grammar purvez. Sort yourself out.
🙂
(Actually, ‘in’ works perfectly well in the sentence, you’re too hard on yourself).
🙂
John H, I’m not fully understanding your 2nd Chart. If cumulative equity flows are turning lower i.e. money per period is being taken OUT of the market then there must be something else replacing it plus MORE for the markets to continue higher.
What, in your opinion, is replacing the outflow?
Or have I completely misunderstood the chart? In which case a brief explanation would be most welcome.
Thanks as always for your research.
Stock buybacks
Also, does this add ETF flows? Mutual funds have been losing to ETFs
Thx John Li. I was wondering whether a proportion of that gap came from the clandestine activities of the CBs and since the other sources you mentioned can be quantified from publicly available data we might get a monetary value of their involvement.
It might be ‘a’ means of arriving at a figure.
Good point!
Your answers are as good as my opinion
BTW, JCB is buying ETFs at 50% of the market share, so our answers are not mutually exclusive.
Oh dear, first Wiser and now Peter imploded. *Sigh*…..I wish them all the best and hope the drinking abates somewhat during trading hours:)
J
Oh dear, not my Jeggersmart?
I thought you would advise on the markets.
Did you not see the double top on the laggard SPX500 breaking back into its gap?
Where did all the fundis go?
Does anyone have the faintest clue? (preferably based on their record of uncluelessness)
“People, people who need people, are the happiest people in the world.”
Barbra Streisand
Still long……..I see the negative divergence.
Citi Econom graph would suggest to me we have a wall of fear with the economy to climb, plus we have low volatility….ergo we go higher.
Will.
Made back a good fraction of my bad on Friday (being short into gap up) by reentering short on SP500 near highs today. Hope to exit tomorrow with more, as Bundegeddon, Greek Tuesday payment due, and US treasury action today. Also SF Fed Chair was quoted as being more hawkish than assumed. Stay greedy my friends.
Lunar Chord is crystal clear bullish until Friday, so this is definitely trading on news and price action, hence my getting out by tomorrow. Tim Bost is saying Friday Mercury Retrograde New Moon combo is bearish for some reason. So will proceed on bullish side with caution if I do go bull.
Good stuff for you again today, nice one.
Bradley Turn Date of 5/10/15 in affect as outlined in my previous posts. should the after hours sell off continue into tomorrow, I anticipate a full retracement to the early april lows of 204-205 on SPY before the middle term turn May 24-25th takes up to a terminating diagonal at 2135-2150 in Mid June. then the fun begins:)
Peter said:
“Oh dear, not my Jeggersmart?
I thought you would advise on the markets.
Did you not see the double top on the laggard SPX500 breaking back into its gap?
Where did all the fundis go?
Does anyone have the faintest clue? (preferably based on their record of uncluelessness)”
Just trying to inject some humour into the rude and indecipherable postings of certain “participants”.
Peter, instead of just insulting and talking down to people – especially with hindsight calls (as per above), just put your money where your mouth is and let us know when you see something and how you traded it. I would be the first to congratulate you on successful trades and the last to criticise if they go wrong.
I just don’t understand the need to belittle others. Maybe you have valid reasons and want to talk about it?
J
Oh Nooooo J!?!? What are you thinking?
Let’s not encourage psychological sessions here, please.
🙂
For tomorrow 5/12, the Spiral expects a low at 2:00, a high at 5:30 and a low at 9:10 est. and expecting an important low on 5/15
Peggy, I’m not understanding your comments. You mention an important low by May 15 and yet your post below says we are headed HIGHER to 2041by the same date.
Perhaps you meant important high? Just trying to clarify.
Thx for posting.
Peggy please ignore my comment above. I clearly have VERY poor mathematical abilities. 2041 is LOWER than where we are today!
Embarrassed and hiding under the blanket!!
Price is headed to 2041 by 5/15. Here’s a link to the 7442 Analytics Spiral chart
The chart is not posting for some unknown reason – it’s on a public FB page 7442 Analytics.
Hi Peggy, i am reviewing the 7442 facebook page and can’t find the 5/15/15 prediction. what date was it posted? the spy target coincides w/ my expectation of an 80 point spy drop since the bradley turn date on 5.10.15
the top post on the page – posted 8 hrs ago and the followup chart below it posted 2 hrs ago.
I saw both of those pages, but I guess I don’t know how to read the charts to see how you extrapolated those price targets.
https://www.facebook.com/pages/7442-Analytics/186938551317676?fref=photo
The first chart shows the Spiral forecast of price showing the path from 5/8 to 5/14. The actual low is forecast for 5/15 and the second chart shows the price targets. M2 was reached today and RefZ3 is next.
Peggy I’m trying to ascertain the cost and details of what’s offered by the 7442 service. Please would you have a link?
Thanks Peggy, I can see those targets on the second chart and see what appears to be a significant low on 5.14 at 10:40 am cst. and the next low on what appears to be close enough to be the 15th.
how do you interpret that the 4 successive lows represent refZ3 at 2041 and not another number on the grid? say z2 at 2091 or ref z1 at 2013?
the lows coming up don’t seem as deep as those of last week. I’ve very curious about the spiral grid as it compares to bradley’s turn dates. the software is very expensive though.
Purvez -mor send 7442 Analytics a message on their FB page for more information.
Scott – the Spiral price path is like a swing and the actual low or high does not come in at the highest or lowest point on that chart but rather, where momentum shifts to the opposite side. Also, the major shifts in price momentum occur at either “Singularity” or “Expansion” – these are the times where the Spiral is most contracted or most expanded. We are in the Singularity transition right now so a low is expected. The previous wave predicts the current one – reaching M1 and reversing predicts RefZ3. I hope that helps.
-mor =typo sorry
Thanks Peggy, I will have to read up on thehttp://7442analytics.com website
there are some resources on the site I am going to read up on. regardless, given the positions I put in place prior to today’s action, if we get 2041 on/before friday, I will be one happy camper.
http://7442analytics.com/wp/?page_id=67
Purvez, you can copy and past either of the links to get more info.
Scott, to be more precise:
The statistical equivalent of M3 is Ref Z2. Last Thursday and Friday’s upward range is proportional to the upward velocity magnitudes on those days. The “Mirror Image” of those upward days is 180 degrees around the Spiral on May 14th. May 15 is another smaller downward day which causes a lower low near Ref Z3.
ZF indicates the statistical distribution of the velocity profiles, indicating a 82% probability (100%-17%) that price will move downward to the RefZ2; because the velocity profiles ARE a statistical distribution.
fantastic reply. Thank you!!! have you utilized the spiral to your trading benefit? or just back tested to the dataset on the facebook site?
It is the only trading strategy I use.
Did you purchase the updates? or do just track the daily/weekly info available on facebook?
I purchased it.
sweet. I am very curious how it works. How long have you used it? do you have do you have targets for next week and monthend?
the next bradley turn date is a middle power. I anticipate the May 23-24th date will start the 5th wave ending diagonal and I am curious what the spirals indicate for the week of the 25-29th
I have so many questions:)
here’s a link to the Spiral May 3 to June 5. https://twitter.com/mjmateer
yes have targets – including very long term targets. I haven’t looked closely at next week but should be high to low to high.
looks the the spiral nailed last weeks lows and highs. I am impressed.
@scott_minnesota
The Spiral is now expanding and polarity has changed. I’m correcting the times today to cits – 2:00, 5:30, 9:10 and 14:20.
I was following these turning points and they were very accurate on timing, but completely flipped on direction. Do these timing signals work like every other timing signal — are they reversal points?
Jackie S – The Spiral has a center charge which changed polarity yesterday and will change again on 5/25. My error in not assigning the correct polarity to the 2:00 and 5:30 cits. I posted the correction in time for the 9:10 cit.
Hi Peggy,
Is the Spiral indicating a low on Friday with a bounce into next week or do you expect the weakness to continue for most of the week of 18 – 22 May?
Cheers
Kurt
Request: keep it respectful. No name calling or vulgar comments. If you don’t like someone’s comments just move on and read the next. Encourage people to post, don’t chase them away. Too many discussion boards out there where slanging and slagging are the norm.
John H you must have been AMAZING in the précis section of your English class.
Your ability to say the most in the least no of words always makes me smile.
Agree, John. The name calling is juvenile at best.
Nice rise in european bond yields. At least the ECB has something positive yielding to mop up with their QE program. The corresponding drop in european stocks once again presents a buying opportunity due to the panic selling of bonds leading to panic selling of stocks. I have added to DAX longs at 11477 with a target of yesterdays closing price by end of this week. US markets giving more and more evidence of a top every day.
Stopped out -50. The sell off is more powerful than I expected but its cause is mostly the bond yields so I would expect an equally powerful rally once the panic stage is over. Sidelines for now.
Every man and his dog expecting gold to break $1100 as opposed to 2013 when every man and his dog was expecting $1500 to be the floor!
It appears to me most everybody and their brother are expecting a new bull mkt.
Like me and my brothers….in gold.
I agree. Most gold bugs are sure that the bottom is in or that it will be in very soon. I believe the surprise could end up being to the downside. The most obvious EW count (to me) projects gold going below 1000, and maybe below 800, before a long term low gets put in.
Maybe, I am ambivalent about *the bottom*, looking at a 20+ year time frame so these prices are a brief buying opportunity.
The reversion to the mean trade implies the prior breakout area of 1575 on the s and p, may eventually come into play later in the year, over extended markets do tend to correct violently. With all the divergences in the vix, transports and summation index off late, we may just be in for an old fashioned retracement. Greece is just the excuse.
The question should be – is the selloff of bonds just taking a breather.
The future of global bourses depends upon the answer.
The reasoning being (for purvez) that it is all and only about the expectation relating to interest rates and thereby the extent of free money (within the gamble zone) going forward.
That is how we got here and that is how we will depart.
As for the infection of the self-righteous, victim seeking pros; I do not expect anyone to understand. That is the precise premise upon which they will operate to the detriment of all good people.
More food (new post) for that thought thing… maybe?
http://barestbodkins.blogspot.com/
I agree with you Peter, I just think it is unnecessary to have such a bad attitude. But meh….keyboard warriors will be keyboard warriors I guess….
J
We had a US 10 Year yielding near 3% late 2013
and it did not topple the bull market.
So you say it now needs to go above and beyond that quotient? Perhaps the introduction of a directional sentiment indicator may create some ethereal equilibrium on another plane? Just wandering…
Real Estate, housing is a huge contributor to the economy. Lumber, copper, carpeting/tiles, oil, shingles, furniture, etc and all the service needs of all those employees. The Japanese stock mkt, economy, and RE all peaked around 1990. The US real estate mkt peaked in mid 2006 and the the rest were deep in trouble by late 2007. Chinese real estate peaked in Aug 2014. A lot of information is indicating it is already in big trouble, not clearly evident yet though. Living on borrowed time?
To the EWers on this board. Just wanted to get your thought on today movement. The early sell-off, then quickly reversed today makes my SPX counts as cloudy as ever.
Call it a major manipulation or the Fed buying or whatever it was, but the buyback took place today surely looks suspicious and artificial. I think the overnight break down below 2092ES should have had the market dropped at least 200 points today, because SPX only completed 3 waves up off the last week’s lows.
The break below 2092 already invalidated the potential impulsive 5 wave count, a move up off last week’s lows I would like to see to confirm a summer rally to 2215+ for the c-wave of a larger degree wave 3 off the beginning cycle on 10/15. Instead, SPX held support, then turned back up through 2092.
This move forces me in a non preferred count, especially if SPX goes on to hit a marginal ATHs. My reason is that a 3-wave move off the last week low’s followed by a 5 wave move to new all-time highs potentially could complete the ending diagonal in the 2135-2165 range. If so, SPX would top imminently, either this week or next week. On a side note, a move up to a new ATH would also invalidate the Bradley turn date on 05/11, as this is supposed to be a wave down, and it is not expected to reverse until the end of next week, or the next Bradley turn date on 05/24.
EW on SPX right now is not helpful IMO. Too many alternate counts. Flipping a coin would work just as well for determining future price direction than trying to do it with EW. Sometimes EW works great and gives clear direction. Right now–and for the past many weeks–is not one of those times.
pimaCanyon. I don’t disagree that the EW count is not the most reliable tool right now, especially counting gold as the count is almost like throwing darts in the dark. However, SPX hasn’t been that bad. I believe that tomorrow will bring a clear answer, that the markets will either go impulsive up or violently down, setting a clear direction for the rest of this and next week.
I am currently short, so I am hoping for a drop. However, it looks like VIX is sniffing out a potential big rally. In addition, the commercials have already cut their shorts dramatically since last week, another sign of the markets anticipating a big rally to come.
eric, I follow the DJIA. The best I can muster is an (A) from ATH to Mar lows. A complicated (VERY) (B) to Friday’s high as part of a developing flat. If this is correct then we should see a (C) down to Mar lows.
This final down wave ties in with Peggy’s and Scott’s calls, although their timescales seem a bit tight to get that far down so quickly.
We would need a 200+ point down day between May 13 & 15. Possible, but I can’t see anything on the horizon to cause it. Not even Greece.
Anyway the main point is this count is the ‘best’ out of a rotten bunch.
Thank you purvez. There are 2 main counts that I am banking on, a very bullish case, and a bearish case where my count is not too different from yours. I think it all comes down to tomorrow. I will make a decision to go long or short depending how the markets move tomorrow. Best of luck!
2 Previous Bradley turn dates in 2014 w/ 100/100 power declinations took up to 2 weeks to resolve w/ an 80-90 point spy move up or down. that brings us right to the bradley middle power turn date of 5/24-5/25. I took my spy 211s (5/22) off the table today w/i 5 points of the lows and reloaded w/ 5/29 210 and 208s w/i 5 points of the highs.
i anticipate us hitting both 204 and 2145 in the next 3-4 weeks. the move to 2145, i do believe will be a terminating 5th wave diagonal.
Peggy’s spiral indicates we will still see signficant lows 204-205 by 5/15/15
Thanks Scott. Great job with SPY!
I too believe that SPX 2140 is crucial top, a potential turning point.
Tomorrow moon one day from equatorial crossing, Thursday equatorial cross occurs. Looking for added market energy to upside or downside (about double normal price moves) next two days.
I do wonder if the sun is heating up again, and perhaps bringing a new solar max which will explain why the market has not yet crashed.
http://solarham.net/regions/map.htm
All you continuing gold bears have got it completely wrong. How do I know?…because triggers are going off in gold stocks like popping corn and gold gold stocls ALWAYS, without exception have lead the gold price off bottoms.
Lastly I mentioned the other week to somebody to watch for Crocodile Gold’s latest earnings announcement. They nailed it again in the hardest environment for gold producers in years and it is only going to get better for them.
http://www.crocgold.com/news/news-releases/news-releases-details/2015/Crocodile-Gold-Reports-Strong-First-Quarter-Results-Cash-Operating-Costs-of-683-per-Ounce-Lower-Than-Full-Year-2015-Guidance/default.aspx
http://business.financialpost.com/news/mining/mining-heavyweights-seek-to-build-mid-tier-gold-producer-in-190m-newmarket-crocodile-merger
Yes mate, bigger things are coming 😉
GM this could be a signiicant week for silver as I mentioned the other day. And I am not referring to percentage gains, although that looks good today.
The Spiral expects a high today – 11:30 to 11:50 cit.
Hi all ! Looks like Allan is right about Gold. As I said before, I think the big theme for the rest of the year will be commodities, and that includes Gold. So, I think commodities will outperform going forward.
However, I still don’t see any hope for the bears. The stock market is still very well supported by central banks.
regards
Allan and Nicolas in agreement?? The end of the world is nigh!!!
You have to give it to Nicolas — he has been spot on.
Well not all indices are risen. The DAX has been a poor performer of late and continues to do so. Central Banks don’t seem to be driving all markets up so you need to pick carefully. The strengthening euro is quite worrying for europe I think but will be quite supportive of US markets which I expect will break to new highs in the next few days before a fall once everyone comes to their senses and realises the euro is overvalued.
dollar breaking down out of top after parabolic rise on universal bullishness
situations like this usually produce large moves with high confidence
Per the 1980’s bull mkt in the $, it had a sharp correction (10 pts) after a 12 month run similar to now. On a very short term basis, the $ has been down sharply on heavy volume over the last few days. Just read a book by Larry Williams saying that is bullish. He noted all other things he has read says the opposite, he checked by the numbers. Being a $ bull, I am hoping the full 10 pt correction does not occur, that would take it back to the break out pt.
Newmont Mining breaking out of a nice 18 month base on double normal volume
Stage 1 to Stage 2 textbook move
Nice catch. Looks to be a classic cup with handle on the weekly, a la Bill O’Neil.
NEM used to be a $70+ stock back in the 2011 peak for gold. However, $28 level is/was a strong technical resistance level for this stock so be wary of slowing momentum near term. Having said that, it is only +50% from a decade long low.
Gold is looking good so far. The daily chart shows that the triangle may be about to complete in the 1240-1270 region, so I am booking my GDXJ profits for now. Good luck to those stay long.
I am simply move capital over to short the SPX. Markets are not decisive still, but it looks like more downside is more likely.
According to this P&F chart of the DJ Transports, over the past five months price has fallen to the 8600 support level on NINE separate occasions without follow through to the downside –
http://stockcharts.com/freecharts/pnf.php?c=%24tran,P
Gary, thank you for pointing that out, in my experience something testing a bottom that many times, when it finally breaks (and it will) the fall can be dramatic
http://www.marketwatch.com/story/an-important-dow-divergence-is-ominous-for-stocks-2015-05-15?dist=lcountdown
This P&F chart of the DJ Industrials shows almost a mirror image:
http://stockcharts.com/freecharts/pnf.php?c=%24indu,PWTADANRNO%5BPA%5D%5BD%5D%5BF1!3!!!2!20%5D
And lastly I point your attention to the DJ US Railroad Index – it is breaking down to new lows today.
Gold and commodities, bear rally. $, correction in a bull market. Miners sold gold massively the last time gold hit 1300, rather heavily at 1220. I am saying not so sure happy days are here again. Still bearish on oil as well.
Gold fell for 5 years before a sustained rally (3yrs)ocurred from the 1980 top. There were 2 short sharp rallies during that time: 2nd half of 1st year, and at the 2.5 year pt. Fromthe 2011 top we’ve had the 2nd half of the top year rally – $200+. The rally from the 2.5 yr mark, less than $200. This pattern may totally go away, but it indicates the 5 yr low not due until late next year. The 8 year cycle is also due Dec, 2016. So can the commercials top out this rally by heavy selling as they have the last several times between 1200 and 1300? Remember, commercials normally sell into strength and large specs buy into it. Specs move the market by overcomimg the commercials.
One other very bearish thing. What is the safest surest bet on the markets, now. Long bonds, because as Nicholas says, the central banks are on your side. Therefore, the hedge fund boys are using up to 300 X leverage so they can make some money on these super low interest rates. The recent rise in interest rates(drop in bonds) could have already wiped some of these guy out. Any further rise will reveal the skinny dipping party. The margin calls will eventually hit everything like in 2008. Yellen has been warning them for a long time, but were they listening or has the market jumped them?
Just a quick update;
As of today, my S&P trading system is on a fully Short reading…
That is, from a previous 50% short, it’ll be 100% short by COB today….
I’m already there…..and more….so just biding time…
Regardless, for anyone following, it’s a 100% short position as of today…
Thanks, and GL…
Barry
Barry, what targets are you looking for on downside, any stop if wrong? thanks
Get your popcorn ready and your head on a swivel…next 7 trading days should be entertaining or frightening depending….:)
i still think we will see a widening range of 205-214 in SPY over the next 3 weeks. Not for the feint of heart
I like your thinking Scott 🙂 The impulsive move up or down which should have happened today didn’t happen. That move should come this week, either Thursday or Friday. SPX spiked over 2107, but couldn’t hold it until close, a great indicator of a temporary top already in place.
Wave 3 structures are quite hard to count, but I am fairly confident that the market is poised to head lower based on today movements.
Solar Cycles; Elliot; and Delta; are all MODELS of reality and that is all that they are. None of them are “perfect” even though Elliot and Delta both claim to encompass all price action even though both are separate and exclusive of each other. Elliot and Delta only claim to represent all price behavior AFTER THE FACT. Elliot has “alternates” and Delta has “inversions”. The problem is that the current Solar Cycle “model” isn’t working.
The Solar Cycle “model” may be too simplistic and/or luck has played a part in its simplicity until this current Solar Cycle.
The top of the curve or when the first derivative is set equal to zero (which means the tangent line is horizontal) may have had “luck” with all other Solar Cycles until this very interesting one. As odd as this may seem the real answer may have been the height of the second hump, or cycle, high had to be exceeded by the first. I realize that this is time back wards thinking but it may be the “truth” to the model given that this cycle’s second hump was not exceeded by the first hump.
–Along this line of thinking the “truth” may be a number height that is lessor than the lowest height to date but higher than this Solar Cycle’s height.–
Another “truth” may be the area under the curve (second derivative) set equal to an unknown amount. If so, then what ever is the current area means that it is not enough, as of yet, and can be used to “back test” prior Solar Cycles.
Another “truth” may be that a third axis is at play so that they answer is a volume amount (third derivative) instead of an area under the curve (second derivative) or the slope of the tangent line (first derivative).
What ever the “truth” is for a better Model it might help to think (model) that the Public’s influence by the Sun is akin to a Drug as in Drug Addiction. So that with this current Solar Cycle, the Public is not going to get their “high” or “fix” to satisfy them (meaning that the Public will relentlessly pursue that addictive “high”) until the Sun Spot numbers go to zero or close to it.
I am still expecting the DOW to go to a new ATH by next week and for the adage “sell in May and go away” to be true this year. But I am not expecting “The Top” for stocks until this Fall.
Clearly, the Yen is in an Elliot sideways Triangle and that means that the Yen wants to break lower in another “impulse” wave. Considering the Yen, I think that the Euro will reverse at its 100 day ma and the Pound at its 200 day ma. This means I am also expecting the USD index to reverse and trade up to a new trend high as stocks trade correctively lower with “sell in May and go away”. This also means I expect Gold to trade to new five year low. Of course, this is also a warning that the Commodity Super Cycle deflationary low may not yet be in until latter this year too.
Fundamentally, this may be a powerful reason why the USD is going to reverse and trade to a new trend high (and stocks correctively sell off due to current “market conditions”) but that the US economy is not going to collapse and stocks will trade to “The Top” latter this Fall:
http://finance.yahoo.com/news/foreign-money-pouring-u-real-090000293.html
Note that the massive amount of money pouring into the USD will first go to land and then will move on to stocks. This obvious “delay” will be while US stocks sell off due to a rising USD because with the first quarter reports many companies said the high USD is hurting their foreign profits (and half the profits of the S+P 500 companies comes from outside the US).
Pop pop pop pop pop……the evidence keeps mounting amoung the scepticism.
http://stockcharts.com/h-sc/ui?s=USERX&p=D&b=5&g=0&id=p12027516660
BTW far more gold backing the Euro than the USD. May not seem important at this point but it will be. That is where MA gets it totally wrong.
Can you explain to me why gold matters at all? Isn’t it just another currency, and it has value only because traders/investors believe it will continue to have value? It has almost no industrial uses. It is used for jewelry, but that alone doesn’t explain why it should trade at 1900 dollars an ounce 4 years ago, and even at 1200 dollars an ounce today. So what if there’s more gold “backing” the Euro. That doesn’t make sense really because the Euro, the Dollar, the Yen, all of them, are fiat currencies and have NOTHING backing them. Neither does gold. It’s all a confidence game. At some point investors might realize that dollars are basically worthless. Then again, at some point investors might realize that gold is basically worthless.
pC, mate quite frankly this question is thrown around ALL the time and it is silly, because history shows it is what it is and nothing will change that.
If you found a 1 oz nugget in the ground tell me you would leave it and walk away?!!
PS Gold has a multiitude of industrial uses.
Zero gold backing the dollar, the gold is owned by the Treasury, the notes issued by the Fed.
Something like 350 billion euros worth of gold within the Eurosystem. Nice.
pimaC,
I would go and do a lot of reading on the subject of money, currencies and gold.
If you don’t grasp why gold is valued, you have a big gap in your understanding of finance.
Consider the following to get you started: every currency ever issued in mankind’s history has eventually withered away to zero value, yet gold stays the same for thousands of years, untarnished, still the same asset. Then consider those who have massive amounts of excess production that they need to store for future generations, over hundreds of years, (oil producers currently a good example).
It’s so obvious.
Gary, Nicolas and myself are poles apart. I went long gold stocks whilst he was shouting to short them. He is calling for a commodity rally saying go long BHP,RIO etc whilst I am saying all commodities will collapse including oil and suggest staying clear of BHP,RIO etc. Gold btw is not a commodity.
He is bullish all stocks indices I am bearish.
Well said Allan. Nic’s bull call on commodities will be remembered as well as his CB faithiness.
Allan, I was kidding – for the exact reasons you describe.
Gary, I know your comment was tongue in cheek mate. I was just driving a point 😉
With regards to gold, just from a logical point of view there is only history on its side as a “store of value”. It could have been decided that anything else relatively rare could be used instead. Whilst I do suspect that we will see gold at $5k within a decade, I am aware that things can potentially change very quickly even if they haven’t for centuries. When the monetary system finally fails, who knows what the situation will be?
Hopefully, we will move away from needing a form of currency to survive – in which case it will be irrelevant whether one holds millions in treasuries, stocks or gold and perhaps is a moot point all round? Unfortunately, I suspect that humans will not be able to make a transition to say a resource-based system without a lot of pain…..
J
‘just from a logical point of view there is only history on its side as a “store of value”.
Mostly gold’s history and value comes from its ability to store excess production through the ages. In the past 300-400 years it has also been the reserve asset of choice for central banks the world over.
‘It could have been decided that anything else relatively rare could be used instead.’
Well, it wasn’t ‘decided’. Gold is not relatively rare, there are 170,000 tonnes above ground. Gold is a unique natural asset. It was found in its pure form, needing no smelting (handy in times when smelting didn’t exist). It doesn’t corrode, ever. It is malleable. It is shiny and pretty. All these things lead to gold being a fit for wealth storage. Nothing else exists to fit the bill.
‘Whilst I do suspect that we will see gold at $5k within a decade, I am aware that things can potentially change very quickly even if they haven’t for centuries. When the monetary system finally fails, who knows what the situation will be?’
More like $50,000 gold within 20 years. The world’s debt bubble/monetary system has combined to ascribe huge valuations to worthless debts. The re-balancing we will see over the next cycle (similar to 1965-82) will mark ALL assets at a true value, and gold will be the only asset to experience dramatic gains, as a safe haven, and as pure capital stored. All the ‘money’ and ‘investments’ will be seen for their true worth in a global depression worse than anything the planet has ever seen. Reality will return to finance. Buckle up.
It just seems logical that if gold were that perfect, the gold standard would exist somewhere. Central banks have a history of selling gold at bottoms (2000) and buying at tops (2011) and even now. Debt needs to be reduced dramatically, which I think will be through bankruptcy and default. However, gov’t debt was relatively as high as now in the early 50’s and we grew and inflated our way out of it. And gold did very little during the 50’s and even 60’s.
Gold is (sort of) perfect.
Mankind however is not, as these past c.100 years have proven.
This bubble bursting will change mankind for generations.
I am not saying you are wrong GM, I am saying that I am open to different outcomes. The world has changed more in the last 100 years than it did in the 5000 years before that, this could cause very unexpected changes and events in the future.
As I say, I hope that we move to a non-monetary system where all the different “asset classes” become irrelevant. We declare the planet’s resources as common heritage and do away with all this stupidity, including outdated concepts like countries and ownership and so on. In this way, we don’t have to spend our time working to survive or to pay off debts for those that have them.
If we stick with a debt-based monetary system for a long time, I still wouldn’t put all my eggs in the gold basket. That would be imprudent imho.
Good luck as always.
J
Evolutionary forces and finite resources guarantee the ‘star trek’ utopia’ can never happen jeger.
A shame, but we’re just animals, fighting to survive.
The Euro has hit the resistance level of the second half of February wherein it fell impulsively lower to the middle of March. If this is only a “corrective” rally then the odds are increasing that it is over and the Euro will decline to new trend lows exceeding the March lows. But, or course, today’s continued rally in the Euro, and fall in the USD, points towards a new ATH for the DOW; and, DOW futures this morning are pointing towards that too.
As I see it the “ducks are lining up in a row” (no need to panic).
Coffee is starting to look interesting?
If you are looking for lower equity levels
then we are at an interesting point around here imv.
Markets attempting to retake some gains atm,
if this is sold off again today and tomorrow
we may get some downside traction.
The reverse applies.
today’s stock market bounce seems pretty meaningless
biowrecks lower, transports barely budging, dollar lower
gold moves really meaningful, GDX breaking 2 1/2 year downtrend
leading gold stocks breaking out of 18 month bases and h&s bottoms
this is fun
On daily Candle Stick charts it is starting to look like that the Euro is making a Shooting Star top and the USD index a Hangman bottom.
In the 5 year bull mkt in the $ that started in 1980, it went from 85 to over 160. The pattern was a dramatic “parabolic” breakout that lasted several months that went from 85 to 115. It then corrected back to the 200 ma before starting another “parabolic” move up. So far the current pattern is very similar. The momentum breakout in gold in 2001 followed a similar pattern, also. We are in the 3rd month from the top also per the normal correction length. The $ 200 ma is at 91 and still moving up.
But now the ECB is printing 60 billion a month. The Pound has made it to its 200 day ma but only because of the elections. The Euro has made it to its 100 day ma and the February second half resistance area and looks to have ended its correction.
Today’s US New Claims is helping to reverse the USD as is the report that more money will flow in to the USD in the second quarter than the first quarter in order to buy US land and buildings, etc. I am expecting the USD to trade up to a new trend high which will push Gold and stocks lower this summer.
Note that with today’s new lows in the USD Index that Crude sold off which is not normal. This points towards lower Crude and Gasoline prices this summer. This will push energy stocks lower, but, put more money into consumer’s hands –worldwide. I don’t see a crash in stocks until after this Fall.
Last week Crude made a Shooting Star top on daily candle sticks and this week is making a “second chance” top while the USD makes a Hangman bottom on daily candle sticks. Crude and the Euro are topping with Shooting Stars and the USD is bottoming with a Hangman. Gold should top in a corrective rally and break lower in its next impulse wave as Crude goes lower and the USD goes higher.
If it were not for the ECB printing 60 billion a month then the Euro might have corrected up to its 200 day ma (like the Pound has recently done) which means the USD down to its 200 day ma like back in 1980. This is a major difference from 1980 to now that needs to be accounted for.
Agreed with Richard wholeheartedly. Strongly impressed with your all around game. Oil is double top and due for a correction down to $54 maybe? Gold looks top as well while the USD is bouncing.
I guess we have an answer for the SM today. An impulsive move is up, not down as I had expected. Got stopped out for a 1% loss. Not sure if I want to go long from here.
From the March lows Crude rallied in a Channel and is looking to break that Channel to the downside. If so, it tends to point towards a higher USD and lower Gold….
To get a better Elliot wave look that Crude (and Gold) may break to new trend lows as the Dollar breaks to new trend highs take a look at Heating Oil which shows a very good upward corrective Elliot A-B-C implying a new Impulse wave lower to new trend lows.
Euro rally over:
http://finance.yahoo.com/news/ecbs-draghi-says-execute-qe-151837264.html
And Ruble rally over too (USD decline over):
http://finance.yahoo.com/news/russia-said-ruble-gotten-too-145400878.html
“everybody”, everywhere is bullish on the dollar and have made their bets
“everybody” can’t be right
therefore, “everybody” is wrong
that’s just the way the market works
same thing happened last year
“everybody” was bullish on yields
“everybody” was wrong
yields dropped a lot
Despite the powerful move so far, SPX still looks troublesome. It needs to get above 2120 to convince me that it is indeed a bull move. Otherwise, it could just be a larger C wave from this week low.
Who is everybody.
Multiple people on this blog alone highlighted
the prospect of at least a temporary $ reversal.
There are a multitude of articles discussing this on
various sites.
VXX/VIN ration back to 1.27 last time this hit was May 4th w/ SPY at 212, by May 6th spy retraced to 206.79. Considering this is monthly expiration week and avg/low volume on SPY, I don’t see legs in a breakout above 212. I see a triple top with previous high at 2120.
I would say the dark pools are manipulating the 210 strike to keep all the put premium and screw the calls with a retrace. I expect the retrace not to start until late tomorrow after they have stolen the call/put premium and re-positioned for a move back to 206-204 early next week. the boogeymen may try to spike to 213ish clear out all the bears and fake out all the bulls on another fake breakout.
Considering all the slaps on the wrist with fines for spoofing gold, currencies, equities the bankers get, to consider equity manipulation as paranoia may be a bit short sided.
I don’t see the move to 2138 as ready until both bulls and bears alike have been thoroughly wip sawed.
Scott – What’s your call on SPX by close of market today?
My thinking is aligned with yours. I’m wondering if shorting SPX @ 2117 is a good idea?
Your thoughts?
Regards
Kurt
Hi Kurt, daily predictions are like the roullette table. odds heavily stacked in favor of the house. On 12/18/15 someone fat fingered (fake print) on the SPY at 212.97. follow your instincts and risk what you can lose. or play longer dated to give yourself some room for error.
Scott – Thanks. You are correct. Your prior posts seem to indicate an expected market drop and that aligns with my thinking. I shorted ES @ 2118 and will keep some powder dry if we move higher. My stops are very tight so lets see what the market does on Friday. Would not be surprised to see a retrace to 2080ish but of course there is no guarantee. I was following the Spiral updates from Peggy but the downside call was off for Thursday. Only consolation was the upside came on such low volume.
date should say 12.18.14
J Snider over at the Alhambra site has been reading the Money Market tea leaves and believes that the big players are trying to position themselves for an anticipated QE5.
If they get it we are off and running again!!
If they don’t ….hmmmm!!
My guess is that they will but not in a timeframe that they have in mind and so that may cause the drop which will then force the Feds hand. MA is right everything is interconnected. Just in perverse ways!!
Unless of course the big players have ‘extra’ info….but that’s just me and my silly conspiracy theories.
The Spiral has a larger trend, Singularity and Expansion. Singularity (contraction of the Spiral) was reached on 5/11 and Expansion is 5/25 (low to high) The smaller trend occurs as the Spiral travels through the Quadrants. The latest a high can occur is tomorrow by 12:00 est and the latest a low can occur is 5/18 by 14:00. I wait for an impulse high or low to occur (30 min. bars) during these time frames to enter/exit a trade.
Peggy, your earlier posts had suggested that there would be a significant low on May 14 and then perhaps a slightly lower low on May 15. However the opposite happened on May 14.
Is this because, like EW, there is scope for ‘interpretation’ of the Spiral? I was looking at the very recent post on the 7442 FB public page which asked whether the markets followed the Spiral or not. On that graphic it shows both the May 13 & 14 as significantly up. I don’t know whether that is what they were showing earlier or not?
I guess what I’m trying to understand is what would explain the difference in direction from your earlier post, although the time frame appeared to be accurate.
The larger trend (Singularity to Expansion – low to high) is the simplest trend to trade – 5/11 L, 5/25 H and 6/6 low. The low I am expecting is delayed to the furthest extent of the time window to where the Spiral leaves Quadrant 1 – 5/18 at 14:00 est.
Hi Peggy – like Purvez, I have a question about the directional output from the Spiral. Does it correlate with EW analysis and for the expected high into Friday, is there an upside target that the Spiral spits out?
Kurt
Thanks all, new post is out