

1. Commercial positioning in the EuroDollar is extreme, suggesting a significant reversal should be at hand:
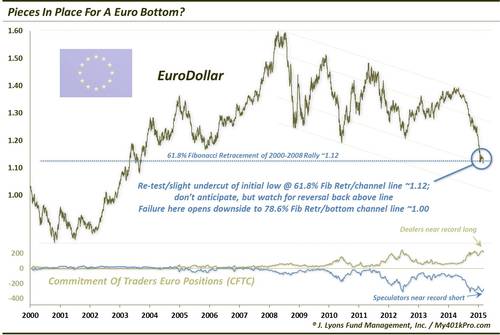 Source: Dana Lyons
2. Gold positioning is not at the same extreme. The positioning of the various groups does not reflect other significant lows yet, so perhaps a little more washout may first come to pass.
 Source: Pipsologie
3. Dow commercial positioning is extreme, echoing the 2011 peak:

Source: AThrasher
4. The smart dumb money confidence spread is also now at an extreme matching the 2011 peak:

Source: Sentimentrader
5. Note that both the above two charts show a lead time into the true market falls in 2011 of 2-7 months. Meanwhile, the divergence in ECRI leading indicators is now 8 months old, and compares with the previous lead times of 2-8 months before the true falls:

Source: ShortSideOfLong + my dotted lines
6. Sunspots have fallen away, mirroring early 2001, and removing the support to speculate:
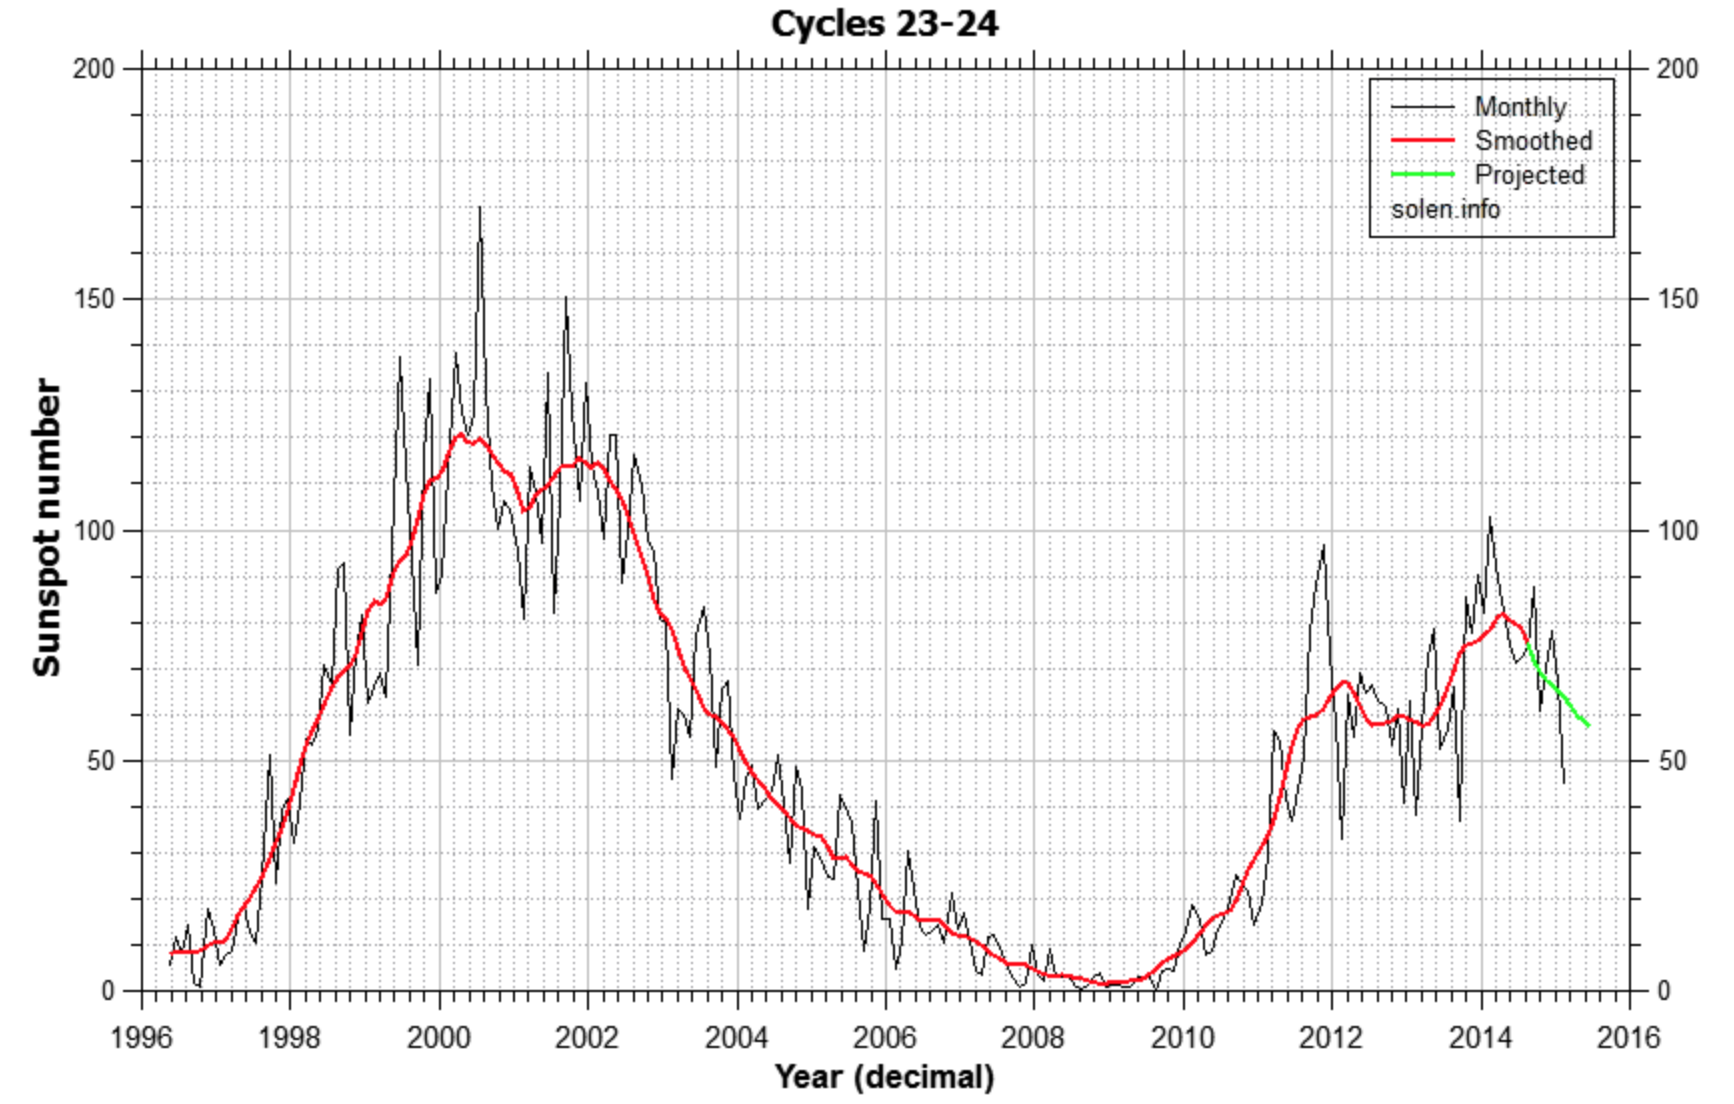
Source: Solen
7. Valuations and price accelerations in the US line up with the two biggest ever: 1929 and 2000:

Source: Nautilus Source: DShort
8. Meanwhile, earnings and economic data continue to be highly suspect, particularly in the US.

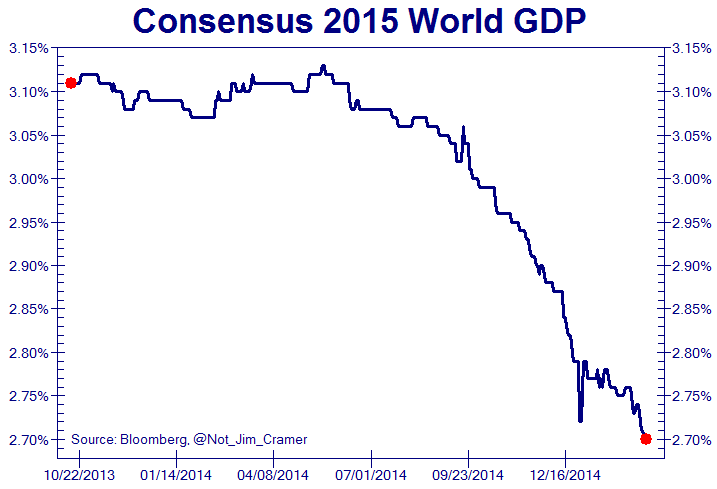 Source: Not_Jim_Cramer
Drawing together with data from other recent posts, logic and history would argue that the correction that began last week ought to have legs and that we are at the end of a 12 month topping process. Failing that, then a sideways range into mid-year before a collapse in earnest.
Leading indicators and economic data for Europe are more promising than the US, adding to the case for the Euro to reverse fortunes. The rising dollar continues to add to the deteriorating earnings picture in the US. Looking further out, the leading indicator picture for the US improves again. But recall that evidence reveals that the stock market leads the economy, not the other way round. As long as stocks hold up, the weath effect prevents major economic problems. However, we are seeing all-round fragility in the economic data, meaning sharp falls in stocks would likely to tip us both into recession and deflation. Therefore, it comes down to the stock market. Those pointing to benign recession models as supports for the stock market have it the wrong way round: when the stock market begins to fall, the recession models spurt upwards.
With a focus on the US, the scene is set for such sharp declines. Sentiment, allocations, leverage, valuations, money flows and positing are all flagging a major top. The dollar and oil have severely dented the earnings picture. Economic surprises and leading indicators have both moved sharply negative. The speculation thrust from the sun has ebbed away and Fed balance sheet expansion has drawn to an end:
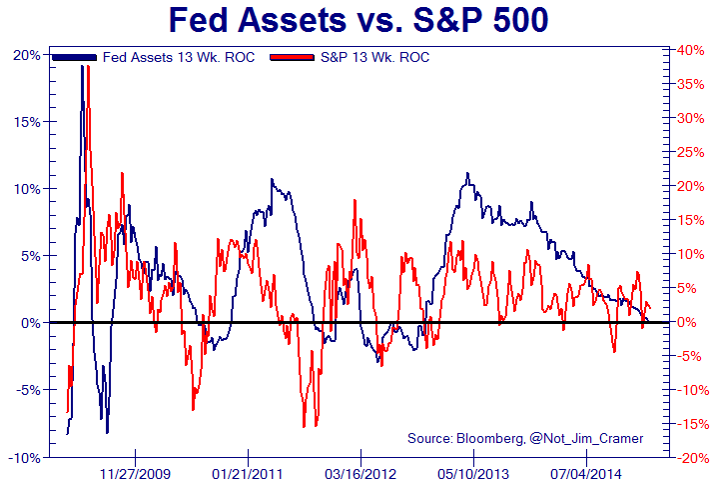
Source: Not_Jim_Cramer
Conventional analysis would argue there is nothing missing. If conventional analysis is lacking then ZIRP-enabled large player leverage could defy. But at some point, that has to reverse hard as the ponzi scheme collapses and surely now the case is comprehensive for one or more such parties, if applicable, to pull the plug in self-interest.

John,
Thanks for this analysis and I think you are right.
Nobody wants to read long posts so I’ll be brief.
February 23rd and March 26th are the lines in the sand. The 2015 high must fall within these two dates. March 26th is point of no return.
So we are in an inversion period. That’s why European markets were up last week and US markets down. This is very weird and makes forecasting difficult.
Still, my call for the Friday 6 low was correct. The natural low was Saturday, so the decline was almost into the close.
Big picture :
1) friday 13th high
2) ABC down into april 4th with :
– march 20 low
– march 27 high (pullback to end of inversion period)
– mini crash down into April 4th.
Some indices will show the high on 13, other indices a lower high. In inversion periods everything gets confused and mixed-up.
Next week will be big as markets align again. Markets can’t make big moves when out of sync. So next week is needed to prepare for some serious decline. The panic will start after the very important march 26/27 time test.
Details for next week :
Monday high of w1
Tuesday low and high
Wednesday strong turn date : w3 up
So a w2 abc down from Monday into Wednesday.
Thursday consolidating w4
Friday high.
This is a 4 week forecast; should do for now.
Cheers,
André
Seems do deep today and went below your wave 1, so with that are you sticking with Friday being a HIGH because the McClellan Oscillator is at a place -200 when bottoms are usually made. Friday being the Bradley Turndate either its going to be a LOW and we rally into the April 4 Bradley Turndate or opposite and we top out Friday or within a few days then down and much lower than I expected for March. Don’t want to see 2039 broken really or 2020 for sure.
Any changes to your forecast with today being much more of a selloff since you were anticipating what I think was a wave 2 down but exceeded the wave 1 you thought we started out the week with.
and my cycles:
~88 year cycle at top
~44 year cycle at top
~22 year cycle at top (magnetic solar cycle. Correlations in birth numbers, climate)
~11 year cycle at top (sunspot cycle. In all known sunspot cycles since 1790 DOW made some kind of major correction or bear market around solar maximum. Typical time for a top is either before or after solar maximum, and we are now in the typical interval after solar maximum for a DOW top. In weak sunspot cycles DOW typically tops in the interval after solar maximum)
~3,5 year cycle at top (also seen in global temperature, geomagnetism, earthquakes)
~13 month cycle at LOW. This cycle seems to be inverted for DOW, meaning that two cycles merge into one of double lenght. If so, this merged cycles is a top, and the next low is in 13 months (cycle seen in IMF and more)
~6 month cycle at top (a solar wind cycle. Best correlation with energy-related markets)
~4 month cycle at top (related to tidal effet from planets upon the Sun. Seen in solar flux and solar activity related)
Summing all up, this should be THE TOP (of some major kind, given the state of the longest cycles).
The short term cycles say it is right NOW.
However… could it be later? If it is later, it will be at the next ~6 month cycle top around Aug-Sept 2015. That would mean the 13 month cycle is not inverted/merged after all.
However such a Aug-Sept top would be anomaously late for the 3,5 and 11 year cycles. But maybe not impossible.
However my wavelet cycle-analysis on SPX and Norway support that the top should be right now, but a slight possibility for the other alternative.
IF this is the top, we should get confirmations from severe weakness into May-June. If we dont get that, its the Aug-Sept going on
JAn 🙂
may add that IPOs top with the 3,5 year cycle, and Alibaba probably marked the top there. Earnings top at the same cycle, and now show weakness lead by energy. That means that P/E shoots up, which it often does at market tops.
So do we have a new normal? Will QE change 200 years of historical patterns?
It is interesting to see how most of all QEs in the world were announced/began around ~6month cycle tops. Just as if they are trying to fight against the cycle lows to keep up market momentum/trend. And now we got Draghi QE right at the cycle top – will it prevent the expected “panic” into May-June?
May add that I expect weakness to persist into early October before we get some recovery into January 2016 when the decline will resume.
I would be surprised if recent US highs marked
the final bull market top.
It also remains to be confirmed if we are indeed
in a topping process, as multiple markets continue
to print new all time highs.
These can not be dismissed as anomalies imv,
they are clear ATH.
The December 2014/January 2015 top thesis
has been invalidated, it remains to be seen if
a later 2015 final bull market top goes the same way.
My own view of an end Q2/Q3 ’15 timeframe remains
my best guess of when this incredible bull market
finally rolls over.
As always price will confirm.
My research shows that topping processes very often involve marginal new highs.
John’s last few posts make it crystal clear we’re in such a process.
When it finally rolls over…who knows, but sunspots declining, I reckon significant weakness is due about now.
Thank you all Nicola ,
any thoughts on what happens to UK house prices if the stock market does fall
george, they will fall slightly. The big danger is when the c.32 year govt bond market turns down, and interest rates rise, along with inflation.
The UK housing market cannot cope with ‘normal’ rising interest rates.
Nominally prices may hold up, but in real terms, prices will probably halve over the next 10 years.
Hai John Hampson, I was the one who always saw your post from a long time, you exceptional analysis, not all analysts can perform such analysis analysis you.I am sure you will produce something big. Thanks u so much
Thanks
Hai guys,we’ve seen 2 high as I’ve mentioned before, now let’s see if the low is in the 9 or 10 and rallied into 13 high followed by a decline in the next.thanks
The weekly RSI on the dollar index is 85 and has been like that for a few weeks now, are we heading for some rapid carry trade liquidation and a flash type sell off? The last 3 highs on the S and P were also marked by bearish divergences on the vix ( no new lows there) and the summation index ( no new highs there). Some QE withdrawal is coming through i guess.
Nice post again. Incidentally, I just looked at ECRI weekly growth index. This has better correlation to SP500 and based on this index, the correction is already overdue:
http://dv-dend.blogspot.com/2015/03/correlation-between-ecri-leading-index.html
Thank for you work!
Thanks for yours
Ref Commmitments of Traders (COT). Per S. Briese author of the COT Bible, Large speculators move the mkt. It definitely isn’t just when they go to extremes. During the last 3+ year bear mkt in gold and silver, the gold bugs got very excited that large speculators were at multi year and/or record short levels. That was just before the PM’s had record drops. Oil extreme longs for large speculators was around 100,000 net longs a few years ago. But before the recent top they had gone from 100,000 to 200,000, to 300,000 to 400,000 to 500,00 before it topped. The key to that is at 500,000 the large speculators had reached their limit, turned down and such large buying had failed to keep moving the mkt up. The way Briese puts it is to sell when the last large speculator buys and buy when the last large speculator sells. Different commodities have different characteristics, and bull and bear markets are different also. He also said follow buy signals in a bull mkt and ignore sell signals. I am going to take profits in the $ soon, but it will probably be a mistake as it is a bull mkt. The last 2 bull runs in the $ lasted 4 & six years with the 3 leg going up 10 or 11 months before any correction. This one is in the 9th month, plus the degree of the 1-2, 1-2 making this a 3 of 3, looks to be of larger degree. Remember all $ denominated debt outside the US including the huge carry trade are short the $. The move in the dollar makes me think the scramble for dollars has begun which will take most other things down.
Andre, friday March 13th being a Bradley Turndate, do you think the high will be near or exceed the 2120 area? Appreciate your work very much. Thanks
Donald190,
As I said, in inversion periods it’s hard to tell. I think 2115 is an important level. And the trend in Us markets seems down. The only thing to support the up move next week is that Europe is still in an uptrend. So I would expect a lower high. But my work is concentrated on timing and direction; not price levels.
Cheers, and thanks
Andre’, could you define what an inversion period (IP) is and what is the data upon which the inversion period is calculated?
Are tide levels correlated with the IP in a direct way? Apogee or perigee factor involved. For example, last Thursday was apogee and now we are in IP.
I know gravity levels are involved and seems moon (distance, declination, and position) would effect those levels.
$SPXA200R. We have lower highs since July 2014. This is indicative of the quality and condition of the bullish waves.
I would like to think that smart money must be seeing the same and say…………
An inversion period is when the market shows different counteracting forces. Some indices will follow one, and other indices the other. I see a lot of analysts expecting a down market next week. Usually they are right, but they don’t realize we are in this inversion period. Now normal forecasts become inverted. Next week will be up.
Most of the time we are without inversions. and that’s so confusing. Cause now your indicators work great. And then suddenly they are wrong; not in timing but in direction.
I use both tidal information and a theoretical gravity calculation. My gravity indicator gave a growing force – markets down – which was to be expected heading into the full moon. But my tidal indicator gave reduced gravity – markets up. I can’t explain how this can be, but I see it. Us market chose the gravity calculation and European markets the tidal calculation. Knowing we are in this period is more important than being able to explain it.
Inversions exist on many levels; both long term and short term. Tuesday I have an inversion that lives one day and gives the high and low on Tuesday. It is too weak to change the trend.
My inversion period calculation is proprietary. And is it a combination of lunar and astrological conditions.
Hope this helps.
Thanks for explaining the principle of inversion as it is an important part of your work. That makes it easier to understand your weekly reports.
Thanks, Andre’.
I always look out for the free samples of Bob Hoye’s newsletter at Biwii:
http://biiwii.com/wordpress/2015/03/06/pivotal-events-42/
Seems he sees the rebound in markets as long in the tooth, with a Dow Theory non-confirmation from the Transports. Also sees the dollar as ripe for a decline.
He continues to accumulate gold miners on weakness (which we had in spades last week, so I’m buying some more tomorrow).
Goldseek.com has excellent Bob Hoye interviews every month or so. He is the most insightful commentator that I have found on youtube.
goldseekradio is the youtube channel where bob hoye is featured.
Thanks, I’ll look out for those.
GM, it may be correct, however it’s only confirmed
following the event not before.
The DAX, even allowing for the Euro is not a nominal
new high, it’s a clear new high.
Multiple market commentators made exceptionally
strong cases for a 2014 final bull market top,
that did not happen.
There is no certainty in precise market timing,
probabilities yes.
GM
I am buying some too tomorrow for my longer term investments fwiw.
J
With the USD this strong, and miners still being in a downtrend , is it really a good idea to be buying now?
Lunar Chord Next 5 Trading Days:
M Really really negative (apogee shadow, falling tides, recent prices)
T Really negative (apogee shadow, falling tides, price?)
W Negative (apogee shadow lifts, falling tides)
T Negative (falling tides)
F Flip positive at end of trade day(tides begin rising Saturday)
Summary: Entered 200% short position on last Friday. Looking for continued weakness Monday will remove leverage on short to remain 100% short. Tides falling until Friday and given recent strength hoping for pullback until then. Will remove short and move to cash if price reverses. Following week can be really positive: option expiration, new moon, rising tides, perigee. Potential for a huge up move starting next Friday lasting 5 trading days.
So pretty much the opposite of Andre’s forecast?
He may be correct as I got stopped out of half my position this a.m..
Apogee shadow refers to history of large downward price moves to coincide with days following apogee.
If there is an almost perfect order in the universe, than I would like to see a high/top around March 15-17, eventually stretched to March 19. That would allign a lot of cycles.
That would also put my call for an April high on ice, but makes fully sense from an harmonic standpoint when you take into account that during a far far away timeframe, around November 20, 2016 many cycles have an appointment. Which by the way won’t have any impact in november, but earlier, in october, as usual.
Backed up by some utterly simple math:
October 10, 2002-October 11, 2007= 1827 CD.
Down 592 CD to March 6, 2009.
March 6, 2009- March 17, 2015= 2202 CD.
2202 : 1827= 1,2052 x 512= 617.
March 17, 2015 + 617 CD= November 23, 2016.
So its not impossible that one of these days this bull has it’s last gasp, although I would be very dissapointed.
“2202 : 1827= 1,2052 x 512= 617”
Peter, I do not quite follow where you are getting the 512 number from or why you use it and also where or why you use 1.2052 to multiply it. Or was it a typo from the earlier 592 CD? Thanks.
Birinyi, et al: http://www.bloomberg.com/news/articles/2015-03-09/birinyi-says-six-year-bull-run-won-t-end-until-skeptics-muzzled
Since 2005:
1) $SPY lost more than 1%
2) Current month is March
25/25 times $SPY closed at higher than the current close at some point of time in the next five trading days .. with an average gain of 1.98 % at the 1st positive close.
Before OPEX, SPX should retest last highs…
Peter, if your call is for an April ’15 final bull
market top, and that occurs instead in the
second half of march, that would still be
incredibly accurate.
A high about NOW?
2003 low + 6 years = 2009 low + 6 years = HIGH now
March 2000 high plus 7 years 7 months = 2007 High + 7 years 7 months = May 2015 high (a retest ?)
Also Milton Berg was on Bloomberg today and he is advising a top about now.
he mentioned the Low Low High but also the CPI adjusted Dow resistance trendline going back to 1900 has been hit 5 times in the past and each decline was 20-86% drop. eg. 1906,1929,2000 etc.
This is the 6th time.
I’m thinking down to early April then back up for a restest.
A 38.2% retracement from 2120 gives 1565 the 2007 top.
KF, thanks for posting Milton Berg interview.
Taking the current level of the Dow at face value, and then adjusting previous prices for a realistic rate of inflation, shows that Dow will have to reach 22000 to make a marginal new high above its “real” 2000 value: http://home.earthlink.net/~intelligentbear/com-dj-infl.htm
Something that strikes me about this chart is that if the Dow reaches 20000 within the next year, then goes on significantly above 30000 within a year after that, then declines towards 5500 in the longer term – then anyone looking at the chart in the future will see nothing remotely out of the ordinary.
It all depends on that silent killer – inflation.
Good news for the bears. The stock market went down on ostensibly good news: ie strong job creation. It could be like the opposite of 2009 as the market climbed a wall of bad news.
IMO. The market went down because it ran out of fresh buyers.
The trick is to identify the point of equilibrium by use of high probability tools. Cover the short and go long.
Good luck.
Kent….haven’t you heard? Good News is BAD NEWS because in our current state of mentally aberrated FED they do ‘bad things’ once things improve, like raise interest rates.
That then annoys the likes of GS and Citi and JP Morgan who throw their collective dummies out.
Nice stuff. There is a Puetz crash window that begins 3/27 and runs through 4/7. Selling typically begins just before the window and continues at least 4 weeks after the window. Here’s a chart I shared with my subscribers over the weekend that shows a peak sine wave cycle top, my wave count top of primary wave [3] and the Puetz crash windows. https://alphahorn.files.wordpress.com/2015/02/cycle-with-peutz-count3.png
Thanks Alphahorn
For those who aren’t familiar with Puetz crash windows, he studied the 8 largest crashes in market history and found they all occurred during a window in which a solar eclipse (March 20th full eclipse coming) is followed by the next full moon (within 6 weeks) being a lunar eclipse (April 4th).
Added to my short position at 11:50AM, speculating that this weak bounce will likely fail.
Newt good call, although I suspect that this is wave ‘a’ of an upward bounce and so we’ll see a ‘b’ down which should stay above yesterday’s low and then another even stronger bounce for ‘c’. That would match with a count I’m following and of course Andre’s for the 13th.
BTW Newt, did you get to speak to Princess Margaret at the lunch or better still shake her hand?
She has always been my favourite Royal, not just because she was a ‘stunner’ but because she was a ‘rebel’.
All the rest you can keep!!
No. Just shoke hands. I was 1 of 30 lucky boy scouts selected to meet with her. She gave a very brief speech.
She had very special quality indeed.
This utube video shows her trip/arrival.
Newt was this in Hong Kong? Certainly the only bloke that I know with a feathered hat like that was the Gov’nor of HK.
So are you now in the US or still in HK?
Aaah BOAC!! that brings back memories. You won’t believe this but when I came over to the UK from Karachi I was on a Pan Am flight. Remember ‘THAT’ airline anyone?
I guess I’m showing my age here. Lol.
I think we’re doing this all wrong….
What we need to do, is:
1) Print Bonds, with a negative interest rate….
2) Find suckers…..errrr, ~investors~….to buy said bonds….
3) Collect Principal of bond sale…
4) Sit back and let the…..investors….pay YOU interest….
5) Pay back Principal as due…
6) Repeat, until rich…
I’m going to own the world, bit-chezzzz!
MWA-hahahahaha… 🙂
Barry, you are a GENIUS or what!?! Make that a VARIABLE negative interest rate that way you can get them with higher figures and if they default then you don’t have to pay the Principle.
Can I be one of your Dealers in this bond? Please…..pleeeease Pretty Please?
Valley, you laid out quite a detailed and good plan of action for how you were going to trade this week. Somewhere towards the end you said that you would go to cash if the price didn’t confirm (or something along those lines). Do you have a ‘level’ in mind for ‘non-confirmation’ of price? Of course given Friday’s sell off we were expecting ‘some’ sort of a bounce but I’m just wondering when you say….this has gone beyond what you were expecting?
I use a simple candlestick technique to determine when to go long or short based upon the lunar seasonal cycle. I was expecting a deep discount today and was wrong. My back testing of the system I use has not infrequent 1% losses, but it’s value is that some months the gains are many times that, mostly from avoiding large drawdowns that often correspond to high to low tide cycles. Will make a note that you were right last Friday. Maybe I will stop trading cycles and just invest according to your recommendations.
Valley the beauty of your system is that it provides you with odds in your favour. Like all systems it will have failures but provided you control your trades the odds remain stacked in your favour. That’s the best thing a system can provide.
I really enjoy reading yours, Andre’s and others thoughts based on tides and gravity etc.
It’s very exciting when both you and Andre are projecting the same path and particularly so if my own wave counts also fall in line.
Please don’t stop trading your system as mine is far more hit and miss than yours.
Given the divergence in opinion between yourself and Andre I was wondering whether you had a ‘level’ in mind at which you would ‘stop’ out.
You could use the high price of high tide day at stop for short trades and low price of low tide day for stop on long trades.
Friday looking like another one day wonder atm,
gold giving up much of it’s early gains.
Burnell, looking good for your call currently.
Phil, you’re developing a track record IMO, so I do hope your comments don’t reflect your trading?
Excellent day. We should be back to all time highs in no time. With the ECB injecting 60B euros per month, it should have a big impact on the markets. Nice to see gold stocks dow sharply. In this environment, with central banks injecting so much money in the markets, gold is really the last thing to own.
Allan over to you. I’ve had my fill of Mr Nicolas.
Nothing is more powerful than an idea who’s time has come. Maybe Nicolas is correct and central bank money creation will forever alter the historical price earning metrics going forward. With negative real interest rates could it be that equities with meager dividends are the only game in town?
Hi Valley ! Yes, you raise an excellent point. This is exactly what I think. If central banks keep rates at 0% or even negative, you will be willing to pay more for your JNJ, KO, GE, PEP etc… Add to this, the fact that Central Banks are buying equities directly, and that companies are able to borrow at 0% and then repurchase their own stocks, and you have the perfect recipe for a tremendous bull market, with no end in sight.
Steve T,
Sorry about the confusion. A typo, indeed.
I shouldn’t post in the middle of the night, I shouldn’t do math either when a pillow under my head is much needed.
October 11, 2007 – March 6, 2009= 512 CD.
And 512 x 1.2052 = 617.
And 617 CD from March 2015, for instance counted from March 15 = November 21, 2016. The end date doesn’t matter, the time frame november 2016 matters.
To answer your second question.
The usual & common harmonics (the ones I use at least) don’t apply to all circumstances.
Harmonics are tools, just like when you compare former bull runs and bears to get a sense of where you are in the cycle or measure moves along the slope of a pattern and the avarage distance moved.
It makes obvious more sense when I say on March 12, 2015 we will be 2200 weeks from the top January 1973, the start of a cruel bear market. Add to this 2200 CD’s from March 6/9 2009 = March 15/18, 2015.
So I’m prepared to accept this might end or stall the bull run from 2009. Should the S&P 500 get a boost, it could trade around 2200 in the near future. Should this time-ratio be exeeded by 22, 44, 66 or 220, 440 CD’s and so on, perhaps an opportinity to short when other signals confirm.
Not so obvious is what I did this time: to take the former bull run (October 2002 – October 2007) and the bull run until now (March 2009 – March 2015). In a weird way it makes sense, October-October/March-March. So when I did the math as I described, I was surprised to notice that when I used the outcome 1.2052 as a ratio to muliplay the last bear of 512 CD’s and projected the outcome into the future, it was November 2016. That made a lot of sense to me because of other cyles. Should this not have been the case, I would have put it aside immediately. But since this is a precarious time, I am not dismissing it fully.
I agree, this is a hard to defend rational, but no less rational than over the next years counting 1000 days forward since the DAX broke the 10.000 level to spot a CIT, or using a ratio from the first impulse move (from a bottom to a first, clear high, this time using price-price) to get time & price expansions into the future. And they too do work. Therefore: call it a hunch, no more or less.
I’m interested in Nicolas’ comment on the following:
The “low interest rates environment” are the words that can be found in every mouth during this cycle. The argument appears so obvious that everybody embraces the idea that the influence of central banks on the bond market also impacts the equity market through the discount factor mechanism. If profits of Belgacom remain flat for the next 20 years, paying the stock 20x current earnings roughly implies the recovery of its investment in 20 years. This is a long period of time, but the 20-year government bond yield of Belgium is close to 1%, thus implying a 100 year time horizon needed to recover its investment. 20 years vs. 100 years would represent the “equity risk premium”.
We fully disagree with this rationale, because it implies a “by default” investment. The pricing of equities is not driven by the pricing of bonds. Their underlying drivers are too different to think there are spill-over effects that inflate “naturally” equities. The Japanese experience has been crystal clear on this subject: long term bond yields have oscillated between 1% and 2% between 1998 and 2008, and despite this low remuneration of the bond asset class, the performance of the Nikkei was null during this period of time.
Nicolas is a troll. In fact, I suspect he is an alias……..imho.
🙂
J
Ah, give him a chance 🙂
Jegersmart, why is that I get the impression you don’t like trolls?
And to Nicolas I would say: read carefully what André, JanBenestad and Sandiawan Lie wrote. Even a sincere trol doesn’t deserve to lose money in the next panic and we are getting close. It’s no accident the CB’s are flooding the markets with money right now when the cycles turn down and a panic is around the corner, be it march (likely) or april. You should buy bottoms, not highs.
peter, there’s a global dollar shortage, liquidity in ALL markets is wafer-thin, central banks are not buying equities (except a tiny amount in Japan).
Don’t buy the ‘CB flood of money narrative’, they are literally irrelevant to what will happen in markets, mother nature will sort it all out.
But good of you to look out for Nicolas I must say.
Some very different views on how this week
may pan out.
Gold sliding away again, the move from the
November low looks like a bear market rally
that has suckered people in.
Phil, gold has been in a renewed bull market for the past 8 months.
Just depends what you price it in.
You look only at the dollar price.
I look at the price in real things (versus other commodities).
It’s the difference between successful investing and following the herd.
Gold and the miners are going to fly over the next 2 years. Buy now, hold tight, simple.
Peter, I wish I had your apparent certainty on market direction.
Nicolas, how much debt can companies continue to pile on given declining earnings?
I don’t care whether interest rates are zero or negative the end game has to come.
The USD is going to destroy US earnings and blow the US trade deficit out of the water
Corporate America is on a debt binge that is beyond comprehension and if ANYBODY thinks that Fed can raise rates they are dilusional.
Well done Central Bankers you have created a Frankenstein market stock and debt market that will eventually destroy the global economy and take over a decade to restore.
Allan, you’re such an optimist, it will never be restored to these levels, we’ve got c.$50 trillion of debt to vanish, never to return.
New world lies ahead, it looks nasty for the rest of my days, which I hope will be 40 years more.
I now think we see the DOW at some point losing over 90% of its value and trading at sub 1k.
SP500 and the 2065 level – till death do us part. Its the end of the road for SP500: 666-996-1201-1366-1531-1736-2065. The next three weeks should decide whether it turns back, or forges ahead along a new road.
At the end of March, the ISN will either have broken down similar to September 1929 or staged a revival. Its also a major Fibonacci timeline for gold, and the start of new SP500 bullishness according to my lunar timing.
Looking further out, a reliable solar magnetic cycle by Vukcevic (which I used three years ago to estimate high sunspot activity into 2015) is indicating that the sun is fast approaching its next minimum, before the SC24 maximum has even played out. That would mean low level, but continual sunspots right through to at least the late 2020s. If that’s not to happen, something will have to come along to upset his cycle. http://www.vukcevic.talktalk.net/PF.gif
The self-professed “blue-riband” experts used to laugh at these planetary-induced solar activity cycles – that was until the sun proved these cycles to be correct, and the experts’ timing to be wrong.
Mark, you state lunar bullishness at the end of March, are you familiar with Puetz’s crash windows? See my chart above where I note the windows since 2007. I see late March, early April as extreme bearishness with the first Puetz window since 2011. I’m looking for the top of primary wave [3] ti coincide with the timing of this window just as the 300 point decline in primary wave [2] corresponded with the 2011 window.
Do lunar eclipses factor into your lunar trading?
I’m broadly familiar with Puetz’s crash windows alphahorn, but not with the specific details of the timing. Your chart is very compelling, and definately ought to be considered by anyone trading stocks. And with those red and green cycles coming into extreme opposition during this summer – would you say that implies a period of high volatility?
The lunar bullishness I mentioned is the result of interaction between a short term and a medium term cycle (the basis of which is the difference between a lunar and a solar year). If that is to invert into stocks bearishness during April, then I’ll take that as proof that we’ve entered a period of really serious, fundamental change.
I do factor in eclipses, but I don’t look for turning points at their exact dates – I do believe that next to the solar cycle, then the degree to which the moon interferes with solar energy is the next most important natural influence on us. And now, especially during the tetrad, that modulation of solar energy by the moon is maximised.
If my count is correct i’m looking for a fourth wave triangle. The first leg, the (A) wave would be the deepest retracement, then it would chop forward for months tracing out the B, C, D, and E legs
It should be noted that you have only included a few of them on the chart. Indded a Puetz window has just closed. It should be noted that the current decline started in the window so it could morph into something more serious.
March 20 is the first solar eclipse of the year we havent had a cycle this year
You did say it first, and I admit I doubted you too, but I stand corrected that the solar max is closer to 2015 than 2012.
I see the same thing — 9/1929 was a ISN drop of about 65% from the peak, similar to 3/2015 MTD. Can we agree that just from the solar, an ISN drop would imply a 3/2015 peak instead of 9/2015?
I am confused about the lunar timing though. It seems to me that the lunar effects are second and third orders. In the major and minor standstills, we are talking about the wobble of the highest point, but the average over the year is roughly the same. (i.e. we are measuring the change of a change.) And in the mid-point between minor and major, we are measuring the third order, where the change of change of change is the fastest. My conclusion is that the lunar effect can provide a strong catalyst or boost, but should not have a general direction.
Yes, we can agree that an ISN drop for March 2015 would imply a corresponding speculation peak (putting us at the equivalent of September 1929). But there are still nearly three weeks until the end of March; and February’s 45 is not low enough to drop out of the plateau. With the running average for March so far at 29, that’s why the next three weeks are critical. In my opinion, and taking into account some detailed work done by Jigs, a March figure between 30 and 40 would be indecisive (and therefore likely to cause increased volatility).
I would agree too that lunar effects are secondary to solar. But if you are measuring lunar declination extremes (ie. at the standstills), then why would you want to average them out? If you checked the tyre pressures on your car, for example, and found one of them to be very low, would you average out the four of them – when its the extreme you are measuring for?
For the full/new moon effect, I can draw a link to science — evolution has kept us awake in full moons to protect against predators. Mental stress affects risk premium. Okay.
I admit I don’t know why the standstill should have any affect on humans. Therefore, everything I say is just my layman view.
I read that it might affect the solar wind etc, but in that case, I would say to measure the sun impact on earth directly, and we can with instruments. Therefore, it is secondary anyway. My hypothesis is that is has to do with the evolutionary stress of seeing a full moon instead.
If humans see the moon rise really high one month, and really low another month, could this be a modulation of the full/new moon effect? In a major standstill, if it rises really high, there is more stress, and it rises low, there is less stress. In my layman explanation, the average stress is about the same, but the fluctuation in the stress is different. Therefore, second order. (In your tire example, it is like saying my tire pressure is lower in the winter and higher in the summer, if I am in NY. Or If I am in FL, it is medium throughout the year.)
Or to put in another perspective, a layperson looking at the moon this month wouldn’t really feel if it is a major or minor standstill. He has to observe the moon for the entire year and feel the fluctuation. Since he has to take the difference in position over time, it is a second order difference.
Anyway sorry for the rant. It was just my thoughts after looking at the Gann table. Sometimes, the date is a little late — 1930 vs 1929 for example, and sometimes a little early 1967 vs 1969 for example. This lead to my thoughts that the signal is a good one to indicate a final ramp up, or a crash. I equate the moon to female, and they tend to be fickle and change their minds often.
http://time-price-research-astrofin.blogspot.com/2012/03/wd-ganns-financial-time-table-extended.html
John – its definately true that a layperson (or a scientist for that matter) could not tell if there’s a standstill just by looking up at the moon. It would take 18.6 years of observation just to witness a single declination cycle. Ancient people spent many generations dragging huge stones accross the countryside to try to measure the cycle. They would not have done that if the only important thing to them was full moon V new moon.
Gann’s declination timing often appears to be out by a year or two because the “stand” “still” lasts for two or three years (depending on how astute the observer is). If you threw a ball up in the air, and it took 18.6 years to fall back again, then it would seem to hang in the air at its highest point for a couple of years.
The answer to that riddle would not be in market prices, because a year around a bubble peak will often see a big rise and a big fall. If the declination window is also 1-2 years, we do not have even statistical power to decide between the two hypothesis — the moon causes crashes vs the moon causes up and down volatility.
Moon rules short term movements in stock market, like a woman controls day to day household decisions. Sun rules long term movements, like a man controls the macro items like where the family should move to for employment.
I am on the same page…couldn’t find the right way to say it without sounding sexist.
Obviously, women have menstrual cycles and are aware of each month, while men on a farm have to be aware of the yearly seasons…
Anyone seen any of Draghi’s 60Bn? It aint showing up in Euroland or in US.
I wonder if he really ‘really’ meant it.
I almost feel as though I could have written the article below because for over two years I have been saying that stock/capital markets are broken.
Central Bankers have distorted and destroyed all sense of normal price mechanism and risk quantifying and I have stated repeatedly that the day is fast approaching when longs will have NOBODY to sell to.
Take heed Nicolas because your flippant, cavalier attitude may be your downfall.
“People can issue more shares, there’s always new stock if you want to buy it. But if instead you want to sell stock, you need a bid — and this is something people often forget: sometimes there are no bids. And where there are no bids, you can’t sell. The first bid you might see may be down 20, 30, 40%. Guess what? The robots may well start hitting those; so you’re going to see incredible dislocations in markets once the wind changes direction and markets head the other way”
http://www.peakprosperity.com/podcast/91959/grant-williams-why-smart-money-so-nervous-now?utm_campaign=weekly_newsletter_169&utm_source=newsletter_2015-03-06&utm_medium=email_newsletter&utm_content=node_title_91959
if you haven’t read alphahorn’s post above or gone to the link
i would urge you to do so now
very compelling
I remind you again, today is 3/10, as I have said .we are looking for 10 low and rally into 13 high, followed by a decrease into 27 low, I’ll go back updates after we see all these.Gbu All.
Correction:I remind you again, today is 3/10, as I have said .we are looking for 10 low and rally into 13 high, followed by a decrease into 27/30 low, I’ll go back updates after we see all these.Gbu All
Phil, I am never certain about the market direction.
But I know the times in general when to be on guard. One of the better known tools, so many times described on this blog, the last time on this page by Alphahorn, is a Puetz-crash window.
This year I may have misjudged the timing, again I may add. I did mention that the impact of the negative cycles could be shifted until the solar-eclipse was behind us and that April is more significant than March. I hope my timing is right, but should March coincidence with the panic I am anticipating, so be it.
Do yourself a favour, read about it, examine charts and you can avoid what should be a typical Nicolas drawdown.
Not all panics come out of the blue, but most of the times it is hard to pinpoint the exact date of the start. I tried for years and still working on it: in other words I am still unable to do it with confidence.
I asked my ten year old student what was the simplest easy to understand
setup I had shown him… he said ”the traders dream”
The traders dream is simply a .618 retrace to the bands with divergence on an indicator…. 80% of the time it will take out the low as marked
I n the case of this setup a test and retest trade was triggered based on medianlines with the middle line the minimum target
note too … the vix traders had setup the traders dream simultaneously
with the indexes
http://stockcharts.com/h-sc/ui?s=DIA&p=5&yr=0&mn=0&dy=8&id=p83886993542&a=326440397&r=1425993546814&cmd=print
Note
the traders dream and the lightning trade(shown here 3 times)
are the only two trade setups i use that do not require a medianline element.
Confirmation is nice but it is not needed.
They are both continuation trades of the previous move
In this case to the downside….
I mispoke. the abcd382/447 which i have shown here multiple times
does not require a line
Excellent, slater9. A ten year old student I can compete with. 11 year old, not so much.
Just kidding – thanks for offering this up.
EOD yesterday, $NYHLR came in at 0.6526. $NYLOW has been rising everyday.
Mrs. Market is indeed in the mood to spank the unsuspected longs.
Just to feed the market justice fancies. A secular bull market can not happen until inflation returns. A reversion to the mean, say the SPX P/S, would mean a 24% correction.
For those considering the bigger picture, this link will be of interest.
Click to access Op-ED_FinanzundWirtschaft_270115.pdf
William White is a very smart guy, predicted the troubles ahead of 2007.
When he talks about the system needing ‘an anchor’, what could he mean?
Something that sits still and judges the currencies of the world, and is used to settle imbalances? Gosh, what could that be?
I own the book referenced here:
http://marketupdate.nl/en/dr-zijlstras-final-settlement-gold-as-the-monetary-cosmos-sun/
The BIS are moving the world back towards settlement and stability, but some tricky hurdles to overcome first!
Alphahorn. Nice chart of Puetz crash window. I saw that the infamous 2008 had two crash windows. I believe this year does also. What are the exact parameters of the window?
Steve Puetz studied solar eclipses and lunar eclipses and the market psychology of investors when these events occur in a certain pattern, solar then lunar, and within a given time period six weeks. According to Puetz the eclipse “crash window” is supposed to be from 6 days before to 3 days after a full moon eclipse that occurs within six weeks of a solar eclipse:
“Puetz attempted to discover if eclipses and market crashes were somehow connected. He emphasized that he is not contending that full moons close to solar eclipses cause market crashes. But he does conclude that a full moon in general and a lunar (eclipse) full moon close to solar eclipses, in particular, seem to be the triggering device that allows for the rapid transformation of investor psychology from manic greed to paranoia. He asks what the odds are that eight of the greatest market crashes in history would accidentally fall within a time period of six days before to three days after a full moon that occurred within six weeks of a solar eclipse? His answer is that for all eight crashes to accidentally fall within the required intervals would be .23 raised to the eighth power less than one chance in 127,000.” (An important note here, not all Puetz Crash Windows lead to market sell offs or crashes, but none of the 8 largest crashes in history has occurred outside of a crash window).
“. . .Puetz) used eight previous crashes in various markets from the Holland Tulip Mania in 1637 through the Tokyo crash in 1990. He noted that market crashes tend to be lumped near the full moons that are also lunar eclipses. In fact, he states, the greatest number of crashes start after the first full moon after a solar eclipse when that full moon is also a lunar eclipse . . Once the panic starts, Puetz notes, it generally lasts from two to four weeks. The tendency has been for the markets to peak a few days ahead of the full moon, move flat to slightly lower –waiting for the full moon to pass. Then on the day of the full moon or slightly after, the brunt of the crash hits the marketplace.”
Step 1 for the Puetz crash window is a Solar Eclipse – the next Solar Eclipse is a TOTAL eclipse and it occurs on March 20th.
Step 2 requires the first full moon following the March 20th eclipse to be a lunar eclipse and to occur within 6 weeks of March 20th. The first full moon after the March 20th eclipse is April 4th (roughly 2 weeks later). And guess what? It’s a TOTAL lunar eclipse.
Step 3 the sell off begins between 6 days before (March 29th a Sunday, so perhaps toward the close on Friday the 27th for the early birds) to 3 days after April 7th. The blue area states that the tendency is for the market to peak a few days before the full moon, interestingly that day will be April Fools Day.
Puetz Crash Windows don’t occur every year (there were none in 2013 or 2014). The most prolific period in recent history was during the 2008 to early 2009 time period, which coincided with SC2. There were in fact 3 Puetz Crash Windows during SC2. One window occurred during Cycle Wave A and 2 Puetz Crash Windows occurred during the massive crash of Cycle wave C. Then after Super Cycle Wave 2 bottomed in March 2009 as Primary Wave [1] topped in mid 2011. Primary Wave [2]’s roughly 300 point sell off coincided with a Puetz Crash Window. We haven’t had another window since then. The next crash window is slated for late March/early April. When you layer the Puetz Crash Windows with the Wave Count and the Cycles, now you have a very interesting chart. Is Primary Wave [3] finally close to topping? I think so, time will tell.
Thanks.
Hi Allan and all ! IBB is barely down, so I’m not worried about this small correction. Yes, I think that the FED will make sure that companies can continue to load up on debt at 0% and use the money to buy back their stock. And if we run into trouble someday then the FED will buy stocks directly.
Allan, do you really think the FED would let the market go down 90% ? This is impossible, even down 10% would be tough.
Not this time, but next time (c.2022?) Nicolas will be proven correct in this prediction. Dollar profits will be significant nominally at that point, but in real terms, the gains will not hold one’s purchasing power.
GM yes I think you are right about the 2022 scenario. Hope Nicoloas is still with us through the ensuing mess.
Reality check. Wall Street history says the “Nicolas” alike, will always have the last laugh if they live long enough. Why? …because it is the game…..Mrs. Market’s mission is to goose market for the long haul, unless this time is different.
Sir David Trench was the Governor in the utube video wearing the fancy hat. A big and tall man who carried a cane that can unfold into a tiny resting stool. very cool!
Newt, yes the market is always going ‘up’ in the long run and I very much DO HOPE that our friend Nicolas is there through the ensuing mess. He seems a clever enough person to navigate the treacherous waters ahead.
Newt, your reality check based on history only covers recent (last 70 years) bubble history. This bubble will burst, the dollar will crash, stocks will lose in real terms.
Stocks a better bet than cash/deposits of course in a currency crisis, but will still lose buying power.
Seems like short positions should be safe til the 125 dma at least.
Will send in my Calvary short if and when the longs test and fail the 50 day SMA or if they fall apart completely.
A glorious day indeed if you are on the right side.
Watch the bottom. Mrs. Market will kill the shorts in the next round. Lol.
Newt, do you have a ‘figure’ on ‘fall apart completely’, please?
a beautiful day 👉
Newt, if it’s a buy and hold approach with dividend reinvestment
in a low cost index fund, then that’s a very reasonable approach –
provided you run no margined positions.
Most investors doing this will drip feed money in over the cycle.
Phil even a buy and hold approach depends on timing. You just have to ask some of the folks who retired during 2008/9. Their pension fund annuities were decimated!! Largely because the Pension funds INSISTED that they convert to annuities rather than wait for a re-bound.
The finance industry has an entirely separate place in ‘HELL’ set aside for them.
….IF ONLY I COULD CONVINCE MYSELF OF IT’S EXISTENCE.
I’m not crazy wild about an add here, but my trading system rules say to add another 50% short here (any time by COB, actually)…
It came “off” the Sell signal reading yesterday (that’s a FAR cry from a Buy signal however), but it just went back into “Sell” territory today, which means add to positions…
So, for tracking purposes, my system is 50% short from 2101 SPX, and another 50% short at today’s close…
GL…
Yes, always nice to take some points on the short side. Will not add for now.
GL
J
Just taken a long at 17755 on the DJIA. Stop at 17725 (a bit far for my liking) and targeting 17900. Let’s hope the gods smile on my position.
purez…NYSE advance issues=853; decline issues=2,195. Shorts are in firm control.
SPX Commodity Channel Index (CCI) 272…..this is my “sure win” setting flashes a sell signal today.
$NYLOW increases to 136 indicative of… intensifying selling pressure. The odd is against any long positions.
I hear ya Newt. I’ve got a very tight leash on it as I’ve said. My main reason for doing it is that everything has gone too low too soon.
I’m expecting further downside but hoping for a pop higher first. Remember I’m a micro counts guy.
Aah well that down draft took care of the ‘stop’. Now I’ll wait for the next count. I intend to make upwards of 150 points here but I may need to give away another 20 or so.
Market correction ending eventually when price continues to drop while the internals improves. Over a period of time, internal improvement reaches a critical mass and Bang! Shorts get killed.
We are (the internals) still in the deterioration phase. Price very likely to go lower. .
Shorts hold your short. Lol.
A (first) close below SPX 2,060 (the lower BB) very likely cause the correction to deepen. You can back test.
IBB is up now ! The market should follow soon.
The tentative mid-March correction as anticipated before March arrived called for a probable 100 point drop in SPX or -5% from its top. I changed my analysis at last moment expecting one final rally to retest the 52-week high before the bigger drop, but that does not appear to be the case due to the amount of last Friday and today’s daily drops.
It appears it is following a very similar scenario of what occurred during the last Uranus/Pluto waxing square on Dec 15, 2014. That is a top occurs about two weeks prior to that date (i.e. Nov 28, 2014) and declines leading into that date sharply from Dec 5 in a sharp declining wedge formation.
This time the Uranus/Pluto waxing square occurs Mar 16, 2015 and the top can be debated to either be Feb 25 or Mar 2, 2015, with the sharp wedge occurring from Mar 2. The anticipated low is supposed to be in the 2020-2030 in mid-March.
And the key again is to not get too bearish and go all-in long at that point because markets will reach new all-time highs again … at least in theory.
i wonder if it will work again
that marked the top in IBB last thursday at 10am
Don’t even think the word “capitulation”. We are far from it.
%NYUPV. Up volume collapsed.
That should be $NYUPV.
Learn to read the market internals and you will never be hungry again.
I suppose if you are margined long then this may
be a scary drop, however these are tiny declines at
this point, approx 3% from recent all time highs.
I thought 3/4% off before a move to new higher highs.
If we correct more than 5-6% then we may be looking
at something more significant, too early to
make that assumption IMV.
Ok here’s another go!! A long at 17718 with a stop at 17700. Target moved higher to 18060ish. Lol this game is hard work.
OK I know when I’m beaten. 3 Strikes and I’m out. No more playing until tomorrow…..by which time it will probably up more than the 150 points I was looking for.
Valley I do hope you made something out of this collapse. It would appear you were just a day out.
Honey, I love your persistence. No cigar yet!
Yes no cigar ….YET. But hey there’s always a tomorrow. My stops keep getting tighter until IT (Mrs Market) can’t take the strain. That’s when I make my money!!
The Valley is short since Friday, will go long this Friday.
been a while since AAPL was down 9 out of 11 days
any nibblers here? not me
Now you can think weakness begets weakness.
volatility is not going with the indexes……this is important here
Noticed that too. Total complacency. Is it loading up like a spring, or is something else going on?
Can you elaborate?
on the last push lower in indexes, the volatility etf;s did not go higher
in fact they triggered a sell signal based on my tools
Anyone else spotted the wedge for the SPY? Pretty close to the rising lower line now, maybe one final push higher in the next couple of weeks?
yes. would give us a final top late april.
Yes GM…..VIX also hardly reacting to yesterdays decline. Complacency is at extreme and it is obvious that buyers are once again stepping up to BTFD like the herd of well trained sheeple they have become.
GM,
You me be right, this is not my field of expertise. At the same time I find it odd: the timing of the ECB was so precise, just when things should turn down in Europe. At least they got what they desired, happy bankers, happy investors and a suffering currency. It’s no less odd that a few people can decide that all the money others earned should become worthless. Welcome to the new brave world.
The liquidity issue isn’t my area of expertise either, but I have read that pension funds and banks don’t want to sell their govt bonds to the ECB, as they need to hold ‘safe assets’ (rolling my eyes) for regulatory capital purposes. They don’t want Euros at negative rates, they prefer the bonds.
I suspect (but don’t know) that the ECB move was designed to depreciate the Euro v the Dollar, helping tip the US into recession. The ECB probably knew that the EZ was already looking up, but its mandate is price stability. If it was designed to help pressure the dollar, it was very well played indeed.
The fact the Euro has fallen against the dollar doesn’t make it worth less for Euro citizens, as they have a balanced trade with the ROW, so it just keeps deflation at bay.
It’s all getting very interesting. Martin Armstrong still thinks the Fed are going to raise rates in order to try to stop a stock market bubble caused by money flowing to the US in fear (much like the Dax). Hard to see Yellen justifying that move, they only have two mandates, and stock bubbles aren’t one of them. But perhaps the Fed realise they are trapped now, doomed whatever they do.
I certainly don’t think the Fed have ever demonstrated a sound understanding of markets or the economy, so I won’t be surprised that they hike. That will cause a huge currency crisis the world over though. So much fun ahead.
While it’s hard to rule out a bounce at any time (like Monday), after looking through charts, I’m still just as bearish here…
There’s just nothing that’s popping out to me that would indicate that bounce…
GL
This is usually when the puppet masters gap and run it up to blow all the technicals out of the water.
Read some strategists are expecting a 70% rise in EU stocks by the end of 2016. I think that seems right for the blowoff top over there. after watching the effects of QE in U.S. a long Dax trade is probably the easiest trade of the decade assuming you hold it for a year or two. situation is different with the US markets which may have already had most of the gains. I do feel the central banks will let this ridiculous situation get to a stage where they are unable to raise rates even slightly without major negative impact on the economy.
Alphahorn – is there any chance of redoing your Puetz chart as far out as the year 1900.
The detailed information above about Puetz crash windows is very interesting and useful. But looking at the timing details for the first time, something occurs to me – if SP500 (which is the example being used) is to “peak a few days ahead of the full moon” on April 4th, then it really must surge between now and then. Otherwise, it will have peaked a month too early.
I have two wave counts both ending diagonals to end primary wave [3]. One is already complete the other needs a slight new high toward the end of march to complete. However, when you go back and study my chart what do you see? Every Puetz crash window followef the high. It seems the early bird are beating the window these days and the window follows the bounce that fails to make a new high
I see that Puetz looked at the eight biggest market crashes in history. When I “go back and study your chart” I see four examples, but only one of them could even remotely be viewed as a major market crash. Your other three examples are little more than common corrections – not realistically comparable to what Puetz was looking at.
What I also see when I look at your 9th-18th June 2011 Puetz crash window, is that the market did not begin to fall (by less than 20%) until nearly six weeks after the crash window closed. So I see that you’re happy to extend Puetz’s very specific timing by at least a month.
What I also see, after a quick search of the net, is that many people disagree with your assertion that “there were none in 2013 and 2014”: http://marketpricetime.blogspot.co.uk/2013/05/entering-puetz-crash-window-for-stocks.html
part of his study is that the selling can continue for weeks after the window. He stated 4 weeks, but as you pointed out it can last longer
true Puetz crash windows should only be considered for FULL eclipses. many people use any eclipse regardless of type as the example you showed did with a prenumbral eclipse
Yes the selling can CONTINUE for weeks after the window. But the whole point is that extremely heavy selling should START during the window – not roughly a month or so either side of it.
Going back and studying your first example, where you give the Puetz crash window as 15-24 february 2008, I see that the market fell by around 12% during the first three weeks of January. That decline ended three weeks before the crash window opened. There were further falls of around 5% during and shortly after the window. Surely this is not what Puetz had in mind?
Mark, I seem unable to post. This is a test…
Valid points, Mark.
Krish, speaking of which we have yet another new DAX high.
The DAX is the new widow maker for those short.
Ahhh unintended consequences……what now Yellen and co??
You didn’t see this happening did you!……..they don’t have a clue how to solve this one!
http://stockcharts.com/h-sc/ui?s=$USD&p=W&b=5&g=0&id=p62829972939
Earnings of BIG US multi-nationals are going to get absolutely pummelled with a market thst is already valued at levels that occur only a few times in a century.
Well done US Fed….take a bow!
And it appears, Allan, a principal beneficiary of the dollar’s strength will be the Germans, if the DAX is any indication. Would I be going out on a limb suggesting this will cause even more disgruntlement among Europeans when they see how the falling Euro is benefiting Berlin while at the same time Merkel, et al insist on austerity for others??
I expect the euro to go below parity with the dollar.
But what about v the pound. The target from the triangle breakdown would be 58p, ie back to the all time low.
http://stockcharts.com/h-sc/ui?s=$eurgbp&p=D&st=1998-01-01&en=1949-01-01&id=p43876422394
The hope that 320 million US consumers are going to pull the other 7 billion out of deflation before they go down themselves is tantamount to:
Good point Allan.
I still think the only (temporary) way out of deflation is an ECB QE bid for physical gold, at the worst of it, 2016/17.
Artificially raising gold prices to $35 did not do much in the 1930’s. The economy has natural cycles like the seasons. We are in winter and it is really hard to grow a big new crop in the winter.
The monetary position in the 30s was nothing like today, so it’s like comparing apples and oranges. The market (the natural cycle to which you refer) was not involved in the re-pricing.
Let’s just say that this time, the market will decide at what price it wishes to exchange physical gold for a currency, whether or not the ECB bids. Rest assured, it’ll be several orders of magnitude higher than today’s murky paper-driven (XAU) price.
Hi all ! New record for the DAX. I told you last week that this week would be good for European markets, with the launch of QE. Very nice buying by the ECB, job well done.
Allan, please stop talking about how the US dollar will pummel US multinational earnings. As I said before, earnings, PE, profit margin etc….are totally useless measures in our era. Even with poor earnings, the central banks will continue to buy assets and corporations will continue to borrow at 0% to buy back stock.
Hello Nicolas, the only point I will agree upon is that the markets are broken. It is exactly for that reason that when the turn comes there will be nothing to stop an almost complete overnight wipeout.
The wipeout will occur in several trading days, not weeks or months….DAYS. It will possibly take several weeks to acheive it due to markets being halted after each reopenng and subsequent collapse, but halting the markets will only create greater fear and lead to greater selling panic.
Remember this post!
Continue to monitor Treasury Yield Curve Spread 2S30S…it may have bottomed on Jan 26, at 1.822% signaling the deflation fear has subsided.
If spread indeed has bottom, the next time Mrs. Market make a correction and give you a 20%+ bargain say in the next year or two, you want to back up your truck and buy.
If CBs print hard enough, inflation will return.
Hi Newt ! Yes, but inflation in stocks and bonds. CBs will make sure there’s no inflation in commodities and gold.
I vote for Inflation in stock as corporate revenue and wages will rise. Gold will begin to crash like the 1980s.
Boy, Nicolas. You sure do believe in the omnipotence of CBs. So far you have been right to be bullish, but the comment that they “will make sure there’s no inflation in commodities and gold” isn’t borne out by history.
I wonder what you believe has changed. Or are you related to Draghi 🙂
CB’ers/planners have proven throughout history that they are generally clueless and sungularly focused.
Maybe Nicolas isn’t a troll, just uninformed.
If he lumps gold in with commodities he’s on the wrong track to start with.
If he thinks CBs DON’T want increasing commodity prices generally, he must have been living in a cave these past 50 years?
He’s amusing though, but not worthy of any serious consideration.
Mark, what do you think of refining Puetz window via Saros cycle.
I would post a link, but the last 5 times I tried, the message disappeared.
Can you google “the-saros-cycle-and-the-stock-market/”?
Quoting:
From the perspective of market panics, it can be found that certain Saros series have collected a bad reputation, so to speak.
For example the famous Tulip mania came to an end in 1637, near a solar eclipse belonging to Solar Saros 125.
Subsequent eclipses in Solar Saros 125 have marked years of other financial panics:
*1637: Tulip mania
*1736: Bank crisis (Amsterdam, Germany)
*1799: Crash in Hamburg
*1907: Bankers Panic (New York)
*1979: Market panic, dollar crisis (USA)
*1997: Asian financial crisis
The next eclipse in this series will come in November 2015
A solemn crowd gathers outside the Stock Excha…
A solemn crowd gathers outside the Stock Exchange after the crash. 1929. (Photo credit: Wikipedia)
Solar Saros 126 has been equally “productive”:
*1720: South Sea Bubble, Mississippi Company
*1792: Market crash (USA)
*1810: Crash (England)
*1828: Depression
*1864: Market crash (France)
*1882: Crash (France)
*1990: Start of crash in Japan
*2008: Worldwide financial crisis
The next eclipse in this series will happen in August 2026
Solar Saros 127 is also worth mentioning:
*1857: Crash (USA and Europe)
*1893: Crash and depression (USA, Australia and UK)
*1929: Wall Street crash and start of Great Depression
*2001: Market crash and 9/11
The next eclipse in this series will come in July 2019
Accordingly, could the 2 failed Puetz windows in 2005 be due to a “good” Saros cycle?
http://eclipse.gsfc.nasa.gov/OH/OH2005.html
And 2015 is a “bad” cycle Saros 125
http://en.wikipedia.org/wiki/Solar_Saros_125
Not sure what it means for the 4/2015 window, or why it is so close to Saros 125 9/2015 window.
I don’t know much about those cycles John; but I notice that they are very long, with large overlaps – so I suppose it is to be expected that many events will coincide with one of their years.
One last thought on the coming Puetz crash window though:- major market crashes are obviously rare (and they do seem to have occured during those windows); but it seems to be more common for lesser market declines to start around 4/5 weeks before the start of the window, or to start 4/5 weeks after the close of the window – then, not much happens during the crash window itself.
And notably that is exactly what SP500 has been doing – declining modestly since about five weeks before the window opens. A surge between now and the start of the window would put a different complexion on it though.
Also notable is that IBB has not started any decline yet, so it could still form a peak at the crash window if it continues upwards until the end of March.
Regarding the Saros cycles, it says that the eclipses repeat every 18 years, but for the lunar ones at least, a different part of the world sees it. This is opposed to the new/full/declination moon discussion where everyone sees the same moon. If a lunar eclipses happens, but the market does not see it, does it still crash?
The effect of eclipses cannot be a “vision thing”. A different part of the world will see a repeated solar eclipse too, because that cycle is a few hours longer than a full number of years. The total solar eclipse next week will only be seen by a few thousand people on the Faroe Islands and Svalbard – the world’s financial markets will not crash because they alone witness six minutes of darkness during daytime.
The length of the Saros and lunar declination cycles are so close because they are effectively the same thing as far as their affect on humans goes – ie. the degree to which the moon alternately shields, and then reflects, the solar wind. This alternation is at its extreme when full moons and new moons are on the ecliptic – on the same plane as the earth and sun. That’s where we are now, and in the middle of the tetrad with four total lunar eclipses in a row without any partial eclipses in between, and next weeks total solar eclipse.
There are many records, going back nearly 2000 years, where local people have recorded total solar eclipses several hundred mlles from where modern astronomical calculations say they should have been (after taking into account the width of the totality). These discrepancies tended to occur near the standstills. So that is an indication that the cyclical positioning of sun and moon, through its influence on earth’s tides, is powerfull enough to cause the speed of earth’s rotation to temporarily alter.
If the interaction of these cycles can cause that sort of change, then it is not surprising that humans would also feel an effect from it.
Interesting…thanks.
Currently, markets seem to be repeating Nikkei in 1990, which was a solar max.
Although Nikkei peaked 1/1990, it outperformed until 2/1990. I consider 2/1990 to be the real Nikkei peak, inline with the polar inversion in http://wso.stanford.edu/Polar.html
Similarly, markets peaked (so far) 3/2015, but we still see IWM and IBB outperforming, giving us a sense that everything is A OKAY. It is possible that the eclipse at the end of the month will mark the peak in spreads nearer the start of 4/2015, while leaving the nominal price peak at 3/2014.
Holding my short until I see clear evidence that this correction is over.
There is a season for things …this is correction time. My Zen master would say…be calm, embrace it.
Same here Newt, unless we close above 2065 I will keep positions open. Have a target of 2038 for now. Let’s see…..
J
Gann said to buy the double and triple bottom, sell the Quad.(ref gold now). The 7yr and the 11 cycles in silver as well as the seasonals call for a bottom this summer. For gold The Master Time Factor bottom is due in Dec of this year (the long term not until 2030) and the 8 year cycle Dec 2016. My best guess is bottoming this year and good rally next year. The equivalent rally from the 1980 cycle was 3 years up 2016, 2017, and 2018
To be clear — sell gold right now? I admit, I don’t understand why it is so weak when there is QE.
JL
My opinion is that the gold market is easy to manipulate. I think we will see gold at 5k in the next decade, although the bond bubble probably has to burst first….:)
I checked my returns on an old ISA that has been invested in bonds since 2007……the returns are relatively breathtaking……
J
Could the King Dollar which should have crashed but didn’t (at least not yet) being a factor?
J,
I have been long gold and hurting. It is beyond logic to me. I understand that short squeezes and QE that put DAX to the moon, but the reverse does not apply to gold. The “bears” are long, not short. There is nothing to squeeze. Why should the price keep going down? Why should it be below the marginal cost of production?
Any day now, when sentiment reverses that CB are losing control, we might see that spike up…
JL.
I would think we are near at least some temporary
pause in the $ index, these moves are extraordinary
in such a short timeframe.
The ECB wanted a significantly lower Euro and
they have delivered.
If you want an insight in to $ strength
and it’s impact on US multinationals, then
look no further than PM.
Philip Morris now trading at a 12 month low
and yielding over 5% today.
The rational that an ultra strong $ will not
ultimately impact US stock prices is ridiculous.
I mentioned last week that we were nearing an inflexion
point where stock prices of large US based overseas
earners begin to be more significantly impacted,
we are around that point now IMV.
I would expect that
first the gold manipulation will end
then china will end the dollar peg
then the new sdr will be introduced
read jc’s take here
http://philosophyofmetrics.com/2015/03/11/the-real-reason-the-swiss-peg-ended/#more-2301
Started to take profit on my shorts. Here are the reasons:
selling pressure halting; internals improving; price below lower=oversold and a buy trigger for many trade system.
More importantly, Heed to the $CPC telling shorts to sit down.
The point is. Never get caught too long on either side.
I meant below lower BB (Bollinger Bands)boundary.
Newt another nice call. The push down to the 17638 on the DJIA was out of a triangle and therefore final….unless it sub-divides.
My friend, we have a possible bullish set-up called “morning star” under construction per the Japanese candlestick charting scheme.
In the meantime, Advance issues improved to 1,845, breaking the down trend.
Taking more profits.
It just reversed lower. A few more squiggles of ‘down/up/down’ before it reverses.
Thx very much for the ‘rationale’ behind your calls. That’s what I’m trying to learn using the real time data.
So, is all the money now rushing over to Euroland?
The Chinese have been trying ‘western’ methods (lowering interest rates, Reserve Ratios etc) to reflate their economy with very little success. However I suspect that, like the Swiss, its slowly dawning on them that it ain’t working. Now if they decide on an ‘alternative’ course of action….what would that do to ‘world order’?
With the DAX up 18% YTD, I think it’s
safe to say this has already happened.
You need to net off the Euro devaluation
to perhaps provide some wider context.
I do not see Euro area macro as markedly improving,
the outlook may just look a little less dire.
ECB QE is tiny as a % of Euro area GDP,
the real aim was to weaken the Euro which
has been achieved.
Phil you are right of course. My comment was slightly ‘tongue in cheek’. This may well be the ‘blow off’ top in the Dax. If true you’d have to feel sorry for poor Draghi….or not.
There is no money rushing over to the EZ purvez, it’s rushing to the dollar mostly, hence the Euro’s decline.
The Dax moonshot is just a parabolic blow-off top, nothing more.
I note that HUI is back up by over 3% today as I type, seems that 155-160 is very strong long-term support. Miners need to outperform gold to confirm a long-term bull cycle has started.
Well worth looking at the gold price in all major currencies (as well as priced in any other commodity), I’d say the gold bull has already begun, just the dollar to crack, some time this year.
GM I largely agree with you….but for the Dax to have a blow off top someone has to put some money down….don’t they? Where’s that coming from?
purvez, I don’t know, but it is likely to be from within Europe, and not likely to be an especially large sum either. Given low rates in the EZ, most of it is probably debt-financed I would imagine. No matter, it is fascinating to spectate at this time.
Today’s dip lower has changed the ‘dynamics’ of the wave count. Until yesterday, at least in the DJIA, it was a clear 5 down. However now it’s a double zig zag which is a 3 waver. So we have to expect another high unless we get yet another up down after today’s low.
sorry meant to say ‘expect another ALL TIME high’
Allan – if you want a realistic look at how the EU institutions work, and have a laugh at the same time, check this out: http://www.ebay.com.au/itm/The-Gravy-Train-Collection-DVD-1991-4-Disc-Set-Christoph-Waltz-New-Free-Post-/181671647429?clk_rvr_id=794966390843&rmvSB=true
It was shown on UK TV once decades ago, and never repeated: “We board the Gravy Train in Brussels, nerve centre of the European Community, where …the hard-nosed, insular Director of Information and Culture… plans to exploit the newly-liberated nations of Eastern Europe…”
Thirty years later, and they’re still at it.
Hehehehe Mark, I remember that series well. At the time nobody thought of it as anything BUT satire. ‘Out of the mouths of babes……and television producers’ eh?
For you goldbugs, the not so precious metal
must be due a couple of stronger days.
purvez, I missed the irony ) – early night needed
for me.
Early nights are now becoming a ‘necessity’ for me ….. at my age. Lol. I meant to put a ‘smiley’ face at the end of that comment.
american banks have switched from us market to Europe. Buying even more shitty companies just because draghi has given them some fresh money… banks are now loaded with european shit and qe is just started, they are out of mind or maybe all stupid bears on european markets are now destroyed. But they don’t know that europeans will not return to buy stocks as in 2000?
simo, I keep thinking, who’s the next one to start qe. Of those that are left and creditable enough to do it are the Canadians and the Aussies. Can’t think of anyone else. I deliberately left out the Indian contingent because they are such shrewd business people that they don’t take any risks unless there is an iron clad guarantee of success. So qe is an absolute ‘no no’ for them. I know I’m from that region.
However I’m now beginning to think that once the Chinese ‘wake up’ to the fraud then it’s game over for the monetarists in this world of ours.
Unfortunately that also means ‘game over’ for the other 99% whether we like it or not. Someone here said it will take the rest of their lives (40++ years?) for the game to unwind. That is scary but sadly it may be true.
Low tide on Friday. Apogee shadow over. Next week FOMC. Next week option expiration. New moon coming. Perigee coming. I am all in long on Friday at latest. By way, selling high tide, full moon, apogee netted my account 2.5%.
In cash at moment, waiting for Friday’s end of day to go long.
Valley very nice call!! Definitely your week, despite the shaky start (lol). Take a bow please.
Virtual bow, thank you for your digital collegiality.
🙂 ….and for teaching me a new word, thanks
Random thoughts on gold market. This is a large multinational industry with many small medium and large companies that provide jobs, infrastructure, and in many regions is the only employers for hundreds of miles. They consume lots of oil, buy large amounts of expensive equipment. Pay lots of taxes to governments, etc.. Many of these companies appear to be very cheap. Would it be a good investment to go all in in this sector with a ten year time horizon?
With respect to the Puetz crash window it should noted that the lunar eclipse does not have to occur after the solar eclipse, it can occur before. The wdindow opens around a full moon that is either lunar clipse itself or one cycle away from the lunar eclipse.
EOD, $NYHLR hooks up very nicely from a buy zone where past mild corrections have ended. If in fact this is a shallow correction as suggested by $CPC, price will rally very soon.
In a strong up-trend (like at the past few years) and corrections are mild, fundamentals like PE ratio are useless. TA is your best chance.
this agrees
http://stockcharts.com/h-sc/ui?s=$NYAD&p=D&b=7&g=0&id=p88512801943&a=269536931&r=1410958141020&cmd=print
I like your work.
Surely 3/4 % is not classified as a correction,
an extremely mild pullback at best.
I mentioned last week a pullback of between 3/4%
before a potential move to US higher highs, perhaps
for the final time in this bull market.
The major headwind to this playing out is the $ index,
there may need to be some at least temporary pause
in $ strength.
If that is the end of this very mild equity weakness,
it would fit nicely – still remains to be seen.
The need to be right is strong. The need to remind us is as strong.
I suspect prices may go higher or lower by 2-3% at some point soon. I will mention it again when it happens.
J
German DAX now entering extreme bubble territory in terms of time/price and valuation at PE nearing record levels, whilst FTSE100 is at absurdly extreme valuations nearing levels seen once in a century.
This WILL end suddenly and disastrously.
http://stockcharts.com/h-sc/ui?s=$DAX&p=W&b=5&g=0&id=p59418109646
The UKX would be significantly higher without the
large commodity exposure Allan, if you strip those
components out then the mean PE looks rich.
The looming UK GE is also capping higher levels
to a degree.
I think about everyone can agree the DAX is now
in a parabolic phase.
The MCX has been a closer mirror of the DAX YTD,
if you net off the Euro devaluation.
I have two company visits this afternoon where
there is significant potential on a multi year
basis.
In the majority of cases valuation now
ensures the risk/reward ratio is far less favourable.
That’s where we are in the cycle, and most here will
have seen this a number of times already.
Phil I can’t believe how blatantly obvious this whole market scam has become. They don’t even try to hide their work anymore.
DAX down today and UK markets up significantly. So it’s obvious where the money is going. And if you wanna know why just checkout both the weekly and daily charts of the FTSE.
Both in danger of breaking key moving Av’s and in need of an injection……unbelievable
http://stockcharts.com/h-sc/ui?s=$FTSE&p=W&b=5&g=0&id=p81003811409
http://stockcharts.com/h-sc/ui?s=$FTSE&p=D&b=5&g=0&id=p42493134548
Take 50% of DAX profits today. Will re-add longs on any weakness in the next week or so otherwise will just re-add anyway for the next leg of this parabolic journey. Opened dow and ftse longs as i believe the recent currency moves will retrace to an extent allowing these 2 markets to reach previous highs again.
Allan, my experience may be sightly different
from a UK based perspective.
The huge underperformance of the UKX over
the last 15 years (against many asset classes)
has resulted in many investors turning to property,
rather than equity investment in the UK.
I remember around ’99 about everyone I knew
having a view on the market, discussing tech shares,
the new economy was the phrase used constantly.
Central bank omnipotence is the new “new economy”
– as the cycle ultimately rolls over the illusory nature
of this will become all too apparent.
However currently there are many believers, and good
luck to them – as always someone will eventually be left
holding what others no longer want at the price they have paid.
Nice pop this afternoon, will add to longs probably if we close above 17815 odd.
J
Said goodbye to all shorts aftermarket yesterday.
Sent in my long pre-market this morning.
Market has gone nowhere since Nov. that is a balanced market and this will eventually resolve. Up or down?
My job as a trader/investor is to id and trade the imbalance(s). There are two (2) right now:
1. interest rate fear not justified by market history;
2. strong dollars fear when the correlation with the market is indeed minimal.
Both imbalances, if and when resolved, may push the market higher. Listen to the narratives if they change…and watch if price confirms my observation.
Wealth is built by concentration of the right assets.
Keeping Calm. We need to either break-out or break-down from the trading range for big money to be made.
There could be elevated levels of geomagnetic disturbance tomorrow (Friday 13th) following yesterday’s huge flare (the ninth biggest of SC24). The source, big sunspot group 2297 is clearly visable even through small binoculars (with a proper filter).
There are other active regions (I count 17 on both sides), and some of them are starting to produce spots. This month, and possibly the next few months, is probably the most important phase of SC24 max while it decides to either die away suddenly, or keep staggering on like this.
Appreciate the solar headlines Mark, thanks.
The assumption being made about Central Banks generally is that they will at some point cease QE programs and return to a “normal” environment –whatever that is. I can not identify any period of economic history that would constitute the normal benchmark by which all else should be based. With the BOJ already engaged in a policy that buys assets of all kinds, it would be foolhardy to ignore the possibility that CBs have the wherewithal to buy everything. The ongong experiment is in the currency markets and all others are merely reacting. How do we value any asset when the value of its denominating currency is completely subjective and its quantity can be expanded infinitely and instantly.
OneFive, your last sentence says it all….
Could not agree more…
OneFive, I wonder if the opposite if infinity is zero or negative infinity? Any thoughts?
A very good point. We can use another asset to value them, one that will react to currency debasement. Let’s call it ‘the arbiter of value’!
INTC cut it’s forecast and I doubt they’ll even meet FC.
Nicolas your belief in CB’s being capable of perpetually driving this market higher is going to get a huge test in the months ahead.
IMO China will ease before the month is out and the Yuan peg is turning into a unequivocal disaster for them.
They have ZERO choice but to reassess the peg right now or their economy will collapse within 6 months.
7% GPD growth is a pipe dream!! (it’s already negative)
Nicolas is the best trader/investor on this blog. He has the correct market belief and correct directional bias.
If and when the market condition change in the future, will he change? I think he will.
Why do you believe that?
Newt, investor??….hardly. In 6 months the SPX is up just over 30 pts and risk exposure given that it is a 2-3 times in a century overvalued market is ridiculously high.
Trader maybe, but who the hell can know?
Given Nicolas’ conviction, I suspect Nicolas bought in many many full moons ago.
As pointed out by trader GM two days ago
a turn up here sets up the possibility of final wave
up in rising diagonal to finish bull market from 09
as long as yesterday’s low holds.
that is what I expect.
vix traders in action
http://stockcharts.com/h-sc/ui?s=XIV&p=5&yr=0&mn=0&dy=2&id=p55564411323&a=338178959&r=1426175184475&cmd=print
Thanks, Slater9. These are very helpful.
spx
http://stockcharts.com/h-sc/ui?s=$SPX&p=60&yr=0&mn=2&dy=22&id=p20818975047&a=339142560&r=1426175708320&cmd=print
I am focusing on my Darvas box for the next major pay-out.
If oil/energy selloff continues we might get enough divergence for a Hindenburg Omen.
I think we didn’t get it, right?
http://www.investireoggi.it/forum/dax-performance-index-vt83311-6.html#post4201104
simo, looking at the very first chart, from the low of 2003 it looks like 2 perfect 5 wave zig zags up!! For us EWers that is a MEGA turn on!! LOL.
Purvez – Looks like my short call a couple weeks ago worked out well. I’m still able to post!
geno you’ve got a 6th sense or something. I was thinking of you earlier and wondering where you’d disappeared to. Yes indeed it did. So where to from here?
Great call on your shorts couple of wks ago geno0010 @ 2100SPX. Any thoughts on the markets going forward?
Purvez. Are you long?
Newt I am but only at ‘half mast’. I’m beginning to wish I had taken a full position but I got battered during the down draft one too many times. It’s a rule I follow. I must learn to break some of my own rules.
I really should pay more attention to what you post, Newt. I’m beginning to get an understanding of how your ‘TA’ could work in confirming (or not) my EW calls.
I have to say I’m unlikely to abandon EW any time soon but anything that can give a ‘helping hand’ is very welcome.
Ok Newt, here may be a good place to get an opinion based on your TA. The DJIA has just retraced to the 38.2 level from the ATH to yesterday’s low. According to my count this is a counter trend move and a ‘so so’ count makes it a top for this wave.
Now you tell me whether your TA suggests otherwise please.
For the sake of clarity I’m writing this at 19:04 GMT.
I understanding your trading system. When you get in the right trader and making effortlessly, I am sure it is a wonderful feeling!
No need to abandon EWs. They are challenging. I suggest you just build on your expertise with new and reliable tools. I assure you the discovery process will be totally satisfying.
Question: When you are in the right trade, how do you know when to go for the jugular?
Glorious day for the longs.
We can meet at the Trafalgar Sq. and discuss in detail. Lol.
Yes Newt I do intend to increase my knowledge about the tools that you use. They will DEFINITELY help me in supporting or ‘rubbishing’ my count.
As to the ‘jugular’ I have to say I am too impatient. To give you an example. I took most of the wave from ATH to the Mar 6th low. I was then expecting a ‘bounce’ which I DID get but the bounce ended pretty late at night (BST time) so I left it overnight and by then I had lost most of it the following morning. I was still expecting it to go higher so I didn’t take the subsequent ‘down’ from there!! UGH I must learn to be patient.
Which Zen Master are you working with. Perhaps I need to be under tutelage too.
Are you really in Londo?
purvez. Zen lesson one for trading. Be a blank sheet of paper. No Mind…no bias, no opinion so your eyes can observe.
For your family. be a piece of toilet paper.
Purvez. I been to London many many times. From my window, I overlook the Silicon valley in action. Busting activities; heavy traffic. Not crazy like 2000 yet.
Quit my COO (medical device mfg) position a few years ago to play with my own money. The last 1/3 of my life is about me and not someone else’ agendas.
Newt although I wholeheartedly agree with Zen lesson 1….it’s bloody HARD to do!! Ego keeps getting in the way.
I like your philosophy about the last 3rd of your life. I’ve done something similar although mine started out as a necessity but I’ve used that to my advantage.
My window looks out on to a quiet street in Northwood, a small town near Watford (NW London). I do enjoy the peace and quiet. Never been an urban person although I grew up in one of the busiest noisiest cities in the world. Karachi…..or perhaps that’s why I prefer the peace and quiet.
Newt. nice to hear from a fellow Bay Area trader. I live in Sonoma County. I appreciate your trading advice and outside the box thinking. You live in the Silicon Valley which is where a lot of the tech news is made. I live in the Valley of the Moon which is a good place from which to view the Moon (and it’s effects on tides and markets).
Nice. I love the Sonoma region..
Tomorrow is day before far south declination which is bearish. Also low tide bearish. Next weeks has all the best lunar aspects: perigee, new moon, and cross equatorial crossing & is seasonally good. Only wild card is FOMC. If the market has another big up day tomorrow, I hesitate to buy into ATH because that puts the account at risk for a negative market responce to FOMC. Hard to stay away tho’ as new moon weeks are the most reliable bullish weeks. Guess I will just buy tomorrow on weakness and step aside if there is another gap up at the open.
I think Mr. Fed aka Nicolas continues to be be proven right for at least a few more weeks. I have adjusted my count since the US open today. imv Today is not a dead cat bounce. The rally has legs and potentially could be the start of the bubble phase. I bought BIB, IBB today, not because Nicolas had “recommended” though.
I do believe that this is the last rally before this thing starts crumpling and falling. May/Sep continues the most likely month based on the count.
Based upon Lunatic Traders monthly pair data April and May could have one or two 6 to 10 % down moves(metal months), tho’ given the momentum will probably be gained back by end of May. June July Aug Sept(water wood) should be unusually bullish, followed by Oct Nov(fire) down moves. This monthly pair data is rather consistent going back 18 years.
Lets see if the market internals will deliver your the prediction.
I said it before. Unless inflation returns, market’s upside potential is likely to be limited. That means Mrs. Yellen will not dare to raise rate to compromise the dual mandates imposed on her.
If she works for me, I would ask her to read her job description, the Mission Statement of the FED 10 times and come back to me with 99 ways to get to the inflation target of 2% in a hurry.
Fifth year of decade and pre election year combined with universal CB monetary easing should deliver 10% gains this year. Could be a roller coaster from here with higher dips and higher highs until Mar of 2016. Only outstanding issue is Shemitah cycle which should deliver 87 style down move, tho’ even in 87 the market rebounded quickly.
Hehehe Newt, never mind 99 ways just ask her what’s the 3rd one after ZIRP and QE infinity?
erick, I’m still stuck with my ‘End of the World is Nigh’ count as follows:
https://www.tradingview.com/x/eidZApOK/
If you pull up the hourly S&P I believe we are tracing out an Expanding Leading Diagonal (rare I know, but not extinct). Unfortunately I can’t post hourly charts on my freebie account so I’ll outline my count (includes out of hours).
w1 – Mar 2 2117 to Mar 4 2087 (clear 3 waves)
w2 – Mar 4 2087 to Mar 6 2104
w3 – Mar 6 2104 to Mar 10 2043 (clear 3 waves)
w4 – Mar 10 2043 to (currently in progress and ideally should end around 2090)
w5 – then another 3 waver down to probably the 2000 area or more if this Peutz crash thing occurs.
I’d love to know where you see this up count going to.
Hi Purvez. I like your SPX count that we are currently going towards the end of w4, expecting a higher high, before heading back down.
I adjusted my count yesterday during the day, thinking the rally is quite powerful, not a typical dead cat bounce. However, I probably will need to do that again over the weekend. Honestly I didn’t see the current sell-off today coming at all. It caught me by surprise, and made my counts quite messy. If the sell-off holds today, next week will be quite interesting.
SPX 2040 is crucial. I believe that the support has to hold. Otherwise, the intermediate cycle low could be observed first before a new ATHs. imho
Trader Gary-
thanks for the thanks
There was much more in place on the close yesterday
that pointed to today’s gap and go
if you would like me to show
( One that my young student especially likes because it has to do with dragons)
Yes, that would be welcomed —
EOD. $CPC:$RHNYA back down to 0.0146.
Calming.
From slater9 SPX chart…perhaps it didn’t hit the median line … because “When price reverses before reaching the ML, it will move more in the opposite direction than when it was rising toward the ML (Hagopian’s Rule)”
Purvez and Zenyatta – Swing Trend Indicator is still on sell and none of the daily indicators I use to find bottoms look like they’ve bottomed out quite yet. I did buy some calls yesterday, but sold them today.
I think we still head lower, at least into the spring equinox and new moon, which I think will be a low inversion (instead of it’s usual high).
Buy stops at 2083. The market, if in a bearish correction mode, has no business above 2083.
I am getting the impression that the market might rally into FOMC and then for some reason sell off afterwards into the new moon, also. The usual pattern is to rise next 6 days rather steeply (new moon, fomc, options expiration, perigee, post s. declination) however if tomorrow, mon, tuesday bring us back or above ATH could sell off into new moon.
Yeah, buying the full moon and holding into new moon has been a money-maker, that’s for sure. Also, seasonals are strong during this time period. Things to be concerned about if bearish.
We have, substantially, a “Morning Star” (Japanese Candlestick) bullish pattern being played out in the last three trading days. Under the straight rule, we need a close (say the SPX) above Monday’s red candle for a buy signal to be triggered.
I won’t add to my long position until then….so, in essence, I am agreeing with you.
Ideally, and for the bullish case, Mrs. Yellen will say next week… “don’t worry, be happy”.
Until I see bulls gaining further control…a new high (or a break-down for that matter) is made, I can see myself trading the range and not getting too committed.
Purvez – Looks like the market map is still working well. Figured I could sell 2100 with 2130 SL. Scaled in more at 2110.
Uodated as of March 10th
geno, so far we’ve been on the same page but I think with this wave we are at odds. I posted my thoughts further up in response to erick.
We’ll soon find out which way the wind blows. As Newt recommends, I should stop having pre-defined ideas and let price and internals talk to me.
geno as a point of interest, how did you manage to post charts directly into here? I thought we had to send them to John H if we wanted them posted.
Purvez – I loaded the charts as links through Disqus (where they were originally posted). The comment then awaits moderation from John. He must’ve given the go ahead on the charts.
Aaah ok since you can upload to Disqus then the links work. I understand now. Thx.
geno, interesting – made a note of that one.
Is the chatter around Putin’s public absence
behind the mini bounce in gold ?.
No Phil, It’s Obama, he had 3 double bogeys in his round of golf yesterday, always positive for gold.
Hey people, I tried something along slater9’s charts and this popped up. I don’t know enough about the Median Line ‘system’ to know whether this implies the end of the line for the S&P or not. Perhaps slater9 can comment, please?
https://www.tradingview.com/x/DhgGCsZG/
have posted that chart numerous times here
here is the chart of the one index that has not reached line
will be watching closely
http://stockcharts.com/h-sc/ui?s=$INDU&p=M&st=1982-01-01&en=(today)&id=p17798172470&a=325848835&r=1426246990400&cmd=print
Thanks slater9. I’m sure you’ve shown this before but I have to say it has been difficult for me to follow and I’m only ‘just’ getting an idea of what is going on. I have gone through the links you had given me earlier many times now, but things are only sinking in slowly.
for trader Gary
No one trading the indexes on Wednesday
could not notice that while SPY.QQQ were
down the TNA was up.
Was there technical importance that pointed
on the close that price would explode up on Thursday?
Yes /a classic JERRY’S DRAGON (google to see) was in place
http://stockcharts.com/h-sc/ui?s=TNA&p=5&yr=0&mn=0&dy=10&id=p22443899198&a=326441308&r=1426244099598&cmd=print
I showed the short term trade entry on the XIV
here is the larger context
The VIX traders are the dominant force in the market
when you read of computer driven traders never having a losing day
they are trading the vix.
At the moment price kissed the medianline,
EVERY tool at my disposal said turn in price.
http://stockcharts.com/h-sc/ui?s=XIV&p=60&yr=0&mn=2&dy=22&id=p22495696699&a=388176132&r=1426245009267&cmd=print
The best trader I know is the trader Joed.
We have been friends for 14 years.
In recent years he has run a blog traderjoed.blogspot ,com
Over a years time he publicly posts various CIT’S IN ADVANCE
FOR FREE hundreds of times.
11 of his last 12 CIT’S in VIX have been dead on
and have had trade triggers based on the work I have shown here.
The blue oval on chart represents his latest turn date that he shared in advance.
On Wednesday short term trade signals worked again and again in SPY and QQQ
Here is the importance of that as expressed by Joed many years ago.
”As price approaches an important turn, the tools work better and better on shorter and shorter time frames. Traders mesmerized by their success lose their focus and miss the larger turn.”
Thus when the short term tools are hammering the markets,I am on high alert to be looking for signal of a turn.Wednesday was a classic example,,,
Any idea where oil will bounce?
Or when the DAX will peak?
Excellent. I need to go back to review all your posts and learn from you. Thank you.
I have more than a few disagreements with Mike Shedlock’s views. For one he constantly bashes Unions and history shows that if were not for Unions lower class workers would be far far worse off. I don’t don’t know too many companies that put workers interests and health at a par with profits……….ahem AAPL
Anyway I mentioned yesterday the absurd valuations emerging in Europe and behold. Some great charts:
http://globaleconomicanalysis.blogspot.com.au/2015/03/pe-expansion-us-eurozone-japan-s-number.html?utm_source=feedburner&utm_medium=feed&utm_campaign=Feed:+MishsGlobalEconomicTrendAnalysis+(Mish's+Global+Economic+Trend+Analysis)
I prob should have added a SARC after AAPL
Isn’t it ironic? Last Friday’s good jobs report was accompanied by a big drop. Yesterday’s weak retail sells great news for the mkt
Kent, it’s the $ index, yes it looks perverse on the surface,
the impact of data on the $ is now a major focus.
There are comments from a Nomura economist reported
today on why we may be at risk of a QE trap.
These echo similar arguments made by Bill Gross recently
and they are worth consideration imv, regardless of your
personal views.
They also nicely balance the rational that ultimately CB’s
will buy just about any asset with equities remaining
at elevated levels in perpetuity – which is the logic of
Alice in Wonderland.
Break 2039, buy stops get lowered to 2066
The real stumbling block to us bears on the stock market has been the incredibly positive credit conditions, low interest rates and EZ money. A deflationary spiral can overwhelm that, and one was signaled last month by the big drop in the PPI. Today’s PPI was the 4th deflationary month in a row. That should do it but the unprecedented EZness throughout the rest of the world is worrisome.
Kent
I doubt that anyone who makes money from trading is perpetually a bear? I can be a bear and a bull in the same day several time over personally, anything else limits my earning potential as I see it……
J
Yes jegersmart, flexibility is the key here. Although I clearly haven’t oiled my limbs enough yet. Lol.
I agree.
I say we are in a period of “hesitation” rather than “correction” when participants kept on asking themselves “wait a minute…should I….?”
The PPI report says clearly the FED’s war is against deflation. They should care very little about the stock market.
Is it a buy or sell? I say both.
So you are not sitting on the fence for this one Newt? Lol. 🙂
all the sons of bitch of the world are concentrating long on dax index. stay away
Oooh Kayyy!! I certainly didn’t see this ‘sell off’ for today. Although some others did. geno take a bow please.
Not a surprise. 13 EMA is acting as a restraining belt on price. I took some profits, but not enough.
geno is very good and I agreed with his assessment last evening.
In the meantime, bought some OIL in the buy zone. It is an ETN. When it becomes painful enough, the oil producers will turn off the pump. They will.
Newt the maddening thing for me was that I thought the retrace up to the 38.2% was corrective. I should have taken a short there but I thought any correction would be minor and then we’d head up to my higher target.
As you say I really need to scrub my mind out with bleach and just look at the charts. Ms Market always has a ‘googly’ ready to throw.
Right NOW my problem is that I don’t know whether this is a double bottom and we go back up or slide further down.
Any thoughts anyone? All suggestions gratefully reviewed.
Hesitation is also called whipsaw. No need to get frustrated.
I go to the same funeral parlor to pay respect to people I care over the years. The same priest would make the same sermon every time, it opens ” There is a season for everything….”. Accept and celebrate the seasons.
People’s opinions do you little good. They will confuse you and contaminate your emotion.
I’ve now printed geno’s chart out )
“Geno” – Dexys Midnight Runners,
quality early 80’s track.
Never heard that before!
Reentered my dax long at 11880. Missed the rise today but its now heading for 12500-13000 before any sort of meaningful correction. My least likely scenario which I think is still possible is the dax and dow both hitting 15,000 towards the end of the year. One would never have imagined that even a month ago! The bubble is accelerating and i’m going to run with it. Dow looking more bearish though. I wonder what Nicolas is going to spurt out next.
Krish so you are expecting the DAX and the DJIA to diverge by ‘THAT MUCH’? i.e. 15K for DAX is upwards whilst 15K for DJIA is downwards.
Yes I am unless the FED tries to avoid the appreciation of the dollar. We can easily see a 50% rise in the DAX this year the way things are going. My 11880 position is already 70 points in profit. I think the Dow will drop to 15,000 mostly due to the currency moves and my assumption that the FED will not reverse policy and go start QE again or lower rates further. It is an extreme case though so not my most likely. I do realise the rise in the dax is rather extreme though so am wary of sharp pullbacks but they will be ideal buy the dip situations.
such a divergence is ridiculous… european markets are now overvalued even more than american one. dax in particular has grown by almost 50% from october low….if someone believe in europe there are a lot of other market to buy, italy for example, or spain or france or austria…out of europe brazil turkey…sectors: miners, utilities, energy… german dax is pricing most of the future european qe.
If DXY continues in this direction the FED may be
unable to remove the patient language, let alone
contemplate raising rates.
With insipid recent macro they may want to see
another couple of payroll reports, depends how much
sway Yellen has with the more hawkish members.
SPX forming double bottom right now
I exited my Dow long this morning, have rentered at 17681. If we close below 17670 area I may ditch it.
good luck all.
J
Money is flowing from the working class to the financial class at a crazy rate. It is legalized theft. Labor, commodities the stuff of a true economy, have no value while “financial engineering” has never been more profitable. Russia, China, and the like are not going let it continue much longer. Flash point could be any day.
Also bought some CVX sub- $101 today. Below the “basic (essential)”. Lol.
Buying blood on the street…If I am wrong, Buffett is at fault. Not me.
Last CVX trip bought at $100 and sold at $110. This time is different?
interesting, is this time different?
the 14 year uptrend line from ’03 thru ’08 is broken now
Trends are there to be broken. Buy fear.
Hi Newt, That’s interesting. Have you seen any fear guage on oil.? I haven’t seen any fear on oil at all. Leads me to believe that $34 or so is the number.
If it gets to $34, I will buy more.
My Zen master says. “We feel painful because it is not painful enough”. Lesson: move your finger away from a burning candle when it hurts.
There will come a (too painful) time when oil producers will shut the pumps for good to get even with their “enemies”.
be patient. (hard to do for most of us).
“Total U.S. oil rigs stood at 922, compared with 1,461 at the same time last year”. CNBC.
If live is about too much or too little, the too little will come.
I want to see the capitulation downward move in oil before I buy in.
ok.
i’m seeing an amazing lack of fear – not just on oil or oil stocks.
guess i’m not the only one
Where’s the Fear?
http://slopeofhope.com/2015/03/wheres-the-fear.html
I know Timmy Knight in Palo Alto. Consider your source. Do you balance your view by reading bullish sites?
WT, I think the other side of the coin is what
would have happened if Bernanke and the FED
had not acted so aggressively, probable global
depression with substantial deflation.
Eventual recovery would arguably have been more
sustainable without the need for constant rounds
of QE, but this would have exacted a huge cost
socially and economically
Is what we are faced with now any better?,
I am unsure, it’s a milder but far more protracted
version.
History will probably judge Bernanke well.
“Oil is following the past pattern: rallies fail @ 50-dma, which is starting to flatten out.; bottom retest 2 months apart; MACD + divergence”…Urban Carmel.
This is my last post on this trade. Thanks.
As the most interesting man in the world may say: “Stay long my friends”. (at least until next Friday). Crystal clear bullish set up, all systems go, all bells ringing. I just bought SPY with entire account. I have described why (fomc, options expir, new moon, perigee, rising declination) and now let’s see if I get stopped out.
Going for the jugular. Best of luck!
I went for the juggler because the clown wasn’t around.
I’ve got a tentative ‘scout’ out, like Newt would say, but I suspect I may lose my scout.
What’s your stop point please Valley?
Valley, you are ‘on fire’ man!! Your ‘all in’ call is working out great. That’s a nice present for the week end.
I scalped out 1% on a leveraged bet today, and retained 100% long position into close. Will probably ride the storm out until next Thursday’s close. Since I have made a few gains this week may pay back the market if next week is down. Can’t see major sell off into FOMC on Tuesday so I should be safe till then.
Has anyone noticed how similar the current decline in the DJIA from ATH to Mar 11 is compared to the late Jan to early Feb one? If the answer is yes then the next question is does anyone have any thoughts on what that might mean?
If I remember correctly Steve T was the guy who used to come up with wave comparisons. I may be wrong though.
I should really say ‘the current STRUCTURE of the decline’.
Still waiting on the geostorm
http://www.swpc.noaa.gov/products/planetary-k-index
Is it possible that the market has already “felt” the effects? If so, what is it? Radio waves? Just interested in the science behind this…
Hi John,
if you have an interest in space weather, this guys does a great 5 minute video every morning
http://www.suspicious0bservers.org/
Thanks!
http://wariscrime.com/new/how-the-sun-affects-our-minds/
Thanks, I ordered the book. But I am a little disappointed no fireworks yet. But last night, I could definitely feel the effects.
May I have QQQ for 100 please, Alex?
Only sector remaining is subsidized boner pills for the boomers. Won’t support a nation let alone the entire global economy. Good luck on the long side.
My young student said
” Maybe you just need to start with adults
the way you started with me.Tell them it is just a game that
one player always wins that the only way you keep score for yourself
is by piling up points doing what that one player does. With me you gave me a calculator had me do some subtraction. then had me do some multiplication, then showed me the lines..Then show them an example that will make their brains explode so they can say WOW! like I did.”
17717-17627=90
1785-1742=43
90X.886=79.74
43X.886=38.08
because every trader will not get filled at exact price,ALWAYS
round down… I am always grateful when price ticks a penny or two
below the exact number.. so 79.74 is rounded down to 79.00 and 38.08
is rounded down to38.00
The reason I chose my young student was because I had
sat next to him for hours while he played computer games
juggling 40 variables in real time… Time and again I would ask him to pause the game and ask him”What’s going to happen next?”He would rattle of 12 variable on his paused screen and tell me what would happen. when the game began again that is what happened.. When I pressed him how he knew he looked at me askance and said”I just know… don’t you see it?”
I said that my student easily grasped the traders dream
”I subtract one price from the other then multiply by.618
Then I look on my chart and if price is at the .618 and is at the upper squiqqly line you call bands and then somewhere on those things you call indicators
there is a lower level then that’s it”
He thought for a moment
”You told me that the master of the game uses the lines you call pivots
as targets….is it best if there is a pivot at the level as the .618?”
”Yes”
”So if an 886 algo sets up at the exact same time on an index chart….
is that even better….is that the best?”
I stood up and gave him a high 5 and said ”yup!
He said ”WOW!”
TODAY at the 240 pm bar ,UVXY set up the traders dream at pivot line
http://stockcharts.com/h-sc/ui?s=UVXY&p=5&yr=0&mn=0&dy=6&id=t99579067991&a=337841009&r=1426285258573&cmd=print
AT the exact same moment the DIA set up the 886 algo to the penny. Just as my young friend sees what I can’t in his game simply because of lack of putting in the time to play the game.. most adults can’t see in real time what is going on all day every day simply because they have not put in the time to play the game…good luck… after fighting a life threatening infection and having been in and out of hospital for 5 weeks I am gratefully better and getting ready to leave the game behind to return to the life I love, the life of a slater.good trading
http://stockcharts.com/h-sc/ui?s=DIA&p=5&yr=0&mn=0&dy=3&id=p32516209275&a=326440397&r=1426285729108&cmd=print
Excellent, slater9, simple and useful. And glad you’re doing better. But “the life of a slater”…that refers indirectly to the geometry you use in trading? Or do you mean literally going back to being a slater?
In his old age a man should do what he is passionate about
What I am passionate about is being on the roof… EVEN NOW
AFTER 44 YEARS, I get up excited before dawn on the days I am
going to work. For me , trading is boring tedious job….That i do
strictly for the money so that I can roof for the sheer adventure and pleasure
because I don’t need the money.
I have sent John a picture of me at work. He is free to post it so you can see that slater9 really is a old man slater !
Have fun and be safe up there!
John, Photo?
I will wait patiently for “Parts 2 – ?” of your trading style explained. Perhaps your young student would continue the project. Fascinating stuff.
Here it is
SP-500 is trying to hold that October/Feb trend line, but it will fail.
Quick note regarding my ew recount for purvez: my count started in 2009 and the bearish wedge pattern scenario is still valid. I am convinced that wave 4 has begun and currently worked towards it’s end. I believe that there is a potential for 1 more high before the real correction occurs.
my expectations remain the same: after a marginal new hjghs, spx potentially might retrace 5% to 7% or as steep as 10% before retracing.
I am partially short, but I am holding bib and ibb as well. Biotech charts are still bullish. It Iis like the correction has never happened in bio. Look forward to adding to my short on strength.
Erick – I’ve noticed the wedge potential for a few months now. Based on the wedge it would be an ending move. I’m not ready to concede this bull market has ended yet, hence my wave 4 call and new higher highs (2400 area) to come.
In my opinion, the wedge will break before a new high, bears will pile on, then we’ll shoot up to that 2400 level. That’s the big sell.
I’m still short. Don’t think I need to cover yet.
EW forecasts are just that, forecasts. It’s not something I trade off. My main focus is daily chart indicators and they still look bearish. Over 2083 and my tune may change, but until then bearish it is.
I hope you don’t take my opposite analysis as anything other than my analysis. I’m not saying I’m right and you’re wrong. I’m just stating what I see from my charts. Nothing more, nothing less. Sometimes it works in my favor, sometimes it doesn’t.
I don’t try to defend my book against other people’s analysis, and I try not to make my analysis seem like it’s the best or only around. I just say what I trade. I speak my book accurately and directly. Sometimes that rubs people the wrong way, and definitely not what I’m trying to achieve.
I appreciate others analysis because it makes me question my own and look at the market a different way. For an ending diagonal you definitely want to see negative divergence on each wave in both the MACD and RSI. It doesn’t hurt to have – div in the 15 DMI either. Each wave in an ED should be weaker than the previous.
Geno: big thanks. I actually love your count scenario. My original count is actually quite close to yours: an impulse down now before Nasdaq heads to its 5100. Or spx to 2400. Like I mentioned, I am partially short. I feel the upside is quite limited now as we can never rule out an imminent correction.
erick thx for the update. As both you & geno say in your conversations below it’s good to read alternative points of view to your own.
Friday’s sell off has me confused at the moment. I need to see more of the wave develop before I can get my bearings again.
The wedge was defended today. Next week?
That’s what I’m seeing
Erick – I didn’t have a link to reply to your comment so I’m starting a new one. On the monthly charts there are some scary bearish scenarios that are currently playing out.
ADX on the monthly gave a sell signal at 2075. The RSI broke the up trend line and restested the underside. There are a lot of monthly indicator settings that are playing out like the 2007 top. I caution everything on the bullish side. Keep your eyes on the daily indicators to make sure we’re short when we need to be! Right now is one of those times. Over 2083 is most likely bullish, over 2090 is 92% bullish.
Thank you very much geno. Those are great observations. I simply cannot argue against those technical indicators. I too believe that the bearish wedge over the past few weeks has been strengthened. Your ew count actually is my alternative count. Yesterday rally threw my count off a little bit unless it was simply a dead cat bounce.
I too believe that ew is not a good traditional tool. TO me, it is more or less a technical tool reflecting human sentiment, a confirmation of my trades, or simply a tool to bail me out of trouble.
good luck with your trades. Please continue your great posts.
And that’s why I love blogs like this. Mr. Hampson can give you the LONG term scenarion and what has played out over decades. Other posters come in and give you yearly and monthly scenarios. More posters come in and give weekly and daily scenarios.
When you add all the scenarios into one analysis, you can get a good game plan and stay on the correct side of the trade longer.
And if Nicolas ever learned how to short the markets he could make double the money 🙂
Lol. Your are correct geno. I am sure we will continue hearing mr nicolas’ analysis all the way down to spx 1850. Agreed that nicolas has been the most successful trader on this board. Hopefully you are banking your profits or better yet spent on a brand new Lamborghini.
I have a wife and a 7-1/2 month old son. All my monies is for them. I’m a simple outdoorsman. Hunter, fisher, fun haver. Some money goes to toys, 4-wheelers, boats, snowmobiles, bobcats. Most is saved for my wife and son. She has a brand new car, mine is 5 years old.
And I’m a Bentley fan….
Geno. What a great dad and husband you are. And a great trader! Would love to see pics of your bobcats 🙂
I have 2 girls, age 6 and 7. It is fun and challenging to put money aside for their college funds.
geno I’ve always had a lot of admiration for your trading but now that I know you’re a Bentley man I’m upping my admiration level overall. Lol.
There have only ever been 2 cars that I’ve liked. The big Jags & Bentleys. The former I’ve had for a number of years.
The latter sadly is still WIP. If Ms Markets plays nice then hopefully next year 2016. Although I’m expecting us to be in the depths of a depression and therefore a show of ostentation would be inappropriate I could buy the thing cheap and garage it for a year or so.
Erick – No problem, and thanks for sharing your thoughts. I believe people become vicious in their responses mostly because the post is AGAINST their trade, and they’re trying to protect their trade and their money.
That’s fine. But there are so many thoughts and prejudices that if you constantly read and rethink, you will never make a trade. Sometimes that’s best for some people. Some people simply shouldn’t be trading. Simple as that. But you can’t tell them that because they get pissed all over again.
Posting my IBB chart next, but Mr. Hampson will need to approve the post, so not sure exactly when it will post. It’s my count from 2009 low and contains my resistance level.
IBB Weekly since 2009
Geno. Thanks much for the ibb chart. I think ibb remains the best candidate to moon shoot if/when there is a bubble phase.
Like it a lot when there are opposite analysis with strong arguments like yours. Helps me reevaluate my approach and strategy. Appreciated it.
You are a great dad, husband, and trader 🙂 hope to see your bobcat pics 🙂
Bobcat is machinery, not animals. Use them to plow the drive at the cabin.
Think I’m heading up tomorrow fishing, so I’ll take a picture 🙂
And now I’m becoming the long-winded posts I dislike. I’m better just saying long or short.
Erick – Once again I can’t reply to your post! Congrats on having 2 daughters, you’re crazy to have them so close together! It was about 6 months until there was some normalcy in our sons schedule! I couldn’t imagine having another newborn right now. Your patience shows through by your childrens ages.
Saving for college is simple. 18 years, well 10 years for you. Dollar cost averaging. I opened a custodial account for our son from day 1. He also has a Lending Club investment account.
The Lending Club account is a trial run, but so far is averaging 6.5% yearly return, which isn’t too bad. I’m not adding funds to that account. his custodial account gets all the money he receives, newborn gifts, baptism, birthday (when he has his first) etc.
When this little correction in the stock market is over, I fully expect the DJIA to reach 75K by 2035. Dollar cost averaging, and buying in yearly, similar to an IRA, will pay the college costs. Unfortunately you only have 10 years, where I still have 18!
Also, make sure they take advantage of AP courses in high school for college credit. Every credit they get toward college while in high school is free. I earned 40 college credits in high school, needed 120 for graduate degree. That’s 35% savings right there.
Got you lol. I thought you got some serious toy on the cats lol. Enjoy your fishing trip. 🙂
also thanks for the college tips. Good strategy. American colleges are now becoming luxurious. Would hate to seemy kids acumulative tons of college debts like I did. 😦
I can actually respond to your post! College, in my opinion, is one of the most overrated jobs in the world. Unfortunately, many employers deem it a necessity. I deeply disagree with the value of a college education. The strategy for college payment remains the same.
Regarding college, agreed with you wholeheartedly. With an an exception of a few schools, American colleges are way overrated. We are trained like monkeys to be followers for Corp America. College system is completely broken, just like the economy and the stock market 🙂
Erick – Last comment regarding college (no reply link offered again) Yup. College a broken system. Like gov’t is a broken system. Like the Fed is a broken system.
There has been no evolution of systems in 200 years while life is constantly evolving. It’s sad the most important systems can’t keep up within generations of current mobility.
The markets are not broken if you break it down piece by piece. We know various pieces of the puzzle. People in the US are basically forced to buy the stock market via retirement funds. So we know money is always coming in. Boomers have been sold TARGET FUNDS which move their retirement money to bonds in the later stages of their target date. These target funds are probably underpeforming since bonds are earning nothing. They need to move to more stock exposure.
Fed has 0% interest rates for 6 years and counting. Corporations can buy back stock (at record levels) while issuing debt at 1-3% for those buybacks. That means they only need to EARN 3% yoy to make that a good investment, which US companies are growing, so it works.
Switzerland even has a negative interest rate. Capital flows are how you make money. If you can follow the capital you’ll always know what’s going on.
Capital has been fleeing to the US Dollar because the world knows we can’t ease anymore and the rest of the world is beginning to ease or has been easing.
It really is a sad set of circumstances that we are trading in. But I don’t think I should lose money because the rest of the world is. I’ve lost money in my businesses. I’ve had to do things that broke my heart. But that makes me even more ambitious to take advantage of the markets. Really, broke my heart.
Another great post geno. Sadly there will be an end to this madness. And it will be ugly, very ugly like mentioned on this board by several posters.
Hopefully you and I will be on the right side of the trade when this thing crumple and falls.
I lost millions shorting this market, then made back millions shorting gold. Lessons learned. Live and learn as always.
‘People in the US are basically forced to buy the stock market via retirement funds. So we know money is always coming in.’
geno, you should read and consider JH’s section on demographics, it’s one of the reasons the next 25 years are going to be hellish.
If I were in America, I’d be worried about so much more than making money.
Just for the sake of accuracy, bonds have been posting excellent returns. TLT up 20% over the past year while Zeros were up 35%. Of course, if the Target funds are moving to money market or very short term bonds, then “not so much”.
Good point about dollar strength being a result of positioning ahead of non US QE. Hadn’t thought of it like that. Makes a lot of sense.
Valley, that’s quite a call.
Unless I misread your post you are now 100% long.
Based upon 17 years of us equities data, weeks in which new moon, perigee, triple witching, ascending declination, rising tides in the context of recent low price have low probability of down moves, hi probability of up move, and small chance of steeply inclined up move. Of course, if Mr. and Mrs. Market disapprove I will move to cash, but wouldn’t short this week. Caveat: anything can and will happen.
Some really thought provoking posts this week,
pleasure to read.
Thank you JH for providing this forum.
It’s thanks to the commenters. I too enjoy the read.
I see many fine younger traders here. Wonderful.
My young daughters…an attorney and a healthcare consultant. Both are high wage earners but their total lack of interest in managing their money is worrisome.
The 1937 Recession was caused by a policy mistake when stimulus was prematurely withdrawn. Given the deflation environment, a rate increase soon by FED would be a mistake and can cause a global crisis. We will see.
My weekend is typically about family, hiking, friends, and a bit of fine food and wine. A healthy body and a healthy mind is the idea. A balanced approach.
Many of my daughters’ friends are the bright professionals who attended top colleges while their parents (like me) took the bloated tuition hit.
These kids have very angular skill in a monolithic job market. What do they do if they lose their job?
The economy better not collapsed.
OneFive
Good point worth repeating with regards to TLT and other FI’s. Humans don’t tend to notice slow change very well, a bubble is still a bubble whether it takes 5 years or 30 years to get there…..imho:)
J
gene…my older daughter graduated college in 2.5 years because of her AP credits and community colleges credits and spent her last 1.5 years working as a 6 Sigma project lead. Very little merit scholarship despite her National Merit Scholar title(top 0.5% of SAT testers). The bad news.. her law school education cost $160K.
My younger daughter graduated college in 3 years and spent the 4th year doing internship work in healthcare informatics. Obamacare do her good but not the other front-line healthcare workers. Do you know that young RN can’t find work? and their starting pay drops to $45K if they are lucky to find a job.
I say get out of college (a job prerequisite) as soon as possible and go get some work experience that matter.
Thank you for sharing your story newt. I totally feel the same way. I spent 8 years in college to get the engineering degree then ms and mba. Those credentials don’t do me any good. Went work for the big blue and was their slave for a number of years before getting laid off.
Has gold possibly formed a base folks?.
I have some non margined exposure for the
first time in a number of years, position
taken late Wednesday.
My rational (guess) is that the FED may be unable to
raise rates this year and sentiment appears utterly dire,
dire can become abysmal of course.
In Friday’s trade with huge $ strength gold failed to
fall further.
I should add that commodities and metals are not
my area, and by Tuesday I may view this differently.
It’s a position that can be easily liquidated
and I reserve the right to be incorrect ).
Phil. my two cents is that gold is probably the type of PM that is so hard to predict at this point, especially next week. On the one hand, FOMC week, OPX week could signal a bloodbath week for gold, On one hand the weekly charts are exhibiting partial reversals that could indicate an intermediate cycle low. It is up in the air. I am holding miners, but cautiously set tight stop loss. I am ready to be on the sidelines if needed as I don’t have a clue what direction gold would go next week.
I do believe that gold will eventually hit $3000 again in the next couple years. It takes some patience to wait for the 3 year cycle low which is anticipated this summer. imv it is too early to predict a start of the new gold bull market.
If the stock market does drop to its blood bath phase, or multi year low in Aug/Sep 2015, I think gold will get sold off too, along with everything else.
Phil, gold in sterling was lower back in early 2014, but welcome aboard, better late than never.
Question for Slater9: if I wanted to calculate support and resistance for tomorrows trading is it based upon todays open and close, high and low, or a combination of both? I am trying to understand how to calculate these levels to enhance my exit or entry into trades. Alla Peters at Alphawavetrader.com has great success day traading the hourly charts using fib lines but I can’t figure out how she gets the lines and would like to be able to calculate them myself.
Here is start on Pivot Points until you here from Slater:
http://stockcharts.com/school/doku.php?id=chart_school:technical_indicators:pivot_points
Thanks OneFive.
Thoughts on college: useful to obtain job which requires college: teacher, nurse, doctor, lawyer. Fun, where else do you have respect and status simply because you are part of a team who’s sole function is to acquire knowledge and think up new ideas. Used to be a good investment for anyone because it was way less expensive and there were plenty of jobs in engineering, manufacturing, etc. in which college would pay off over 40 years of work. Now with globalization there are no longer company men and the advantage of the degree is less. As an aside, Andrew Carnegie had a third grade education and became the worlds wealthiest man, first working in a factory, then train conductor, then manager, then investor. And he was a literate man and patron of the arts. Bill Gates famously dropped out of Harvard to begin earning money. Drive, ambition, imagination, a robust economy, and industrious family background are the key, as is flexibility and thirst for success for its own sake without preconceptions of the industry or sector. Finding a need and meeting that need with vigor and single mindedness. One thing that I wonder about trading is what is the societal need that a successful trader is meeting? I guess that is why so many successful traders become teachers to give something back.
erick, on miners I like RIO on a multi year view,
however if we are near peak cycle the case for
holding now is poor imv, except for a shorter term bounce.
Thank you for the view on gold, it’s a speculative
small position for me, and if it goes the other way
it can be quickly closed.
With FOMC, OPEX and likely volatile FX moves it may
be an interesting week.
Valley, thank you for the further explanation behind
your positioning.
Thanks to all. New post is out.
One book I recommend for our kids to read is Rich Dad Poor Dad by Robert Kiyosaki. His latest book Second Chance is also a very good read. Also if anyone’s wants to know about demographics then have a listen to Harry Dent.
Jim Rickard’s is also excellent to listen to on getting an idea of what is going on. The mining game here in Australia has come to a screaming holt. Iron ore and coal mines are shutting down all over the place as well as a lot of the gas exploration. 1000’s of people laid off over the last 12 months. All very high income earners. Things are not looking to good going forward.