

1. US stocks to bonds and to dollar ratios continue to show a clear top mid-2014:
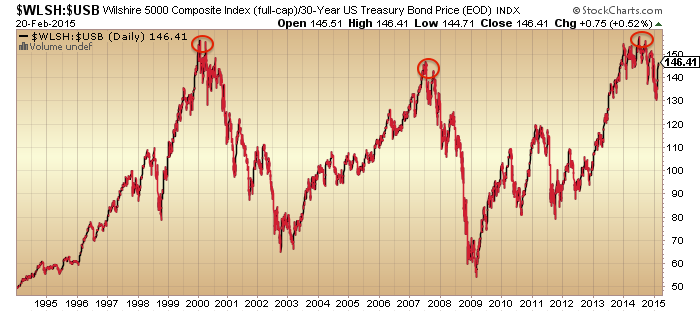
 Source: Stockcharts
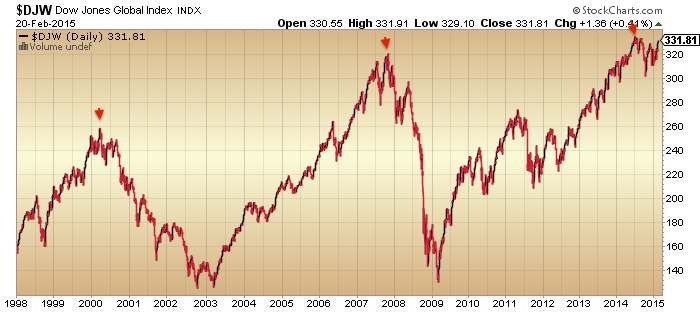
2. Dow Jones World stock index shows a peak the same as the above, but that peak may be under threat:
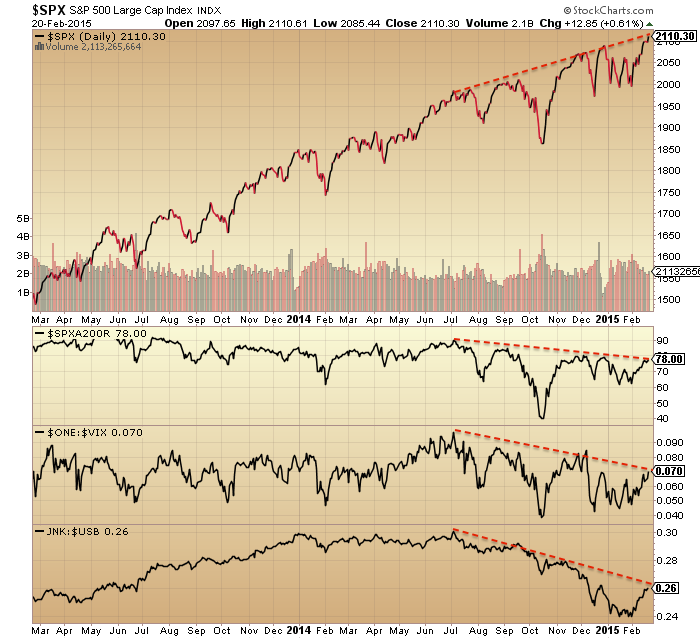
 3. The SP500 has broken upwards to new highs but breadth, volatility and junk bonds continue to show divergences. The resistance levels in all four are now being tested.
4. Various risk measures remain in downtrends since the turn of 2014, though the cyclical to defensive sector ratio has repaired the most in recent weeks.
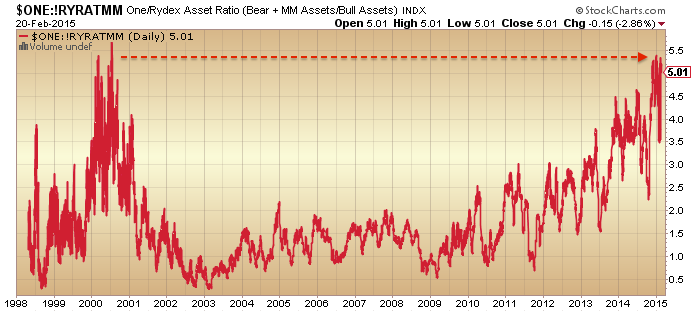
 5. Sentiment and allocations remain at extremes like previous major peaks. Here fund managers and Rydex:
Source: Fat-Pitch
6. Buybacks and mergers have pulled back from their peaks:
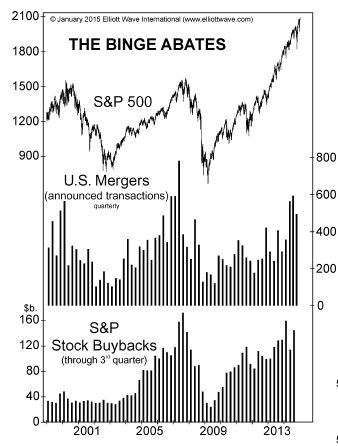
Source: Elliott Wave
7. Bloomberg financial conditions remain in a downtrend since mid-2014:

Source: Bloomberg
8. Earnings growth forecasts have turned down, mirroring the 2007 peak, but price has yet to conform:
 Source: Factset
9. The rise in share prices contrasts sharply with current trends in earnings and economic surprises, captured here:

10. The economy is showing signs of recession as evidenced here in wholesale inventories versus sales:
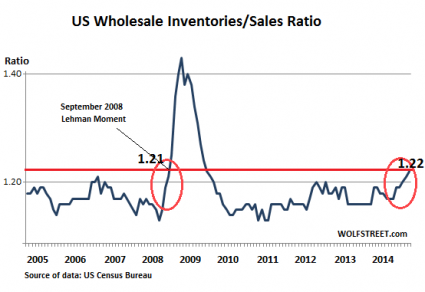
Source: TheEconomicCollapseBlog
11. And leading indicators remain in negative growth and in the big picture continue to show a secular bear market:

Source: Dshort / Ecri
12. Money has been pouring steadily into bonds, with the stocks:bonds ratio in decline since mid-2014.

In summary, we see a hallmark, typical, run-of-the-mill major topping process, that fits with the smoothed solar maximum of April 2014. Firstly, the mania and excess is evident in valuations, sentiment and allocations. Secondly, between the start of 2014 and mid-2014 various indices, ratios and indicators made their telltale breakdowns and divergences. Thirdly, leading indicators, economic surprises and earnings have all turned down. Fourthly, buybacks, mergers, margin debt and leveraged loans have all stalled or declined. YET, despite all this, price has not conformed, so there is something missing from the analysis.
I don’t subscribe to the view that the solar maximum is producing an extended mania like in 1929. We see in the charts above that a typical underlying topping process has occurred centred around last April’s smoothed solar maximum. It all fits as expected. But something is keeping nominal prices rising. So what’s different this time? By a process of elimination we do get to the influence of dark pools and primary dealers against the backdrop of QE and ZIRP.
The dominance of the dark pools over the main exchanges the last couple of years is shown here:
 Plus the leakage from the primary dealers (from who the central banks buy bonds with their QE money) into the stock market. 80% of QE money may be parked as excess reserves but correlations and reports suggest some of the rest finds its way into the stock market.

It’s not easy to quantify either influence accurately. However, all historic manias saw leverage rising right into the peak. ZIRP enables the leverage here, but it’s not increasing through margin debt or leveraged loans. Speculation, as measured traditionally, peaked out with the solar maximum mid-2014. All things considered, it would make a lot of sense if, as BC said, several of these major players are driving price and using increasing leverage to do so, as that then explains the anomaly. It would mean the stock market has gone from being fair game governed by natural forces, to one in which – temporarily at least – a few large hands are controlling price to some degree.
If so, it doesn’t change the situation with earnings or economy which are moving the opposite way. It doesn’t stop the bulk of market players behaving as normally post solar/speculation peak, as shown in the charts. I don’t believe it changes the outcome, only delays, the crash. If the bull market has become highly concentrated in a few major hands using dark pools and leverage, playing a game of chicken in the face of valuations, earnings, concurrent and leading indicators, then it would take a broad improvement in all those to sustain it, otherwise the risk is the market collapses at any time as one or more players reverse, in self-interest.
We ended the week cementing the breakout in stocks, and I keep my options the same. Either stocks reverse down from the current marginal new highs, heading for seasonal March/April lows and maintaining the real stock market peak as July 2014 – or – stocks move higher in a final mania that extends to the summer. If the latter looks to be transpiring I won’t be playing the long side. I consider it far too dangerous as a collapse could occur any moment. Rather I would bide my time and short again when the pop looks to be occurring. I continue to watch gold for evidence of a renewed (and associated) move to safety, plus the extremes in sentiment and positioning pro-dollar and anti-euro look set for reversal at any time, which would likely fit with reversals in stocks and gold.
For the time being I will only be posting at the weekend. I have engaged in new projects during the week whilst the irrationality of the markets persist. But I remain poised to attack once they finally break, continuing to monitor each day and read your contributions on the board.

Thank you John,.. and Andre …n
One other explanation for current market behavior is that the long term cycles are up into 2020 and we are now trying to start a w4 down into 2018. As we are turning against the longer cycle, some right translation should be expected. Always difficult to turn after w3. Now it’s all about short squeezing and absorption. But that can’t take forever. I think the turn is near. Next week a game of dead cat bouncing. First some Greek relief , then Russian worries. I think,
Once a week is fine 😉
Andre, do you refer to the c.18 year long-term cycles?
I have read (and it matches with reality) that the last ‘up’ cycle peaked in 2000, after the bull run from 1982, and we’re now in a rough cycle that will run into c. 2018.
From there, we enter another bull/growth cycle for the world, if that pattern repeats, as it seems to.
Interested to hear if you see it differently, and why. Thanks.
GM,
I think the heliocentric Jupiter/Saturn is leading as it accounts for 80% of solar activity. This cycle is 20 years. The heliocentric Pluto-Jupiter cycle (13 years) also turns in 2020. Lastly, the heliocentric mars-Uranus cycle (2+ years) turns in 2020.
So a lot of significant turns align in 2020.
That supports my vision.
I do find it odd that you consider the long term cycle to be up into 2020, given the state of the markets since 2000, clearly in a secular bear, with some markets still lower now than in 2000, and many only just reached new marginal highs after 15 years.
That seems to indicate more of a down cycle to me, echoed by the state of the global economy.
GM,
We have time enough before we get there. You could be right. But we only learn from mistakes and if you don’t make assumptions, you can’t be wrong.
Good luck with the new projects John.
The best explanation I have read that might explain the impact of global QEs on markets is contained within these 2 links:
http://www.alhambrapartners.com/2015/01/09/complex-interbank-math-part-1/
http://www.alhambrapartners.com/2015/01/09/complex-interbank-math-part-2/
Tough reading to be honest, I don’t claim to grasp the intricacies, but in summary, if the global banks feel the CBs ‘have their backs’ via ongoing QE, then the banks will be more willing to advance ‘risk units’ to the economy, via the real economy (loans) or via the markets (derivatives, trading, counterparty activities).
So, the Fed talking about tightening might end the party, but if the Fed changes course, who knows. I find it hard to see how they could do more QE into USTs, but perhaps something more creative next time, fiscal perhaps, or they buy the global stock markets?
It is all going to get out of hand in the next few years for sure.
Given demographics and debt, it’s likely interest rates are staying at negligible levels for a long time, so given that, plus central banks collectively still net QEing, the question is whether big players using central bank receipts and high leverage at cheap leverage costs can maintain a bull market until that macro situation changes. Plus, CBs could yet introduce other unorthodox policies that are further supportive.
However, it remains that money printing and ZIRP only serve to corrupt the money mechanism, they do nothing productive. Thus we have the scenario where stock prices are rising but earnings growth and economic indicator growth are falling. Plus, increasing leverage is a ponzi scheme that usually reverses hard. With extreme valuations and excess leverage versus falling earnings and economic indicators, surely the end is nigh unless the latter two improve. That may be possible given the lower input costs from cheaper commodities. But the sharp falls in commodities, like the ultra low Baltic Dry, show the strength of the deflationary recessionary trends in the global economy, rather than something positive.
In short, I believe it is similar overall to other speculative manias in that it is a leveraged ponzi scheme into the peak diverging from earnings and economic growth. Only the make-up of the players is different. The easy conditions didn’t stop a bear in 1937 US or in 1990s Japan. I would expect that ultimately self-interest will bring it down, as one or more of the big players reverse course as it becomes increasingly unjustifiable.
I would also be prepared to entertain the notion that we are entering the final period of the global debt bubble, and the US dollar based monetary system, where settlement of trade imbalances is the real issue, and has been since Bretton Woods.
That means that some central banks will be forced by their govts to keep printing and buying assets to fight the debt deflation. Including buying more equities.
In effect, we will be entering into potential hyperinflationary scenarios, where nominally stocks, real estate, will keep rising. In real terms falling of course. Bond yields will rocket though.
I rule nothing out in the current climate.
You could be right. Printing money to buy your own debt is the end game, no going back from that. However, I’d previously calculated debt to GDP levels wouldn’t hit real limits for at least another solar cycle. I saw the seeds being sown for the hyperinflation now and the next decade but coming to fruition once demographics turned back up, because for now the increasing money supply is offset by the shrinking money velocity. I guess it depends how aggressive central banks get.
John, I constantly ponder when it will reach the limit, sometimes I feel it could stretch out for another 10-15 years (somehow), and other times I can see it all coming to a head within a few years.
I think the determining factor will be the bond market, as that money will seek other assets as it exits when the 30+ year bull ends and flips. I think a lot of it could head into the real world for a change (having exhausted the financial options), and commodity prices will shoot up, in dollar terms especially.
For now, let’s just see this bloody cyclical stock bull taken down at the knees eh?
Thanks again John for the insights. I do agree that the dark pools are sinister and contribute greatly to extreme leverage/ valuations. I think this house of cards collapes in Semptember correlating with the Semita 7 year cycle.
Terrific stuff as always John. 2 back to back negative January closes in 2014 and 2015. With no major sell offs in almost 2 years and bearish divergences showing up frequently its not a question of if but when a significant pull back results. Crude and gold tend to lead and both these commodities are down well over 35% from their life highs set in 2008.
Agreeing with John, I think fresh money should not be playing the long side until after the next correction since the market should only be bought when there is blood on the street.
I also agree with John’s analysis but as long as price is getting goose higher, I am staying long. The next ATH (if it comes) amid weak internals is when I start to take some profits.
How do I know when the end is near? Here are some e.g. $NYLOW scored a 12 on Friday, indicative of sellers’ frantic desertion. Watch it rises to a critical mass in the future as price begins to sputter …watch for $NYAD (cum.) negative divergence, watch for $NYHL no longer support any marginal ATH. These are very simple, but powerful tools that show the real market.
John is smart to take on new projects as the musical chair game continues.
Thank you, John, for another piece of well-researched and logical analysis. I reiterate that my chart diagonals are pointing to significant lows around 10th March for several UK listed companies so I anticipate a decline starting this coming week. If this does not occur then I think there is a real risk of a sudden and brutal flash crash occurring.
John Hampton:
” It would mean the stock market has gone from being fair game governed by natural forces, to one in which – temporarily at least – a few large hands are controlling price to some degree.”
John you have the most amazing knack of putting your finger on the pulse. Of course all credit to BC for highlighting the issue in the first place.
When you have out of control powers then the only thing left is to step aside and watch them go up in flames of their own creation.
Omnipotence … my A$$$!! 😀
I’m sorry but this talk of big players manipulating the markets is pure tosh!
The markets are made up of millions and millions of players of differing sizes; it is the largest player, the FED,that is manipulating things.
I believe Johns overall analysis is spot on but what I believe he has done is to underestimate the short/medium term power of an incumbent US administration.
Given that I don’t know of one example in the last century, and most definitely, in the last 50 years where the US equity market hasn’t risen in the sweet spot of the Presidential Cycle – 1 Oct Year 2 ………to 18 July Year 3, to be short through the sweet spot doesn’t stack up!!
In the second Pres term the rise is even more likely to be significant. Furthermore, the fall after a second term is more likely too. ( e.g.. 1987,2000,2008)
John clearly highlights that most world equity markets naturally topped out mid 2014 but the US with its self looping political system is fighting against nature.
I believe John will be right ………after the 18th July.
Will.
One more thing……take a look at the CITI US SURPRISE INDEX in John’s note. as I said a week or so ago, once it was negative then there would be a wall of fear to climb. We now have that.
The big manipulators have already been caught fixing FOREX, libor, and commodities. Certainly “they” could do the market. Don’t forget the CB’s and interest rates. However, manipulation is nothing new. It is nothing new for gov’ts being involved either.
“Long term target for this bull market: SPX 2530 to SPX 2630 by Q1/Q2 2016” quoting the seemingly infallible Caldaro team. It is inclusive that there will be a significant pullback,for which detailed forewarnings will be given, such as the present 20% chance of given impending inception probaility. Once this bull is out of the way of sanity, thereafter we can only regret the way we all allowed this insane absurdity to happen. What say you again dikfobrain Mr Clinton and equally gimme advisories?
Lets be frank bill this world of selfishness is doomed by its worship of self.
EVERY trader I know has made a major mistake at least once, including me..Caldaro remained firmly bullish at the top in Oct2007 despite all the technicals and did not turn bearish Jan 08… At least he had the courage to admit his glaring mistake many times to his readers, explain in detail the causes of his mistake and promise to not make the mistake again.
Predictions blind our eyes. We have eyes but we can’t see what is in front of us because we are too busy thinking and believing what will happen next regardless of the reality.
Believing predictions will paralyze your courage and ability to act.
Predictions are straightly for entertainment only.
Good comment. Every cycle was suppose to bottom in Oct 2014 per the Kress Cycles. That prediction really had me on the wrong side of the mkt.
Your blog is extremely valuable; I am 70 (01/12/15) years old; 43 as an investor; my wife and I, sold are home in Plano (Texas) and put the proceeds in TZA; we are hedging our two sons, their wife’s, and three grand children (4, 2, and three months)!
Sincerely,
Mike Burns
Lopsided investment in a dying industry, oil, is what will bring the whole thing down. Energy companies revenue and profits have peaked in 2011 and have been declining steadily in spite of optimistic forward projections. Production and consumption have peaked as well. Progressive companies and countries are unapologetically investing primarily in efficiency and renewable energies and not fracking, and now emerging markets seem to be leap-frogging the whole oil industry, straight to renewable. Though the ratio of renewable energy is merely 1:100 now the transition in terms of time will be exponential, and will take many by surprise. Oil co. mergers, bancruptcies, layoffs, stockpiles will all be exponential. Profits to renewables will lag the destruction of the oil industry, which currently confuses investors, but if you simply look at the consistent decline in renewable energy cost per watt, the destiny is not debatable. Currently roughly half of oil consumption is at risk due to solar and wind reaching grid parity. Energy storage is advancing faster than forecasted as well and jeopardizes the other half. I believe the chaos has already started, but old money and central banks are trying to force the world to conform to outdated theories, based mostly on Bernankes obsession with the Great Depression. Hope for oil price recovery has presently saved a collapse but any up move here in the oil based energy sector is its last gasp. It will definitely not make it to the next solar cycle.
WT, that is one hell of a post! If you don’t already know, a certain Neil Woodford happens to share the gist of your point of view and has already decided not to invest in any oil companies. Thought provoking stuff indeed and if you and Woodford turn out to be correct then this is one of the biggest game changers in a generation.
Another way to see it is reflected in the declining EROEI (energy returned, invested raitio) for oil and rising EROEI for wind and solar. Solar is passing shale oil, wind is passing imported oil. http://www.softpanorama.org/Skeptics/Financial_skeptic/Energy/Images/eroei.pnghttp://www.softpanorama.org/Skeptics/Financial_skeptic/Energy/Images/eroei.png
Bad link. Maybe this. http://en.wikipedia.org/wiki/Energy_returned_on_energy_invested#mediaviewer/File:EROI_-_Ratio_of_Energy_Returned_on_Energy_Invested_-_USA.svg
John, we have a clear breakout in many indexes in monthly view. USDJPY is not done yet (correlates good with equities) and if history repeats, the we are in final blow off before 23-38% correction ensues:
also on my twitter @kenhui89–Market changes coming up??(1)Feb 24–2+2+4=8 (2) Venus-Mars-Neptune-Uranus alignment (3) Feb 23 Chin Bazi Astro aspect 年柱乙未 合日柱庚午
I have quoted this link as a reply to my above twitter
Crude is key folks in terms of the short term
market direction as I mentioned over the weekend.
If downward momentum begins to build again then
equities are likely to head lower as the
focus returns to weaker global growth.
That aside I stick with my long term view
that the end of Q2/Q3 is the most likely
time for this bull market to finally roll over.
When I first mentioned that timeframe here
nearly a year ago, it was dismissed out of
hand by many who anticipated a 2014 bear market
beginning.
I notice recently that many posters cycle work is
suddenly pointing to that timeframe.
On my part it was simple guesswork, earnings were
too robust to herald a new bear market in 2014,
so that was not a difficult call.
If earnings expectation begin to trend upwards then
the 2015 call will be invalidated.
Will P hit the nail on the head. There is nobody capable of manipulating the markets other than the US Fed, which BTW continues to grow its balance sheet even after the end of QE.
The last V recovery coincided with an expansion in the Fed blanace sheet.
We all know by now that Central Banks are terrified of the markets declining by even 10% as market highs is the only way of maintaining any degree of confidence amongst the population that things are improving. They know if they lose the markets they lose the lot.
Unfortunately they are losing the war as deflation is evident throughout the global economy and it is eating away at the foundations like dry rot.
These markets look tired, 35 points on the Spoos in 3 months is hardly anythng to cheer about.
Syriza’s proposals are doomed to fail. If there is one thing Greeks do better than anyone else it is avoiding taxes.
On top of that it will only go further toward making the lives of average Greeks harder. Whether it is a black economy or not it is still an eonomy.
Opposition in Greece will grow louder in the months ahead if Tsipras gets this through. Their ONLY real choice was to walk away and start again.
I’d like to congratulate all longs on the FTSE 100 this morning….only kidding!
Great to see the mainstream media touting these sorts of stories, worth saving them for posterity:
http://www.telegraph.co.uk/finance/markets/ftse100/11429100/ftse-100-record-high.html
The writer was counting his chickens I believe, let’s see if they hatch!
With commodities heading down this AM the UKX
is being weighed down.
HSBA also a factor today.
Many of the defensives are nicely ahead today.
Investors intelligence sentiment (not that it matters anyway) Bullish 56.6%, bearish 14.1%, and bull/bear ratio 4.01. Such readings are typical of a bull mkt, but also a top. The top comes after a long period of strong readings. Well that has been the case since 2009 with especially strong (topping) readings during 2014. Just another examople of what the heck is going on? The only difference now, is that a credit cycle sell signal has been given (deflationary spiral). But due to the torture, pain, and suffering last year I am waiting for an intermediate sell signal.
I am probably old school in comparison to some
here, and was taught many years ago that you
got completely out of equities when trading
below the 300 DMA.
That is certainly not going to catch anywhere near a
final bull market top, not sure how many still use
this metric.
Do you mean 200 ma? Above or below the 200 day is probably the key trend indicator. Back in the really old days bull markets traded down to the 200 ma in most corrections. As a testament to the extreme bullishness now, it is more like the 50 day. It has made it down to or even below the 200 ma 3 times since last Aug. That used to be a warning of a change in trend, until this “new era” we are in now.
“old school” and “back in the really old days” – this is one of the most important reasons why its different this time (it being different every time). Back then, if you wanted to know the value of the 200DMA you needed the last 200 copies of a newspaper listing share prices; and a pencil and paper; and a lot of time and patience.
I would think that very few would have been doing that – only the big firms, and a small handfull of very dedicated private investors. Nowadays, everybody knows these things instantaneously.
That’s one problem I see with trying to speculate on the future by adding up all these indicators and measurements etc: those whose pockets you’re trying to pick, know what you’re up to.
I used to anxiously await S&P weekly chart service “Trendline” that would come in between Monday and Friday.] Now I am slightly irritated when the summation index is not up within an hour of the marlet close! I respectfully to some degree disagree with Mark. The info is available, but there is such an overload it is hard to discern the gòod from the bad.
My line in the sand is 320 day SMA and if it doesn’t recover promptly (say within a week). You can back-test.
Because it fits 10/2014 in the backtest?
Does your charting allow you to further back?
Yes, but I guess it is hard for me to tell visually what is the right fit. Do we want a line that is never touched, or frequently touched?
Applying 320 SMA on KOSPI for example, will lead to many whipsaws since 2011 — but I grant you almost any SMA would.
A month ago AAPL was one of the few remaining majors that represented value. Now even it is moving to over valued.
There is no way known to man thatt AAPL is going to repeat anywhere near last Qtr results. Not even close.
Very few places left to hide in this market.
http://stockcharts.com/h-sc/ui?s=AAPL&p=D&b=5&g=0&id=p93920924738
Lunar 7D:
Declination: slightly +, with N coming end of week (N is very -)
Degree light(phase): -, past new moon strength
Distance: -, apogee ahead
Depth tide: -, falling tides all week
De Planets: Merc Retro farthest elongation over, – next 20 trade days
Daily seasonals: – all week
Direction of price: recent strength may retrace, –
Summary: all 7D indicators are down with exception of declination. I am fully short at moment, nursing a 2% loss from last Fridays counter Lunar gains. If trade is not stopped out will look to go long after the full moon. Anyone notice Venus and Mars are almost touching. Amazing to see them move across the sky together.
Valley, last time moon was at perigee on Jan 21 and very next day US equities spiked up higher (over 30 points) and next day it stalled without making a new high and declined slightly lower. That was the start of a one week sell off for an additional 60 points.
This time moon was at perigee on Feb 19. Very next day equities spiked up higher (over 13 points) and next day (i.e. today) it stalled without making a new high and so far declined slightly lower.
Will history repeat again? Two differences … last time Jan 21 was the start of Mercury retrograde and Jan 22 was the ECB meeting. Also this time equities are breaking out from a consolidation and printing ATH’s while in late Jan it was rallying from a sell off and stuck in a trading range. Therefore, if I were to “guess” I would bet that markets weaken only slightly for one or two days and then keep plugging up to an incrementally higher high at least into the end of this month.
Whatever you do I caution you to think twice before going long after Mar 5 (i.e. full moon), because all of my studies indicate mid-March to be an extremely volatile wide ranging days trending negative.
Perigee often marks short term tops, with sell off for 3 to 4 trade days after. A fairly common price pattern is bottoming 4 trade days after apogee and then rising to perigee. I am very interested in your studies and why mid March to have extreme volatility. Hope you share some of your data sometime. I recently found a pattern of bi monthly trend changes that rotate in groups of five, and the Feb Mar bi montly trend is up until mid March and then down until end of March. Happened about 80% of the time over last 17 years. This system also has Apr and May as having downward prices and volatility.
If only it was so simple as to sell all perigees and buy all apogees then we would all be rich by now, eh?
Anyways, I mentioned this before about Mar 15 or 16 being the final (i.e. 7th out of 7) Uranus & Pluto waxing squares. The last one occurred on Dec 15, 2014 and the two weeks leading into that date was a negative trend change and especially the final week from Dec 8 was a harsh sell off with Dec 9 to 11 having incredible 30 to 40 point intraday sharp up and down moves.
The one prior to that occurred in April 2014 and it declined in the first week and rose in the second week leading up to it. The one in Nov 2013 had little change and the one in May 2013 had a decline occur starting after the date.
But the main point is since this is the seventh and final occurrence the impact is also supposed to be even more pronounced and dramatic.
Thanks for explaining your rationale for calling for mid March decline. Will add your research to my list of factors. A weak signal though persistent is buying the middle of perigee apogee cycle and selling the exact day of perigee or day before apogee. Something about mid point of moon positions that weakens market. Same trend for phases, buy mid point between full and new moon and sell the full or new moon. Both of these are weak signals but when combined give stronger signal. Declination is more complicated, buy far south, sell 2 days after equator cross, buy day after far north, sell 1 day after equator cross, buy again at far south. Adding distance, phases, and declination give a stronger signal.
yes, I looked at them tonight. We had some (rare, for us) clouds in the sky the past couple of nights, so I missed the actual conjunction. But they’re still close to each other this evening.
The 300 DMA folks as mentioned,
not the 200.
Try CCI(272)…cross below 100 is your sell signal.
We have just witnessed a savage bear market
in crude and some other commodities, the assumption that this time it’s different
is inaccurate imv.
Every bull market has a different theme that
helps drive valuations, so in that sense it is
different.
What is always the same is that the business cycle
ultimately peaks as do earnings.
CB’s can alter, but not abolish this cycle.
Phil you have been very staunch in saying that until earnings forecasts change this bull will remain. I’m unclear in how to interpret your above post. Are you saying that the bear in crude will affect earnings and therefore affect the wider market? Is that the ‘suggestion’ of your post?
My apologies in advance if I’ve misunderstood.
Big Pic. The bogeyman is deflation and all CBs will continue to go all out to fight.
Yes Newt, I’m looking forward to that ‘fight’. Godzilla vs King Kong!! Will be quite Epic. Don’t even know which one is ‘G’ and which one is ‘K’ at the moment. You got any ideas?
stop shorting the market, it is a losing game, everybody should buy silver and take delivery, to corner the market and double its own wealth. demand is rising all around the world and price is artificially beated down.
annual silver production worths 15 billions of dollars, what is the Apple’s capitalization right now? A TRILLION of dollars…sell the paper, buy silver, and tell everybody you know to do the same
Hi all ! I’m glad that John covered his short position. Finally a good decision.
Today, I wanted to congratulate all those who are bullish on biotech stocks, with IBB at new all time highs today. This sector is still undervalued and is just beginning a strong bull market. It’s a good time to add to your positions.
Thank you
I can see a generational buy here!!!
http://www.stockcharts.com/h-sc/ui?s=IBB&p=D&st=2000-02-23&en=22222-09-09&id=p55731275993
simo500, indeed a generational buy at such ‘low’ valuations!! Who could possibly lose at this point. Lol.
simo500 thanks for the late evening giggle!!
I don’t know when, or why, or what will make it happen, exactly…..but I can’t ~not~ believe that in a couple of months, we all won’t look back at this post and have a good chuckle….
Well, almost everyone…..
Nice chart, Simo…. I don’t usually zoom out on charts, but it’s good to step back once in a while and look at a 10-15 year chart….
Yes, that’s sustainable…. No doubt about that… :-O *shaking head here*
Yellen will crash biotechs today
Hi Nicolas!
Sometimes I fantasise you are a well paid technical analist at one of the CB’s. In disguise visiting us, knowing what is in store. Trying to help us, whispering to us, poor mortals, using a mantra that is so obvious for someone in your position, in the mean time blatant congratulating yourself for your smart observations (that what you do, every time you come around, is it not).
Since some of us are looking for a good entry point, a low or a bottom, can you throw us a useful bone from your frontrunning tradingdesk?
Good luck with your IBB “investment” folks.. Thanks but no thanks from me. It may go on a bubble phase from here, but the reward is not worth the risk. I am just perfectly happy to stay away from this rubbish aka US stock indices. May start shorting by mid-week instead.
IBB has quadrupled over the last three years or so – not a compelling buying opportunity for those who don’t own it.
Similarly, NASDAQ Composite also quadrupled over four years into 1999.
But then it doubled, so now is not necessarily a compelling selling opportunity for those who do already own IBB.
One of the main themes in John’s analysis, and most of the comments, is that history repeats and rhymes in measurable ways. So here goes:
1920’s Dow +484% gain in 8 years
Gold +733% gain in 3 years
Nikkei +433% gain in 7 years
NASDAQ +733% gain in 8 years
IBB +325% (or 240% from the breakout) in 4 years
To quote Barry: “It’s good to step back once in a while and look at a 10-15 year chart.”
Indeed. Let try, using the Dow Jones Industrials.
From the top January 14, 2000 to the first high after the March 6, 2009 bottom, June 11, 2009= 2361 TD.
Let’s multyply x 1.618= 3820.
January 14, 2000 + 3820 TD= March 30, 2015.
1/4 of 2361= 590. Let’s try that one too, counting backwards from March 30, 2015.
It is 593 TD to the bottom November 16, 2012.
From that date is 599 TD to the bottom July 2, 2010.
Then 583 TD to the former bottom March 10, 2008.
Not too bad, all circling around 590, all bottoms.
So the end of March is a timeframe that has merit.
First muliply was 1.618 x 2361 TD to come up with 3820.
Lets mulitply 3820 x 1.618= 6180.
From March 30, 2015 count back 6180 TD and you end up with September 5, 1990, in the midst of the big correction with a loss more than 21%.
Count back 6188 TD from September 5, 1990 (8 TD’s more) and you end up with the huge top February 9, 1966, followed by a correction of -26 %.
Two events you better be afware of when long and March approches (I am one of them, only with a small position).
Perhaps a more easy way to look at this:
July 21, 1941 H (-29%) + 6155 TD=
February 9, 1966 top (-26 %) + 6153 TD=
July 17, 1990 top (-21%) + 6152 TD=
December 26, 2014 H.
For such a long cycle almost a miracle how close the TD’s match.
Now in 1941 the high was followed by slightly lower high, 41 TD later. And 41 TD after December 26= February 26, 2015.
Just wait for the big red candel, should it come around.
Andre; can your research using astro type indicators help with forecasting long term moves like the move that took place in the Nasdaq per Mark’s post on February 23? Thank you for any feedback; but mostly for all your fine work that you share with the traders here on John’s site. Cheers.
Ecletic,
I like to think so. Right now exploring heliocentric astro cycles and I see promising stuff. But too early to be final.
To me, the CRB tells the story. If commodities start turning up—-WAR!!! God help us all!
A little update on my gravity project.
Finally found how to calculate inversions. So now all my gravity indications are theoretical (calculated straight from sun and moon). Not surprised to see the next inversion will come Thursday, at the same time the gravity indicator gives the high. My guess is this will produce the sharp decline I was expecting.
Previous inversion was last Thursday. The GI gave the low Friday. Thursday a high, Friday a low.
Cheers,
André
Another thing.
Yesterday the moon was conjunct Fortuna. Fortuna is calculated from 3 important longitudes : sun, moon and ascendant.
I use a heliocentric zodiac, so the sun is not an object in my chart. But the moon can only be conjunct Fortuna when the sun is conjunct the ascendant. So I still can see what the sun is doing in a heliocentric zodiac.
Now have to see if aspects of moon and Fortuna have any significance.
eh? the ascendant changes with every minute of the day and goes thru the entire zodiac in a 24 hour period. so it seems to me that your choice of ascendant would be entirely arbitrary as it would be one point at 9AM and 180 degrees later (or thereabouts) at 9PM
Ex-Plunge Protection Team Whistleblower: “Governments Control Markets; There Is No Price Discovery Anymore”
http://www.zerohedge.com/news/2015-02-23/ex-plunge-protection-team-whistleblower-governments-control-markets-there-no-price-d
I think it’s beyond question that prices are controlled.
The only question is how long can it be maintained for.
Nicolas said:
“Today, I wanted to congratulate all those who are bullish on biotech stocks, with IBB at new all time highs today. This sector is still undervalued and is just beginning a strong bull market. It’s a good time to add to your positions.”
OK, I have taken a long position at 338, let’s see how this goes.
J
jegersmart you’ve just jinxed it for poor Nicolas. Lol.
Not my intention, but as he gives no specifics or any real information at all (which is why I believe he is just a troll) I might as well just track his “tips” this way.
J
Greeks will have to start paying for their traffic tickets. No more tax evasion. Lol.
One can always expect the worst scenario to come, but a true speculator chooses to take advantage of the up and down of human fortune. Never a basher.
If you are an e-wave fan, GREK completed a 5 waves down during Dec-Jan. Did you buy?
Picking the bottoms besides spotting the tops is more fun.
Posting this because of CB discussions and debate.
http://www.zerohedge.com/news/2015-02-23/ex-plunge-protection-team-whistleblower-governments-control-markets-there-no-price-d
Makes sense for them to control markets. Otherwise we would have a catastrophic collapse and global riots. I just wonder how they will keep it going up in the next recession. Maybe buy all the shares everyone else sells until they own the entire stock market?? That would be a disaster…where would we find yield then?
I honestly think that it would just be easier (and cheaper!) if they simply banned down-ticks….. Seriously, why don’t they just pass ~that~ law?
it’s early and i know you can’t bet against the them, but
BTK is looking really really good
ugliest candle yet yesterday
Not sure if this is capitulation by the shorters or the masses heavily moving long stocks. Anyhow John made a great decision to move to the sidelines for now. We might be able to short 5,10,25 even 50% higher. Who knows how far the marking pumping will go!
What the hell! Gone very small long Dow and dax. See if this bull continues now! Do as the FED wants is my new motto until it fails haha.
Well that was a quick result! Stop to break even. John are you still going to provide updates whilst you are out of positions? Would be good to see how the indicators develop with this recent run.
Anemic up volume says buyers lacking commitment. Buy the next bottom may be an option instead of chasing the market.
AAPL looking vulnerable.
Just started to (slowly) sell some my 2X leverage long positions. Why? I see caution signs. e.g. $NYADV 13 EMA lower lows. Erection no more.
The market can grind higher still. Not time to short yet until I am completely out of swing trade longs.
I will accelerate my selling if some big deal negative divergences show up such as $NYAD (cumulative).
Embrace the market (the up and down). Bashing it do you no good.
Great job staying long, and now taking profits.
Thank you. Sir!
IEI:HYG hooking up is spooky. Unless market internals dramatically improve to support the price, a correction may only be 2-3 weeks away. Limited upside potential doesn’t justify any large long exposure.
It is rare to have both bond and stock market to be right at the same time.
pretty candle in the making on TLT?
the more is study it the uglier the BTK candle gets
dammit janet needs to be very careful here
JH, your new moon indicator indicates a sell soon. Is it 4 calendar or business days from the new moon?
I see that many are beginning to follow my advice to go long this market. There’s no point trying to short this market when central banks are buying assets by the trillions. I’m happy to know that my solid analysis was able to convince some people to go long.
thank you
A few weeks ago I bought a few bottles of Dom Perignon. My plan is to uncork them when the NASDAQ touches 5000. It shouldn’t take long, probably next week.
thank you
Do you only post here, or on other places on the web too? Because it is just not fair if you share with us when so many more can benefit!
LOL! great way to end the day – with a big smile
Nicolas… whether you are a troll or not, you have the winning trades on this board so far. Those who stay long like newt… great move. I wish I had had the guts to be long. Just happy to not losing money, by staying on the sidelines.
imho i think now is a good time to book the profits. 🙂
There will be a bottom in the future. We will have fun picking it together:-))
Hi erick ! Honestly, I don’t even know what a troll is. What’ s that ? I’m just trying to share my analysis of the markets.
Nicolas. I got to say that I very much appreciate your “analysis” and announcements. Enjoy them tremendously.
Nicolas thanks to your analysis I’m up 380B in the last few weeks. Thanks very much for your generous analysis that you share so freely.
Do you think it would be a good idea to loan some of my ‘winnings’ to the Greek Finance minister….. of course at a reasonable interest rate? Then he won’t have to go begging to the Troika.
I now understand what your true motivation is in getting all of us to make Billions so that we can bail out the poor indebted countries without further getting them into debt with the Troika.
Do you believe that we can pull the same thing off by helping the US as well? That would of course annoy the Fed somewhat but hey…why should we care..right?
OOPs I forgot to mention that I was bidding for the Dom Perignon as well until I realised it was you I was bidding against. So sorry that you had to pay ‘over the top’ for the fizz.
Since then I’ve found out that those bottles were ‘corked’. Hope you don’t mind flat fizz.
World total debts= 223 trillions. US total = $18 or 8%…while US is 23% of World’s nnormial GDP.
The point is, the US can borrow hell of a lot more and not getting into trouble as compared to the other banana countries.
US debt is not the reason to go short despite what the perma-bears are telling. Not yet!
Good one purvez. ROFLMAO.
Good comments Newt. Agreed. Again, great moves to stay long patiently.
I am on the sidelines but my counts have yet been invalidated… I still believe that from end of Feb/early March to mid-March will potentially be a time period of the SM daily cycle low 5%-10% correction, or better yet, even the intermediate cycle low, a 15%-20% correction.
Of course the blow-off top phase could completely invalidate my counts again. 😦
“Patient” is so yesterday….the word now is “flexible”. (Says Yellen)
Stopped out of SPXU with 4% loss. In cash. Lunar, tidal, and seasonals all pointed down this week, yet market went higher. Will stay in cash for a few days to review.
Valley I very much respect your posting ‘ALL’ of your trades, even when they’ve gone bad. I’m very sorry for your loss and I do hope that you make them up.
It would seem that in the short term markets are not governed by lunar, tidal, seasonal etc. They are governed by myopic Central Bankers.
Just start sharpening your pitch fork and cut holes in your white sheets. Lol.
Yellen is one of a kind.. lol. More dumb money suck in the markets every time she opens her gums to say something about the US economy. 🙂
Today an intermediate high was made leaving a truncated 5th for the market players to deal with over the next 4 weeks.
Thanks. What does that mean?
I think it means “this is the top, sell”.
Nicolas
Let me know when to sell, add or whatever?
J
US 18 trillion in debt is preposterous!…..how about including ALL liabilities!?
The US is just as and actually more bankrupt than half of the rest of the world combined!
The ONLY reason you have ben able to get away with it for so long is because the USD reserve status.
The time to pay the piper is coming for the US. The US has exported its inflation to the rest of the world for a century and that is all about to change!
Without any implied criticism,
would it be fair to say that many posters
cycle work has not accurately predicted price action
over the last 18 months?.
Given continuing ZIRP is that likely to change in
the immediate future, as a combination of
ZIRP with QE appears to have altered (not abolished)
the business cycle.
Phil, my analysis of the current situation is that it was massive amounts of Credit which ‘altered (not abolished)’ the business cycle. It allowed individuals and Governments to spend without having to worry about having to balance the spending with productive enterprise.
QE & ZIRP in my view are merely the death throws of that Credit expansion. They represent the desperate LAST measures that need to be taken to keep the Credit expanding.
On that basis….to answer your question, I believe that we are nearer the end of the current bull business cycle. ‘Immediate’ is a very difficult term to define in this context as it can range from the next second to around your own time frame of Sept/Oct’15. I certainly believe that we are likely to see the start of the change during 2015.
Sorry I missed out the ‘key point’. I do not equate the business cycle with the current state of the Stock Market which is a mis-priced set of assets.
I am more in line with your own thinking on business cycle i.e. earnings related.
I enjoy reading the posts about various cycles and astronomical aspects
i have never had any success with them personally
i have been sucessful in the past using certain patterns and investor psychology
trendlines, double bottoms/tops, head and shoulders and the like.
i have always believed that a psychology degree would be more beneficial in understanding the markets than any finance or economic degree
seeing the actions of my clients and postings at various websites i suspect that we are very close to a situation that will lead to declines worse than 2000 and 2007.
that BTK chart is awfully CSCO2000ish
Two losing trades for minimal losses does not mean that the cycle work of lunar tidal is not valid. Previous two trades were winning and by greater percentages. Persistence of lunar tidal effects is consistent over last 20 years and even tho’ the macro picture will be/may be engineered to have a permanent high plateau in price, imo it will be in the context of the monthly tidal lunar cycle.
Nicolas’ belief (CBs omnipotence) and directional bias (up-trend following) are both congruent with the current market reality. logically he is a winner until the reality no longer support his belief and/or directional bias.
Who is Nicolas? Just like Who is John Galt?
Valley,
If I wanted to send you some stuff, do you have an account to send it to?
Hi Peter,
Thanks for the offer. What is the basic substance of the info? I am totally exploring tidal lunar patterns right now. If it pertains to that I would welcome it. By the way, I am short again today, hope the market figures out that it is time for a retracement.
$SPX:IEF
4th top since Sept 2014. Watch if this RISK-OFF indicator is going to gain traction and take a low risk trade accordingly.
But in answer to Phil’s question – yes, everyone here has been wrong at times and will continue to be so in the future. So what’s new?
J
purvez, thank you for the reply.
My own take is that we are now in the last
few months of the current bull market.
However, if earnings estimates begin to trend
upwards that view will be invalidated.
Newt, it’s the central theme of this bull market,
just as the “new economy”, “productivity” and
all those that went before it.
If you take the current theme to it’s illogical
conclusion, which equates to something along
the lines of .. the business cycle has been abolished,
CB’s will never allow another equity bear market .. etc –
then that is only proven illusory after the event –
which I think is also your point.
Speaking of which, the “peak oil theory”
driving ever higher prices has suddenly disappeared
during this savage bear market in crude.
Supporting themes tend to be forgotten very
quickly when price action moves significantly
in the other direction.
Just some cycle info. I quess you won’t welcome it, while it has nothing to do with the patterns you explore. Hope this time your shorts pay off nicely!
Hi all ! Yes, my central theme is central banks omnipotence. It is really different now. Before the 2008 crisis, central banks used to cut rates and nothing more. Now, they cut rates below 0 (see the Swiss central banks with a rate of -0.75%) and they print trillions of dollars to buy assets. That’s a very different thing and it ensures a continuing bull market. It’s really quite simple.
For all the mocking, you have been right. But I guess what many are asking is, wouldn’t this story change at some point? Eg. when Yellen becomes data dependent and no longer patient. Could be 1 year or 3 years from now, but how will you know and alert us to sell?
Just for the record. My mocking of Nicolas is not for whether he is right but his irksome attitude which appears to border on gloating to me.
This is the first time since I’ve seen his comments has he provided some degree of background information for his calls.
In this forum most are only too pleased when people make money from the market and are often seen congratulating the individual.
Nicolas comes across as a self congratulatory snob who wants to rub our noses in it…..at least that is the way I read his posts.
My school report did however say I was a ‘sensitive soul’. Lol.
You could be onto something. That equity markets have become the new bond market (controlled by central banks) and as such will be much more manipulated over the next hundred years than the last. The last century had a untamed equity market and a centrally controlled bond and currency market. Perhaps the next will have a controlled equity market that is not allowed to fall by much and has a permanently elevated price to earnings ratio. This is Solari Report’s conclusion that equity markets will become the replacement for the bond market.
You just said something any street person would say. There will never ever be any political/economic consequence just to print trillions of dollars, nothing will ever go wrong in this ever-changing world, genius, right?
It has been said….
The four most expensive words in the english language……
This Time It’s Different
When CBs are desperate. They can buy the (stock) market….like the HK Monetary Authority during the SARS crisis in 2003. They’ve won…killed all shorts and made ton of money in the process.
Buying the stock market must be in Yellen’s tool box. Why not? It has proven to work. FED is not out of ammo. Don’t under-estimate their ability to carry out their mission statement.
If you ever make money shorting the market in the future, make sure you cover your shorts promptly.
My point is…expect the unexpected…Keep an open mind…since the market tends to punish those who are opinionated-:))
Newt you say ‘It has proven to work’. I’m unclear what exactly you believe has worked other than just artificially inflating the market? Since inflating the market is not in Yellen’s mandate how has it helped her mandate is what I’m trying to understand here.
Nicholas’s view is long always to infinity.
There is no need to debate this or question him,
he has stated very clearly what his position is.
Any comment or opinion on this is utterly pointless
as the debate will be entirely circular, his view will
not alter.
It may be best to put this to one side, just leave
it there.
Good points Phil. You are one of the rare ones on this (bearish) board who has been right. I recall your call of 2015 top since last year while most of us were screaming crash. My trading tools also point to a top in 2015, but we both know that the Fed is very capable of stretching and altering the cycles to the unprecedented levels. I also agree with JH that this thing could crater and fall anytime, regardless how strong it looks. While not looking for a crash, I am looking for a major correction in March, or May, or September.
I was wondering if this list could point me to any money manager bear who is still short. I mean this as a serious question — I had a list of such managers in 2010, but that list is now zero (except for dedicated short sellers).
Hugh Henry, GMO, Hussman (Recent Report) are all delta long, despite being vocal about longer term bearish prospects. JH is not short anymore — not a money manager, but well respected among us. Paulson is long gold, but I believe his delta is long as of right now.
Yes, there are dedicated short sellers like Chanos, but that is their mandate. Who is seriously short and doesn’t have to be?
This is related to JH’s chart:
https://solarcycles.files.wordpress.com/2015/02/21febu13.png?w=547&h=244
Going from 0.5 to 5.0, Is 90% capitulation of the bears the extreme level required, or the minimum requirement.
I duplicated the study based on ETF AUM vs Inverse ETF AUM, and find the capitulation rate is 85%. The question always remains why we can get to 90% crazy or 92% crazy or 95% crazy.
Buy side gets too crowded. My read of the market says we are at the early stage of a re-set (correction) to attract new buyers.
I can’t figure out how to paste my graph, but my inverse vs regular ETF market cap graph would peak at the start of year 2015 — so it is about the same as the Rydex graph.
I did the analysis because I am not sure if Rydex is as relevant as ETFs, but the numbers turn out to be about the same. The capitulation ratio from one extreme to the other extreme is -85%, but the data doesn’t go back to 1999.
Eyeballing the Rydex, it is about -87% over the same period 2010-2015. Is that right JH? About 5.45 over 0.7.
So a lot of work, but interestingly almost identical numbers.
For those who care, projecting from my graph, to get from 85% capitulation to 92.5% capitulation, we need half the remaining bears to capitulate or the bull funds to double in value.
I am sure a linear model is wrong, but at the current rate, it will take another year. And in two years, there literally will not be any bears left.
Therefore, I am only really certain that we will peak before 2/2017!
Wow. not a good new at all for the bears. Thanks John Li for your research.
Well, we never went to 0% bears even in 2000 — I certainly thought last year was it, to be honest. I am just trying to figure out the worst case for the bears.
By various measures we have bear capitulation, equal or greater to previous major peaks.
John Li, my personal opinion on why we get to 90+% crazy is usually lack of understanding of information, whether wilful or otherwise and herding tendencies.
With most ‘crazies’ there is ample information to clearly identify the ‘crazy’. e.g. Dot Com or Fracking or even the somewhat obtuse Feb QE. However most people are too lazy to understand the details and leave it to money managers who are then stuck with keeping with the trend (herding) or losing their jobs.
However your post above has made me think about a corollary question.
Given what BC said about the Fed wanting a continuous upward trending average and managing that through the Primary Dealers at the margin, what would eventually stop this from continuing?
Barring unexpected and SIGNIFICANT (run of the mill no longer works here) geopolitical or natural upheaval the only answer I can come up with is:
There will reach a point in valuations vs earnings where ‘a single’ money manager will baulk and decide to risk his job and sell his holdings than hold anymore. I believe that, given the Fed’s management of the indices is at the margin, any concerted selling of actual equities would overwhelm their capacity to manage the upward trend further. That’s when the rest follow.
Since as you say even the most bearish money managers are ‘net long’ in the market right now it will take what Phil’s been saying i.e. a downturn in expected earnings to precipitate that action from one of those money managers.
I only wish I knew what that precipitation point was.
Anyone got any alternative answers to my question? All submissions very welcome.
I based Hussman’s net long on his most recent report
Click to access sar1214.pdf
And by calculating all the option deltas.
I do note that he was net short from 6/2014, and then he “learned his lesson and redid his model”.
If a virus is too effective on killing, eventually it too has to die as all its hosts dies. Perhaps CBs collectively can prevent the market from ever going down, but if I were Yellen, why not let the other central banks do the work and reap the profits. As you said, at some point, the game theory breaks down, and it takes just an marginal seller to decide to act different, early and profit.
But yes, we are both seeking the same answer….when? Sorry, I wish I knew.
I like your analogy about the virus. Now someone needs to let the CBs know that.
Technical analysis aside, I have been anticipating that the Fed would try to keep this rubbish up at least until Mrs. Yellen’s testimony. They are sure doing that right now. I personally believe that there will be not much reason to buy after today. ATHs with low volumes. It looks like the fraudsters are sucking the bagholders’ last pennies in, before opening the trap door.
I am getting ready to short as soon as the markets start a swing.
erick, do you have a ‘point’ on the chart where you would say that the ‘swing’ had started?
Hi purvez. I think the gold swing was observed last night, and the SM swing is in the work. My counts combined with the charts identify today as a swing. I am going back short.
02/26 swing day plus or minus 3 days is what I came up with. I believe Andre and others on this board also mentioned this week? It is almost impossible to detect top, but I am comfortable enough to go back short today.
On another note, as far as the gold swing is concerned, I have been the so called “gold bug” for quite some time. However, I don’t believe gold is out of the woods just yet. It is due for a 3 year cycle low this summer. I am holding miners, but probably for couple weeks only. Cycle wise, there should be a sell-off after the current bounce imho.
erick, many thanks for your response. Today’s intra-day reversal is pretty much what I was looking at for a swing down. However my personal poison is Elliott Wave and for that to work out the waves (in the right order) have to go below today’s intra-day low.
I’ll let you know when I feel comfortable that all the waves are aligned downwards.
Don’t hold your breath please. Lol.
purvez. Great observations! Thanks. I too am a little uncertain with my EW counts. The only reason why I am willing to short the SM now is because of the cycle count which has been stretched way over the norm. I still have not seen an allocation of funds to precious metal yet. A gold swing last night is still not fully confirmed, and the fraudsters can always take gold down again. Gold is highly manipulated. So hard to get a good counts these days. With that said, I have very tight stops in place just in case my read is wrong. My fear is that we’ll get a blow-off phase instead of the March corrections.
I am with John Li about last year as well. I too wrongly believed that the crash was due last year. The Oct correction unfortunately was prematurely aborted by the Fed, resulting in an extremely compacted cycle, with a new cycle beginning on 10/15. I lost a fortune shorting the markets since August of last year. I am not a perma bear at all. I temporarily turned bear and paid the price last year.
I have been lucky to get about 70% of my trades on the right sides so far in 2015. If my counts are validated, I believe the best opportunity to make money this year would be to go long after the March correction. After the blow-off top phase during April-June, I plan to short again before September. I think Sep/Oct is an ideal window for this market to crater and fall.
Hey erick.
I’m into gold too, but don’t class myself as a gold bug. Although I do only go for the physical, plus a tiny hold in HUI shares.
Re manipulation, it just isn’t true, it’s just an excuse from the gold promoters to explain a bear market.
This blog does a good job of mercilessly mocking the manipulation meme:
http://kiddynamitesworld.com/conspiracy-fact-gold-manipulation-goes-front-page/
(Please note this entire post is sarcastic, not his actual view). Check out some of the links within the post.
I look forward to the 3 year cycle low being behind us, but will be buying in the meantime.
Good luck.
GE…a prelude to king dollar rolling over?
Oil goes higher despite record inventory.
New narrative coming to keep the bulls alive?
the question must be how long it can go on for?
empires can take a long time to die.
the economy could go to absolute hell.
massive deflation and unemployment.
but central bank money could keep the markets going up?
what are they really indicators of anyway?
george, most of the CB money is sitting at the Fed in the form of bank reserves!
The money that could drive US shares to truly manic levels (starting later this year) would come out of govt bonds the world over.
I hope everyone here is mindful of that.
so people/institutions sell government bonds and put money into shares?
would this selling force interest rates up?
what about effect on UK property?
Today I wanted to congratulate all those who are longs IWM (the Russell 2000) which is making new all time highs. It wasn’t too long ago that some on this board were bearish on the small caps and talking about non-confirmation with the major indices. Well done longs !
Oh no, congratulations to ~you~!
You’ve been quite prolific the past few days, Nicolas…….
And I for one, feel much, much better now….
Well done, indeed!
My quotation system must be bust. IWM is showing as being negative for the day.
Can Nicolas please confirm. Thanks
You can’t dispute success. Not yet!
Uh oh, jegersmart! Hope you’ve got deep enough pockets for the next recommendation.
Bullard on CNBC tomorrow. Don’t short till he’s done talking.
Global debt growth seems to be healthy enough, I wonder if the solar slowdown would tend to cause debt levels to level off eventually?
http://www.bis.org/press/p150207.htm
This whole market has become arrogant and uninsightful and nothing more than the recent comments of Jeff Bezos that he can, “turn on the earnings spigot anytime I want”, epitomises this more. It is alarming to me that this man in his position could make this comment and it should be a huge red flag to all AMZN shareholders.
Well Mr Bezos you have had 20 years to do so and blown massive amounts of shareholder money on failed venture after failed venture. Your company has a PE that is beyond extreme and your margins are so tight that even the slightest squeezing of those margins will see your earnings once again go negative.
I will go on the record now and state that AMZN may not survive in its current form, if at all, if the global economy sees a drepession and yet here is its share price at levels that to me are beyond absurd.
Hi Allan ! Stop wasting your time with fundamentals like PE, earnings, profits and so on. All this is totally useless in our era. Even if AMZN has poor fundamentals, the stock will go up as long as central banks print money and buy stocks. I would appreciate if you could focus on central bank actions instead of worthless metrics.
Nicolas makes a valid point. From a different perspective, it isn’t the the market that is going up, rather, it is the denominator (pick currency of your choice) that is going down. Cash grows more worthless daily because it is so easily fabricated (out of thin air). The CBs could own all liquid assets in exchange for the liability of currency which they can print without limit. We are truly in uncharted waters.
Commodities versus equities…violent reversal ahead
http://stockcharts.com/h-sc/ui?s=SPY:$CRB&p=W&st=1980-02-26&en=22222-09-09&id=p90565479977
Excellent chart simo!! Thx for sharing.
Of course just like IBB totally sustainable. Maybe they are both aiming of ‘escape velocity’. :-O *shaking head here* (borrowed from Barry)
Hi Simo,
I’m not familiar with the ratio here, can you kindly enlighten me? Thx!
This is a great chart. Shows how cheap or how expensive stocks are relative to commodities. The interesting thing to note and up for debate is exactly where we are in the present cycle when we compare it to the last parabolic bubble in the past which was in the mid-1990’s to 2000.
Some might say we are already in the 1999 top and 2015 will be the high before the market rolls over and dies. But according to my view and eyes we are probably more in the early to mid-1998 stage, meaning two things: this bull cycle still has likely two years left of a manic blow off top but not before one final massive sell off correction (>10%) occurs likely in 2015 and indications point toward the autumn period again.
Thx Steve and Simo
I agree but can’t help but remember I thought the same thing at .65
Thanks Simo
Eric, just my best guess, nothing more.
Well you have to say Albert Edwards is nothing if
not consistent in his bearish views, his latest
comments being reported today.
He appears to be pointing to the second half
of 2015 as a moment of reckoning in asset classes.
Whether you agree with him or not,
his views are usually a thought provoking read.
The FTSE and DOW are struggling today but the DAX is rocketing higher. I can’t see any bear market starting in the next couple of quarters. The momentum is far too strong on the bullish side. It is still a buy the dip market and I plan to buy the DAX on the next dip to 11,000 as it is overbought at this level. Target for the trade would be 11,600-12,000. As long as you have stops in place the long DAX trade is probably the easiest money to be made since 2009.
Hi Krish ! Yes you raise a good point and I want to take this opportunity to congratulate all those who are long the DAX. It wasn’t long ago that people were talking about the DAX underperformance and how it didn’t bode well for the US markets. I still don’t understand why some people would short the DAX with the ECB printing 60 billion euros a month.
Congrats to you too. Are you hedging the EUR exposure though?
Mrs. Market typically punishes people who have market beliefs that are not congruent with its direction.
Nicolas I am long but I still believe the markets are extremely overvalued at the moment. I am just betting on the overvaluation getting even larger before the final destructive phase.
Sorry I hope to be long on a pullback in the DAX. At this rate we might not see 11000 again before the market crash. I think the DAX could at best hit 20k before the crash but that will take until end of 2016 at the earliest.
if we base on history, DAX is the MOST EXPENSIVE relative to other markets on the whole globe. German GDP is expected to grow only 1.5% this year.
http://www.gurufocus.com/global-market-valuation.php
The astrological view is that Germany is on a financial roll at least thru July, 2015.
Presumably the big money will start big block selling in May or June. Watch for divergences and high churning volume
RSX is breaking out against crude oil. Sanctions will be off one by one in the next 6 months as the parties are well aware of their constraints, reality and options.
Russia is a low risk trade. I am sure most people would disagree with my idea, except Jim Grant but he is a perma-bear.
Long and strong.
PS. All the technical analysis I have learned means nothing unless it is used to support low risk, high reward trade idea.
Newt, purely on an EW basis the current ‘up’ is a wave 4 which is actually coming to an end. So we should be expecting a 5th wave down below the low in Dec. Thereafter you should get a bounce worth trading. Anywhere from 50-61.8% of the overall drop.
My opinion therefore is that some more patience may be required here.
Nicolas is just a troll. really.
He is Mrs. Market (the current trend) speaking to those who dare to bet against her. Lol.
Newt, I disagree….
He’s NOT a trend follower… Because he doesn’t waver or change when the trend changes… (see the October drop, for example, and any since then..)
You could argue those drops weren’t a trend change (I appreciate that we all trade trends in different time-frames), but still, you can’t really stay long in an downward 8-10% correction and claim you’re a trend-follower….
He IS a CB worship’er, and I can’t argue that’s not been successful……so far….
And it WILL be successful…….until it’s not….
And unfortunately, the moment it’s not, is going to be a VERY radical re-evaluation of risk, and of price-levels…
And I’m convinced it’s going to happen stunningly fast…
But, like many others, not really a clue as to when that occurs…
So, until then, we take a stabs at it and see what unfolds….
Fair to say, February of 2015 is NOT when it unfolded… hahaha
But we’ll keep trying…
Lots of ways to define a trend. Long term trend followers want price above the 50 day MA and the 50 above the 200. Been that way for months (since the rally from the October low I believe). Some will stay long until price crosses below the 200. When was the last time that happened?
I think he is a troll too but the bitter reality is that he has been ‘right’ last year and so far this year. All we can say is: markets can be crazier than people sometimes.
What is it, the markets can stay irrational, longer than you can stay solvent.
GM – Thanks. You might be right about the gold manipulation. However, what I have consistently observed over the last few months, more so recently, is the major dump of future contracts normally right before the US markets open. 10,000 contract dump 10 days ago is the largest dump I have ever seen. I believe that the volume is low, that the bullion banks potentially may have it whatever direction they want.
I think the gold swing yesterday has been confirmed today.I am still waiting for a reallocation of funds from equity to precious metals, before the SM starts its own reversal.
Good luck to you all – both longs and shorts
erick, following on from our chat yesterday about EW counts…..I generally count the 5 minutes on the DJIA including overnight sessions. Using that data I believe we completed our 5 down from yesterday’s high at this mornings low. The retracement was stomach churning but given the current upward momentum not wholly unexpected even if uncomfortable.
As of the time of this writing (26 Feb’15 12:22 EST) we have started on W-3 down. It’s been hesitant but will hopefully pick up speed.
Can you confirm or contradict? Don’t mind which, just useful to gain alternative perspectives.
Hi Purvez, Thank you for comparing notes 🙂 My SPX count (based on daily charts) also indicates W5 in progress, a 5 wave count from 1980. Not sure if SPX could reach as high as 2,150 before any significant correction.
I think SPX is currently showing a bearish wedge pattern. A break of the lower trend line at 1850 would signal a larger corrections. Maybe that lower trend line will be broken later in March? Just an optimistic guess 🙂
Oh gosh we are extreme ends of the spectrum here. Yes I too see the wedge and I think after this ‘down up’ pattern we should get that bigger correction.
My hope for this down is anywhere near 2050 but right now that looks like on the other side of the Atlantic. Lol.
I could be totally wrong
but i keep thinking that Nicolas isn’t a troll
to me, his postings seem to be those of a very sharp student of the markets with a very wry sense of humor
his posts make me laugh – almost hysterically at times
i mean, really, the central banks have made such a mockery of the “markets” that you have to just laugh at it all
just my two grains
Hmmmmm……it’s not hard to regurgitate! All of the things he posts are on MSM ad infinitum.
ok, but the timing of the posts is so blatent
it’s hard for me to believe that they are genuine
This will interesting. The PPT needs to keep AAPL from selling off, oil/energy’financial from breaking down, and the dollar from breaking up. Can it all be achieved by slamming VIX down?
NAIIAM AT 99.2%…All in. Wow!
Take more more more profits today!
I am a member of the Delta Society Stock division and would like to talk/correspond with other members, particularly regarding the synergy of T Theory and Delta. If youre in the US, feel free to call me any afternoon or evening at 512-897-7961.
Outside the US, you can email me at vlaw@oplink.net
Nick V.
Anyone seen Robert lately?
Cont’ my conversation with purvez…. My counts so far have been validated. Right now Nasdaq is just a breath away from 5000, so I expect the 5000 point will be touched early in the AM tomorrow. What I would also like to see if a (strong) reversal before close, which will signal a start of the cycle low correction.
At the same time, hopefully gold will bounce from his current cycle low, and continue doing so in the next 5-10 days while the equity markets have their own corrections.
It is purely a guess based on my cycle count. Will not be surprised if I’d be wrong, but I believe that the top is very very close now.
Hmmm erick. I’m expecting the Wednesday high on the DJIA to hold. Ideally on the S&P500 too but not critical. So my short term view is that the decline has started and we’ll go down for the next 5-10 days as you say. As long as we stay above 17890ish (top of W-1) on the DJIA then we’ll end up with one final wave higher. I suspect that’s when you get your Nasdaq touch.
I too find myself as often wrong as right so we’ll see. Thx for the update.
I read John’s site because many of
the views are a little different to those
that can be readily found elsewhere.
I may not agree with them, however it
helps challenge my own bias.
However, I think what now appears to be
a continual discussion of Nicholas’s views is
beginning to detract from the comments section.
Believing in CB omnipotence is an absolute –
there is no debate because that position will
not change (until the business cycle turns).
Plenty of people hold that view, long is
usually the winning trade in a bull market.
You can’t debate an absolute folks.
+1 Phil
I looked this morning at some of the current
valuations on my favourite stocks.
On RB. you now pay approx. 24x forward
earnings, with very modest current growth and
a yield well below 3%.
I repeat what I said last week. In three months we are currently up 30 pts on the SPX amdover that time you have been exposed to what I perceive as the greatest finacial risk in perhaps the last 150 years.
Smarti nvesting or just plain STUPID?
Phil not directed at you BTW
We are in no different a position today at Nasdaq 5k as we were back in 2000. Overvalued……..way overvalued! Only this time around it is much broader and covers pretty much evey sector.
If I hear one more person tell me that FB,TWTR,NFLX etc etc valuations are justified I will slit my wrists lol
Whilst I agree wholeheartedly with you Allan, the topping process seems endless, and I do fear it could drag on for a large part of 2015, before we can all say ‘game on’ for the bear that follows. And it could be a very short sharp bear, before $50 trillion is created by the CBs to (nominally) reflate asset markets.
Whilst this is miserable for many of us for a variety of reasons, the one point of solace for me is the opportunity to keep acquiring the hard stuff at low prices.
The Chinese say ‘may you be blessed by living in interesting times’.
I reply ‘no thanks, give me the 80s and 90s again’.
Sadly, never again, so much crap to unfold in the next few decades.
I will not tell you that FB, TWTR and NFLX valuations are justified.
But I can tell you something else about them – none of them even existed in 2000. So you cannot reasonably suggest that Nasdaq is no different this time.
The number of internet users has grown by more than 800% since 2000.
2000 was the dream; now is the reality.
That doesn’t mean that tech stock prices must necessarily keep rising, but it is not realistic to say that the position today is no different.
Mark, different cast same show. My point is that we are in many cases just as overvalued and possibly more overvalued today than in 2000.
Owned GE in the 90s and sold GE in 2000 at $59.66. How sweet . It is now $26. Over value? Should I sell?
Depends on how I ask. Paul Tudor would say not yet. Why? his sell rule is to sell issues above both 25 and 200 SMA.
I do feel I may have missed the chance to go long dax. It does seem overbought but keeps on chugging higher. I do hope inflation starts picking up fast so central banks start to really think about controlling their QE and ZIRP programs. I can’t wait to see the final outcome of this experiment however long down the road it may be!
Krish, I am shuddering at the thought of the final outcome. I would happily go to Mars to avoid the misery that the unsuspecting 90% of the worlds population is going to have to go through when this implodes.
My point was: anyone who has strong market belief not consistent with the market trend (reality) probably can’t make a profitable trade on an on-going basis that a speculator must do to make money. I would not have bought GE at less than the current price if I had contempt for the market and always think crash and burn very soon.
Trades based on what one thinks SHOULD happen regardless of the reality can be devastating.
Newt, I for one didn’t understand your earlier comment about GE, in particular your question about should you sell. I thought you said you had already sold in 2000 so unless you’ve bought some more I couldn’t understand the question in the context of the comment.
Regarding trading based on what one believes ‘should’ happen…..then I have to say I can’t think of ANY OTHER way TO TRADE. I certainly wouldn’t think ah the market’s going up so I’ll short it.
Of course your opinion of what the market ‘should do next’ is based on market analysis whether technical or fundamental. Once you’ve arrived at your opinion about the market’s next move then you should to trade it. If you are wrong then you get out.
Sorry to belabour the point but I’m not understanding what you are trying to say here. If you are saying that having an opinion about market direction should be used as an excuse for inaction then I’m wholly with you.
The reason I’m responding is because you clearly believe you have a strong point to make and my 2 brain cells aren’t understanding so please elaborate.
The ‘other’ reason I’m responding is because there is an hour to kill before ‘drinks time’. Lol.
**should not be used as an excuse for inaction.
For those following my past comments regarding gold miners, the latest update is next week should likely hold the moment of truth. Early this week GDX held above the pivotal $20 support and for any continuing bullish scenario to occur it had to start making a move by the end of this week latest. Today it hit the top ($21.50) resistance downtrend channel in place since the Jan 21 top and bounced off it. Gold also briefly went above $1520 and also bounced off it.
The key here is that it is okay for a slight decline in the next couple of days say even to the $20.65-20.85 level for GDX. If after doing this and it then rallies back above $21 again and stays there then that would be the genuine break out. I have listed either Mar 3 or 5 as leading candidates if this were to occur.
Anything funny like a move below $20.50 (breaking 50d-MA) implies it is stuck in the channel for a while longer. This would delay the cycle too long to support a near term bullish scenario. GLTA.
“Gold also briefly went above $1520 and also bounced off it.”
Typo … meant $1220!
Thanks much Steve. Great analysis! Great call!. I am holding miners as well. Agreed that the swing this week is real.
I don’t speculate, I invest. This market is ridiculously overvalued and has no idea how to price risk. We will look back on this period in much the same way as we look back on the dot com bubble and 1929.
This is the mistake you are making Allan. In 1929 and 2000, the FED and other central banks weren’t buying stocks and bonds. It’s tough for the market to go down when rates are negative in many countries and when central banks are buying trillions of dollars of assets. Well, I guess you will learn the hard way, once again.
Nicolas has a point: Price is the only thing that matters. (There’s a reason fundamentals are referred to by some as funny-mentals.)
Chris Ciovacco has a purely price oriented way of analyzing the markets and makes “investment” decisions based on what the charts (price) is telling us.
I can understand stepping aside and waiting for the market to top, as long as you’re okay with being on the sidelines for another year or more. (Not saying that that will happen, just that it CAN happen). And as long as you’re okay with seeing SPX hit 2500 or 2900 or 3000. Again, I don’t know whether it will or not. It may have already topped. But until price gives us more clues that the top is in, we can’t call a top just yet.
+1 Barry
+1 Specie
Oops clicked on the wrong ‘Reply’ link. …..ah well you guys know what I mean.
Hi all ! I still see to many posts discussing fundamentals like PE ratios, earnings, growth prospects and so on. As I said before, all this is totally useless now. We should all go back to discussing what actually has an impact on the markets, ie central banks. Do you think the Bank of Canada will soon implement a QE program ? What about the Bank of England ?
Honestly, I’m glad to be living in this era of central banks omnipotence. It’s a lot easier to analyse and I don’t need to waste time going through earnings reports.
On a different note, i look forward to uncorking my Dom Perignon next week. The NASDAQ will undoubtedly touch 5000 points.
Well, at least we’ve reached the “undoubtedly” stage….. 😉
I know Specie is smiling right about now…. 🙂
And Phil, you made a good (and fair) point earlier…
I’ll be strong… 😉
It really doesn’t get much more obvious than this
It is funny though.
Valuations to infinity!…………oh wait a sec ………triple infinity!
barry, i didn’t see you’re post man
unbelievable
you are so right on
Barry posted that right as i was typing
Hope you all have a really great weekend
Nicolas. Love your posts and your sense of humor. lol. I had a kick out of them. I hope you’ll uncork your Dom Perignon over the weekend. Enjoy them! 🙂 Otherwise you might need to wait for a while to do so.
Andre, could it be?……Nicola
Nicola2910,
Update tomorrow.
André
It’s too early to label that Chicago PMI
figure as a definitive turning point in the US macro
outlook, however the next read will be interesting.
I think it’s fair to comment that multiple data points
have come in weaker than expectations of late.
Now that does not mean the US cycle is about
to roll over, it’s too early to make anywhere near
that assumption at this point.
This may just point to a “new normal” of slower
growth rather than the economy rolling over in to recession.
However if data continues to weaken then the case for
a 2015 final bull market top becomes considerably stronger –
the reverse also applies.
If you what an interesting take from a bearish viewpoint
then read Crispin Odey’s recent comments which were
widely reported in the UK financial press.
John S, you may have seen it already, however February posted a record in terms of corporate buybacks at $96b…..the binge not only continues but accelerates.
Sorry John H…….fat fingers 😉
Thanks
Steve T, interesting earlier comment on
where we are in the cycle re 1999.
So a possible continuation in to 2016,
it is worthwhile to keep this in mind.
It’s not my favoured scenario but the macro
will determine the outcome.
If SPX PE10 can reach 43X in 2000, why can it do the same plus more again? We are dealing with human nature here folks!
One can bash Mrs. Market all the time but she can care less. Price pays.
How about a scenario in which Mrs. market presents a mild correction and follow up immediately with a parabolic to make fun of all the market haters?
Keep an open mind.
Newt, the answer is, it is possible.
I thought we may get a mild pullback before
a final high late Summer early Autumn.
A short term decline starting now
would fit nicely.
The DAX now looks to be in to a parabolic
phase and multiple markets could follow.
Or Friday could have marked the ultimate high(unlikely)
and that is the fascinating aspect of markets,
they continually surprise.
Quote from Laurel at Nightscalper.com:
“Fifth year are year of “ascension” and since 1789 there has only been one fifth year that didn’t produce gain. Harmonic convergence of 90 year, 60 year, and 30 year cycles all point to double digit gain in 2015 as US stock market produced 30% in 1925, 26% in 1955, and 26% in 1985. If the cash S&P 500 replicates this in 2015 it will surpass 2600 mark in next 10 months.”
Quote from Permabear Doomster on McVerry Report:
“It was unquestionably one of the strongest months for world equities in some years. We have a number of indexes breaking new historic highs (Dow, DAX, FTSE). Even the basket-case economies of Greece and Spain saw powerful net monthly gains.
With the ECB QE-pomo train set to arrive in the EU this March… there is the threat of accelerated upside. All that seems to be missing is some strength in commodity prices.
Most world markets look set for broad upside for another two years. If we see a bubble peak in 2017, we could be looking at Dow 35/40k, DAX 20k, FTSE 12/14K, and Shanghai Comp’ of 10/12k.
I realise those will be considered as ‘crazy talk’ by many, but then.. the central banks seem 100% intent on ramping asset prices for the foreseeable future. Indeed, the ECB have already stated that the QE-pomo program will last at least to Sept’2016.”
Perhaps Nicolas is correct, this time central bank influence may trump economic factors.
Interesting…for those of us who don’t know, who is McVerry?
It’s just an aggregation site of stock market blogs
http://mcverryreport.com/
Thanks all, new post is out