

Comparing the 2000, 2007 and 2011 peaks to 2014-15.
Taking 2000 first, as that was the last solar maximum pre-2014 and therefore the most relevant, I’m using several measures that stretch back that far and show divergences pre-peak, namely Nasdaq breadth, 10 year treasury yields, cyclical to defensive sector performance and all set against the Dow Jones World stock index. Clear topping process progression and timings are labelled on the chart:

Source: Stockcharts
Now here is 2014-2015. Amazingly it is almost identical in progression and timings in both the stock index and the indicators.
 The only difference is that the July/Sept peaks in 2014 exceeded the solar maximum peak in nominal terms whilst in 2000 they were lower peaks.
Here are the 2007 and 2011 peaks to complete the comparison. No solar maximum in these two years, but otherwise a similar topping process with leading divergences in the indicators and a notable peak in July every time.

 With margin debt for December finally released here is the picture for net investor credit:
Source: Doug Short
We see another leading indicator for the 2000, 2007 and 2011 peaks, varying from 2 to 6 months on the monthly SP500. Currently we have a 4 month divergence versus the December 2014 existing SP500 monthly high, fitting in the historic range.
Lastly if we compare stocks:treasuries and stocks:dollar, we see additional leading indicators in a relative defensive shift with 0 to 3 month lead time for the 2000, 2007 and 2011 peaks.
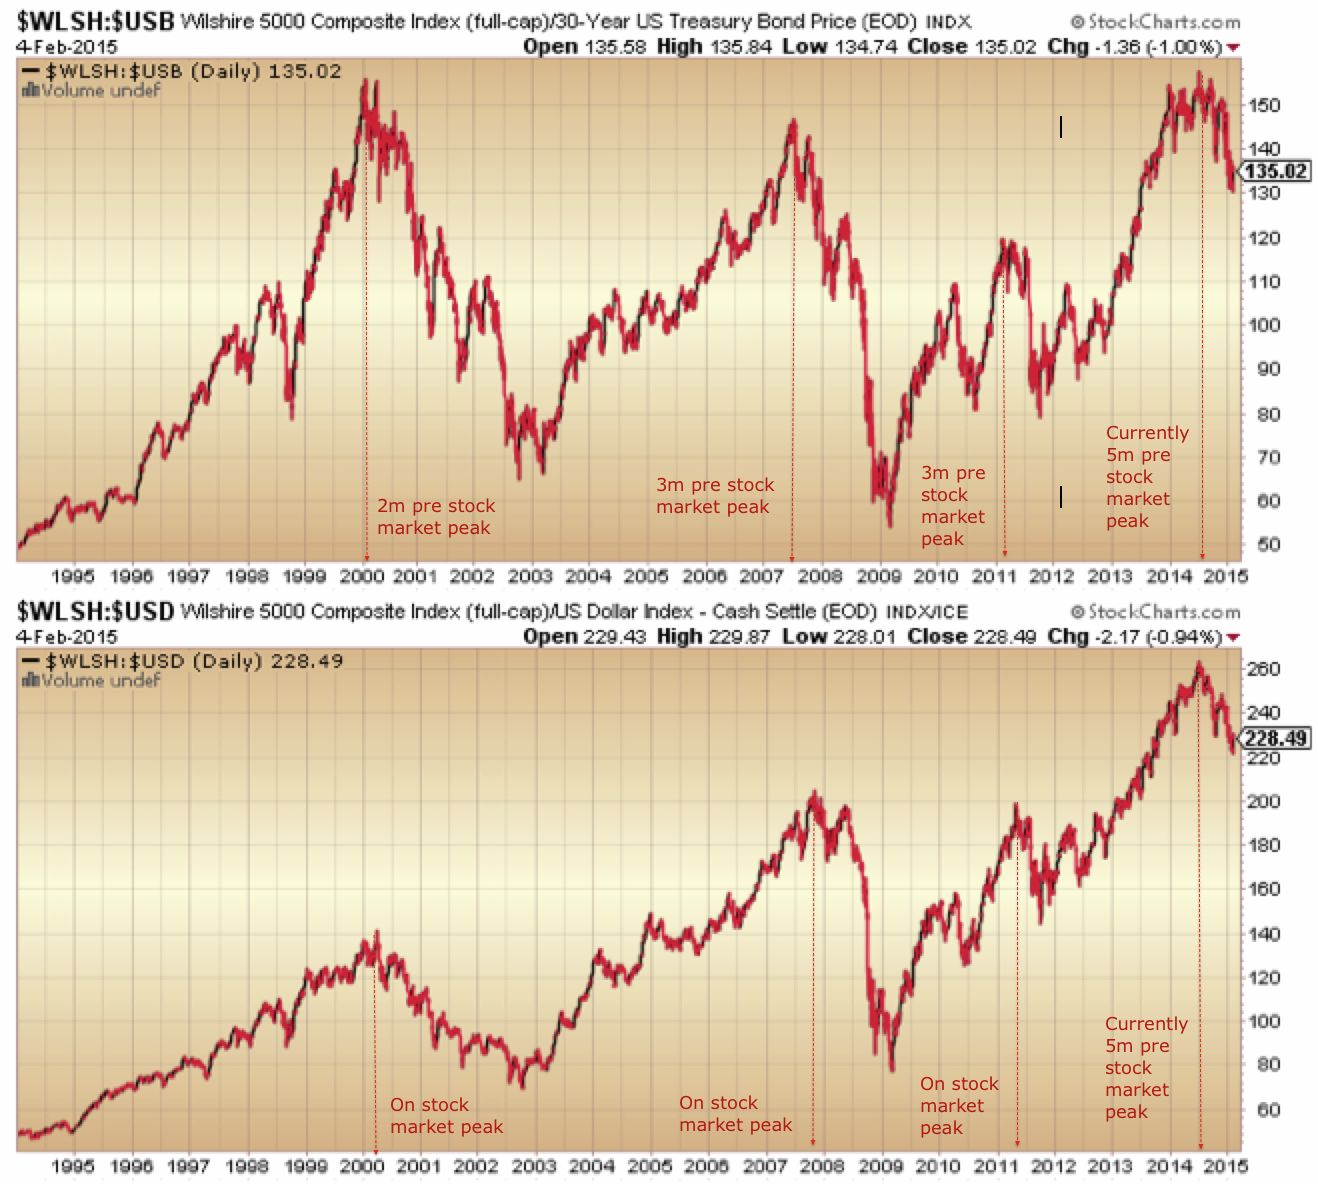
Both measures show a 5 month divergence on our current December 2014 Wilshire 5K high. Yet both measures tie in exactly with when the Dow Jones World made its peak-to-date, July 2014.
All this strongly suggests the ‘real’ peak in stocks occurred back in July 2014. So how can we square fresh nominal highs in European indices and several US stock indices challenging for new all-time highs again? We can square it if European indices are making a final blow-off top and if US indices fail to make new highs here. Back in 2001 the DJW index turned down again at the start of February, heading for Mar/Apr lows, and that fits with the geomagnetic seasonal roadmap that I have presented before. It really means stocks must be repelled back down here, whilst gold ought to break upwards from its consolidation of the last 2 weeks. Drawing together time and price factors I suggest we have just a few trading days for this to transpire. As per my last post, if price and indicators start instead to break upwards then the picture changes and breaks with the logical case.

The market doesn’t live in the past. Historical patterns may rhyme or not. If they are repeated sometimes it’s beacuse psychology of participants doesn’t change that much. But the most important truth about the past is that it has been made from New and Unexpectable.
History repeats over and over and over. It is because of human nature, it is very evident.
Always fascinating to see a first comment basically trolling the post’s content (with zero evidence to back the comment), why bother, what does that say about one’s personality? Perhaps consider visiting other blogs that ascribe to theories of randomness and nothing else.
Been here for years, never posted the first comment so far (If I remember correctly) so I am happy that you are fascinated by it. I don’t know what evidence you have in mind? Have you ever considered that I may think independently? I don’t subscribe to perma fools like Hussman, sorry.
I have an example for you : ‘Miracle in the Andes’. The pilots start panically to lift the plane up when they see a steep mountain dead ahead. Pilots with history, experience and data in their heads and on the screen in front of them. While the young sportsmen on board who know nothing about planes and flying over the Andes, stare into the windows long before the crash, asking themselves : should we be flying so close to the montains? Blind reliance on history vs Open mind : 0:1.
Further in the book, those who refused to eat human flesh for religious or moral reasons, died of starvation. Those who remained open minded, survived. Then, at the final attempt of escape, they chose a much longer route to the West, for one of dying pilots had kept saying ‘We passed Curico, we passed Curico….’ which had confused them. While one of the survivors could swear at some point that he saw a road in the valley to the East! Voices of dying pilots, who were wrong about the direction, therefore were wrong about whereabouts, could cost them lives, beacause the eascape, after two months of hunger and cold, had maybe 50% probability of success. 3 examples in one book that respecting history and old rules led to death, while open mind, youth and creativity meant life. Today it’s all history, those uncharted peaks have names, planes navigate differently, and eating human flesh to survive wouldn’t cause so much international outrage. But it doesn’t mean that New doesn’t exist!
By The way, you should be content that some brave folks challenge history from time to time. 1000 years ago, you could be burnt at the stake for being bearish, for ‘all stocks shall point to Heaven’ or something like that.
Two brief points (brevity, something you should consider too).
One, if you consider Hussman a fool, that tells me much about you.
Two, there is ample evidence that history repeats, in respect of markets, and also in other areas too.
You stated that isn’t the case, so whilst John posts a tonne of evidence to back his (and my) view, you appear to just feel stating otherwise, without evidence, is making a good case. Do feel free to provide your evidence, of everything being new and random, I’ll look forward to reading it.
Sorry, but I would suggest the strength of your case is in inverse proportion to the number of words you type.
Good luck though, time will reveal all.
906. Thank you for your posts. They are truly inspiring! Keep up the posts as you are on to something.
Windbag!
There is merit in despe’s comments here and previous. Last year was a lesson in historic ranges being blown away and there is a question mark over whether all the old rules are still working like they did. However, without leading indicators, historical rhymes, ranges and reversion to mean, we can’t trade the markets. It’s not enough to say just follow price, because following price is still predicting a trend will continue based on such angles. Plus various indices have been in ranges for 12 months, no trend, how are you going to price-follow that? You can’t trade the markets without predicting the future, regardless of your timescale, and you can only predict the future based on extrapolating the past to some degree. I try to mitigate anomalies by drawing together as many angles and indicators as possible. I just don’t believe we have a new normal here in which ALL the angles and indicators no longer work.
long-time reader, never posted before. excellent explanation here John! appreciate all of your work.
Thanks
John, I believe you are right in your summary. Whilst there has been GREAT DISTORTION due to CBs QE programs we can’t suddenly throw EVERYTHING out in one go.
Thanks as always for your very level headed approach and I do believe it is worth keeping in mind that there are ‘new’ boundaries being drawn as Despe suggests.
But (according to Hussman’s research, as well as your own) we’re just in (yet) another mega-bubble, like 1929 and 2000. So nothing new under the sun. Dutch tulips, South Sea, all the same story, all end the same way, according to nature’s laws.
Me, I will be buying 13 1oz gold lunars on Monday morning, after today’s very nice little ‘sale’.
I am not claming that history doesn’t matter or should be discarded. All my setups are based on historical price behaviour, all markets environments recorded in my mind belong to the past. So I would say that 30% of my capabilities comes from history which is duly stored in the back of my head.
But knowing for example that ‘trader must trade in a calm state of mind’ is not enough, being aware of it – is not enough either (it’s all history which must be stored somewhere for reference). Trading ability relies on making sure we trade in a calm state of mind without need to control it or paying attention to it at all. Trading belongs to the Present. The most important aspect is to recognize the present market conditions. If I see something I know, I treat it as such, if I don’t, it’s something new. For example last Wednesday, the price tone changed in an instant, it was something new, not belonging to the lazy intraday past – of course the idea that ‘market conditions may change at any time’ is an historical observation, but being able to recognize a change belongs to the present, although the new conditions may be perfectly in line with some past.
Well, trading is predicting the future to some degree, I mean, extrapolating the present based on known history is to predict the market’s nex move. But I don’t believe in long term forecasts, like years ahead, with precise dates of highs and lows. So if I follow the price and know from history that 1)trend should continue 2)range should continue 3) rather than reverse, I treat ranges as ranges and trends as trends. There are techniques to trade ranges : the price bounces off the boundries and forms waves in between 🙂
I remember that in the past you were focused on the present conditions more than lately, I don’t know why, maybe because you have added in the meantime new elements, or you just were right for too long. Personally, I am spooked when I get 4 entries to 1 pip in a row.
That’s the classic “This time is different” thinking… I’ve watched fool after fool think so, only to later learn that they were wrong. Would I expect it to be any different this time? lol
Loin de là, the history is no different this time : the market climbs the wall of fear and worry, crushing permabears along the way.
Sentiment is not a reliable indicator. It is a dependent variable. And that was clearly proven in 2008 when it buried bulls in the collapse. There were no rallies and no stopping the decline. When there is this much leverage in the system, and so many synthetic bets, when financial markets of today start to unwind, that will continue until that unwinding is complete. Sentiment can go off the charts into negative terroritory without any expectation of a rally. That’s because unwinding the mass leverage in the system is a recursive process that continues until the unwinding is complete. Additionally, the market does not climb a wall of worry either. That’s also a myth of people who don’t understand monetary economics. It climbs a wall of expansion of the money supply.
What exactly does record leverage, record borrowing to buy financial assets, record free money to reflate financial assets, record ability to manufacture synthetic money, record derivatives leverage and record unregulated capital flows tell you about the mythical wall of worry? What does $5 trillion in company stock buybacks tell you about the wall of worry? Do you actually think anyone is worried with this much speculation in markets? This expansion will continue until we start to have some type of liquidity shocks that forces some of your mythical wall of worry to unwind.
This cycle is not like past cycles. In normal capitalist business cycles the expansion and contraction of credit was generally driven by the quantity of money created by investment. The Fed raises rates and companies slow down production because of increased monetary costs, etc. Slowing production eases monetary growth, leads to job cuts, etc. That slowing in monetary growth cuts the supply of money into financially traded assets. Maybe even causing liquidation of some financial assets for various economic reasons.
Does any of that happen today? Money is created either synthetically or through various debt instruments, including Treasuries and borrowed currencies used as collateral, and poured directly into assets. You had better wake up. History may only rhyme but to call Hussman a fool is to show your own level of severe ignorance. When this system fails, it is likely to fail permanently. In other words, no more capital markets because capitalism could very well be in its final stages of failure.
Thanks John for the insightful analysis. Yes, this is very logical, it just doesn’t want to happen so far!
Richard Duncan who tracks global liquidity says that “ECB QE Will Drive European Stock Markets Higher”. So perhaps this will be the blow off top for them.
It may all be over today.
The UKX now about 1% from an new ATH,
crude up this AM.
Over to the US shortly to see if the breakthroughs
happen.
But down the past few days Phil, so not so fast 😉
It could very well fail (for the final time?) at that level.
Purely from an EW perspective I can see the following happening:
https://www.tradingview.com/x/hLKal4vM/
Lindsay’s three peaks purvez?
http://thepatternsite.com/3peaksdome.html
Yes darlord, that’s what it would morph into…IF it goes as I suggest.
Fair warning my call of late have been waaay off though.
Watching USD/JPY to break / lose 117.00 and we can stick a fork in this thing as per Johns outline.
Can’t be more than another day er tow max.
If NFP payroll comes in strong we can conclude beyond all doubt that the whole BLS is a complete and utter scam.
Oil indistry job losses are escalating rapidly, not to mention the flow on effects.
This will be very interesting!
Bridge anyone……..bridge for sale!
Allan,
I am hearing 3 to 5K jobs lost per week in the gas & oil industry. Not sure if this is accurate or not but may trigger higher losses in defaults
For those George Lindsay fan –Three Peaks and a Domed House. Carl Futia wrote an analysis that put the DJI top at 18,800 by late April and then an ugly turn below 15,000. He sees a 30-40% decline in a year.
http://carlfutia.blogspot.com/2015/02/lindsay-update.html
I would be totally excited if and when down-leg, focusing on the internals of the market.
Waiting to see a new high with weak breadth indicators to sell my SPX 1,450.
IWM fits the pattern better, but I can’t quite figure out whether we are at 21 or 23…
Wow, what a tremendous job report. The US economy is really firing on all cylinders. Futures up, gold down 25$, wow ! Everything is perfect for my strategy.
Have a nice day.
Now Nicolas that is a little too obvious, still funny though.
Your strategy is to ignore reality and participate in this irrationality. Well done its working for you. But remember everything always returns to reality and hope you aren’t in your longs when it does. It might be tomorrow or maybe in 3 years but i bet it will happen when Nicolas leasts expects it.
Well, this is where we don’t agree. To me it’s perfectly rational to buy stocks now, when bond yields are incredibly low, even negative, and when central banks are buying trillions of $$$ of assets. As I said, to me this market is very easy.
So tremendous, and yet down we go old chap.
No more buyers, simple.
This however has me really scratching my head and ponderimg where in hell we are going:
“Philadelphia Fed President Charles Plosser, who is not a voting member of the Fed’s policy committee and will step down this year, said the Fed needs to figure out a way to transition from the word “patient.” Beginning in December, the Fed has said it will be patient with raising rates, with the market looking for the central bank to drop the word as a sign it is ready to move”
Are we REALLY at a point in time when the additiin or removal of a single word could have such a profound effect upon how markets may or may not react?,!!!
This has to be a joke??
I mean seriously. I can just visualise all the Fed members revving each other up to see who can make the most absurd statement to the media that will actually get accepted.
They will all be sitting around at the next board meeting laughing their heads off about “Plossers” statement wondering if anyone can actually out do it!
This has now entered the realms of Alice in Wonderland!
And markets are supposed to be sophisticated……I present exhibit “A”.
I think I know what exhibit “B” will be 🙂
GM, there is huge resistance on the UKX around
these levels, on an inflation adjusted basis the index
is significantly below levels first hit approx 15 years ago.
It’s performance against just about any other asset class over
that timeframe has been utterly woeful.
Wish I had the nuggets to buy some jnug here. Still worried about copper price and continued commodity deflation and lack of global demand.
Unless Apple anounces the release of a solid gold iPhone…
second chance almost completed…
$/Y agrees – 3rd lower high
$/Y may be forming a triangle which would be consistent with SPX pattern that Purvez has shown (strong down move next week until final run higher).
Yes JB, volitility diverging somewhat and 60min chart clearly in a risng wedge and right at the apex that mus either break higher or break down and if the later it will head quckly back to test Mondays amd Decembers floor …….and that IMO will be the death knell.
Three strikes you’re out rule!
Appreciate your comment yesterday and today….
I’m thinking your timing is dead-on… ~Well done~, JB….
Labor disputes and strikes are making the news more often. I think the 99% are waking up. Now watch the politicians jockey for position to support Joe the plumber/voter.
IEI:HYG has been rising steadily above the 10 MA weekly since July 204. No more. It is printing a big red candle and below the 10 MA weekly. Credit is calming down and should support the bulls’ quest for an all time high.
Excellent post John, you really lay out a detailed summary of why there may be a few lean years. This time it may be different, i.e. normal patterns of market behavior may not play out but at least the historical precedent is clearly documented. I am medium to long term bullish though based upon longer term cycles that point to much higher prices, tho’ it may be next decade.
This is saying that next week gets hairy.
Barry just caught your post from yesterday. Good buying buddy. I have added this mornng and will add on strength early next week also if that be the case.
http://stockcharts.com/h-sc/ui?s=$VIX&p=D&b=5&g=0&id=p53737642675
Awesome, Allan… We got exactly that $2.75 opportunity late this morning…. 🙂
It was quick, but I got another slug at $2.77… BOO-yahhhh…
Considering my 2nd layer of scale-up sells completed as of this AM….
Well done to you too, sir… Now, we be patient…
Allan, Barry, please may I urge you to consider the possibility of the type of action that I’ve posted as a chart earlier.
An EW triangle is rare and may still morph into something else ….BUT if it remains then it is one of ‘the most’ accurate foretellers of action.
GL to all here.
I have no issues with your chart/projections… I think we’ll get a bigger 1st drop than you have drawn, but we’ll all have a better idea what the market action looks like when we get there…
You’ll not hear “this is ~the~ top” from me….
~A~ top, yes…. ~The~ top, no….
Appreciate your thoughts here…
Thx Barry for responding
The Dow has spent 3-4 months between 17,000 and 18,000, The S&P 1980 and 2100. We are near the top of those ranges again. Since mid Dec sequentially, the Dow fell 900 pts, rallied 1000, fell 800, rallied 650, fell 700, rallied 600, fell 800, and this rally is 900+ so far.
setting up a divergence like October 2007?
mass confusion day – gold down, FX down, oil up, bubble stocks lower
I’m thinking more like mass “opportunity” day… 😉
Machine tool data not feeling it, no year end bump:
http://nftrh.com/2015/02/05/december-machine-tool-data-not-good/
The fat lady is singing as I type.
dow gold ratio rallied 2.5x from the 2011 low – same as from 1933 and 1937 and 1974-76. Min 40% correction due in the ratio – the lower gold goes the more stocks have to correct to achieve a 40% drop in that ratio.
http://www.macrotrends.net/1378/dow-to-gold-ratio-100-year-historical-chart
also important biotech parabola remains broken
Pegasus – i hope you’re right
been watching closely for it but
i’d like to see more weakness before i’d say it’s broken
Chinese internet the other tech leader breaking down – BABA, Baidu – $/Y putting in an E today of declining triangle for 109/108
Happy apogee day! Apogee’s have approx. 65% chance of finishing lower on a net percent gain/loss, and 65% chance of lower prices during next three trade days.
Today is moon is in Libra (Scorpio is next Wed & Thur, oops!). Libra moon is strong and supports price.
Next week looks negative:
Post apogee weakness until Wednesday.
Post equatorial (Libra) lunar to south until next weekend. Most sells offs of substance happen during the post N-S equatorial week.
New moon a ways off.
Retrograde finishing up which is positive but price has already waxed.
Seasonally first three trading days of second week are down.
I have gone short US market mid morning today. This violates my rule of not entering a trade short unless following red candle day. But Lunar factors and seasonals are supportive of this negative short term trade.
Thanks again to John for this excellent forum and to the many successful traders who share their knowledge.
Hey Valley is this your shortened monicker? I saw an earlier post from you but it didn’t sound like you there so I refrained from asking. Please it would help if you decide to change monicker to announce it as I follow you quite intently.
(Oops that sounds like stalking ….but it isn’t) Lol.
Yes, I have changed my posting name to Valley, from Valley of the Moon (which is an interesting region in northern California from which you can see the moon rise over 7 different hills on the same evening). Valley refers to the tendency of price to reach nadir around apogee and when moon is past the equator heading to far south declination. Hey! Today is apogee and the moon on Monday will be past the equator heading south. That is why I am short at the moment even tho’ price isn’t confirming. Imprudent in one sense but if I get stopped out I will have an excellent excuse.
Valley, thanks always for your input. Please announce, in the future, change of your posting name if it happens again.
2/7 15:23 ET
Allan and Barry, you picked excellent timing for a play on volatility. According to my charting the last bottom occurred Jan 26 and following the pattern since mid-Dec 2014 it was supposed to spike +$11/12 (UVXY) from the $23.10 low in the next 6-7TD. It did not quite make $34-35 (top of uptrend channel) and fizzled out at just the 5th TD. Today or Monday was supposed to be the next bottom and I had a target low in UVXY below $25 in a 24.50-24.80 range. Since that hit today I assume this will be the low since it coincides with the 50d-MA which has provided support so far for this year.
If the pattern continues then there is supposed to be a volatility spike next week which implies a significant market sell off. This time the UVXY target should hit the top of the channel in the $35-36 range, which is again +$10/11 from today’s low. The equivalent TVIX upside target would be around $4.
SPX should not exceed 2080 if there is to be any market sell off next week. Let us see how it plays out. I do not think next week is the crash scenario (if a sell off occurs), but merely a set up for deeper more volatile action later in early to mid-March.
I believe SPX is in triangle formation and will retest 1980 again next week. 2065 was not broken in convincing way and reversal is pretty strong.
Thanks Steve for your projections.I am actually looking around similar targets for TVIX but a little higher @ 4.25 initially.
I will buy again Monday morning regardless of strength or weakness and will begin to lighten up once it crosses 4.00 if we get there.
Thanks again
I reviewed TVIX and Dec 17 top 3.52 and Jan 16 top 3.74 and scaling it forward extrapolates a target range of 3.95-4.00 by Feb 13. That would be consistent with resistance at the top of the trading channel going back to early Dec 2014.
However, anything like volatility spike or crash is possible and it breaks out, but as I have said before I think this next week will just be another orderly correction followed by yet another rally after it hits support levels yet again, that is the prelude to set up a much bigger panic sell off in early March.
GL in your trading!
Looks like pullback is occurring as expt, only this time “good news is bad news” and I was expecting “bad news is bad news”.
Market will probably turn back up Mon PM or Tue AM.
https://solarcycles.net/2015/02/04/the-old-rules/#comment-48434
Gold and miners are in a tricky spot. On my weekly chart analysis the action right now is following a symmetrical mirror of the fall in GDX from $27 down to 16.50 (late Aug to early Nov 2014) where it is rising from $17 (late Dec 2014) and is supposed to head back up to $27 possibly (end-Feb or early-Mar).
Right now after peaking Jan 21 it is consolidating in about a $2 range for up to three weeks, mirroring what occurred late Sep to mid-Oct 2014. If so the $21 level give or take is supposed to hold and a breakout to higher level should occur either next week or the week afterwards at the latest.
However, today’s gold action looks like death. I guess one can play it three ways here … buy GDX in low $21’s with a very tight stop just below $21 for best price entry, simply avoid this sector, or avoid/wait for a confirmed breakout above $23 to reduce risk at the sake of giving up $1.50 for peace of mind.
FWIW when you analyze the daily chart (late Sep to mid-Oct 2014) and compare it to Jan 21 to early Feb 2015, the action at this time is definitely more bearish and toppy heads and shoulders like, whereas back in autumn 2014 the consolidation was more of a decline into a bottoming consolidation before resuming the declining trend again. So based on that analysis the betting probably leans towards GDX not breaking out to new highs but this is likely distribution selling at the top from the mini bear rally before the primary downtrend resumes again.
The monthly chart of GLD and GDX say it all. Avoid.
Just a reminder, the GDX miners are a volatile sector with huge up moves and huge down moves over relatively short time frames. A little research I did shows for some incomprehensible reason most the the huge up moves coincide with Venus retrogrades(which last about 6 months), one of which begins this June. This spiky spooky GDX price move could be an attempt to ward off diners before the entree is served. That being said I am not going to touch GDX because I lost too much last time I bought into the GLD as money meme.
I am just trying to say that it is not out of the question that GDX could have a 1 year bull market as the large miners are profitable, have low price to earnings, benefit from lower gas prices and have very little appeal at the moment because of the last 3 years bear market.
Heed to the Swiss gold referendum, roughly 78% voted against expanding central bank gold reserves to 20% of central bank assets from the current 7%.
If this is indicative of a change in generational mind set, gold is toasted and so do gold bugs.
Agreed, with bitcoin et al the public is not interested in the barbarous relic as a monetary unit. Jewelry consumption by China/India middle classes will probably continue as will use of gold and silver in industrial applications and as a back stop for international currency exchanges. Or not, maybe they won’t be used and could collapse to much lower values. I am not buying, just saying that the possibility exists that they could be continued demand and like any tiny market (relative to intl. corporations or intl. currency transactions) there could be a parabolic increase in the values of the GDX for a few months or longer. GDX could triple and still be within price range of a few years ago, tho’ long term I wouldn’t own it because the precious metals mining sector has been the worst investment since the 1980s.
Valley, I guarantee you will kick yourself within a few years that you didn’t buy some physical gold.
The Western investor shares your view, but that won’t stop a dramatic gold revaluation.
Have you heard of ‘Brown’s Bottom’? Do some research, it was when the gold tide turned, as the Euro was launched, and the Chinese joined the BIS and decided to empty out the LBMA of all of its physical gold. (exports figures show this BTW).
On that occasion, the BoE had no option but to bail out the bullion banks by ‘selling’ its own official reserves, although they’d already been long gone via leases.
In the past year, the LBMA system has lost half of its physical gold reserves, from 3,000 tonnes down to 1,500 (info from their own website via Ronan Manly’s blog).
Once the remaining 1,500 goes, we will have a physical gold crunch, and XAU will vanish in a hurry, as delivery is refused. Suddenly, every man and his dog will want gold, but too late.
A new market will be introduced by certain central banks (and the BIS) who have been patiently waiting for this to happen since the launch of the Euro and the Washington Gold Agreement.
I expect physical gold to be priced ar over £10k an ounce once this happens.
So, holding a few coins as a hedge against…everything….may not be a bad idea.
Good luck.
“I wouldn’t own it because the precious metals mining sector has been the worst investment since the 1980s”
…………WHAAAAAAA?
Buy and hold certainly is a loser game with PM’s stocks, but who in hell does that?……..
Buying at the right time( like NOW!) and selling when they have made several hundred percentage point gains makes them about the best investment one can ever make, no make that THE best, if you know when and have the discipline to actually execute it!!!
It take guts……I mean GUTS to buy when noooooooobody wants anything to do with the sector and it takes a helluva lot of discipline to sell when everyone is screaming……….”To da moon Alice, to da moon”
Sometimes I am convinced I am from a different world.
Allan, I made a valid statement PM stocks are have not been a good investment since the 1980’s. The are very difficult to trade successfully from my observation. Any sector that can be up 12% in three days and then down 20% the following four days is not something that I can trade. Since if you make two wrong directional calls you could potentially be off 32% which would require a 50% gain to be even.
Allan, what makes you think that now is the right time to buy GDX. Lots of gold commentators and analysts thought April of 2013 was the right time and I lost 1/2 my equity on this “trade”. It kept falling in value and I waited for the price to rebound because it was so cheap. Whole raft of reasons that this sector is not a sure thing: share dilution (companies have been printing stock certificates to fund operations), gold price could feasibly drop to $800.00 (ABX has some deposits that are extractable at $400 per ounce). I don’t disagree that there is lots of money to be made with GDX if you can market time it but I can’t see any way to do it. None of the patterns that I have discovered apply to it and it seems that it is actively being pulled up and down in a way that makes it the most difficult sector to time. Brent Cook of Explor. Insights thinks the sector won’t shine until later this year or next. My only two cents is Venus retrogrades the next one of which is this June have matched up with the 100 to 200% gains you speak of.
Valley, in principal.
1) Sentiment that reached extremes only ever seen at long term lows
2) A duplication of broad market behaviour seen in 2000 that lead to a major move in PM’s
3) A major economic crisis underway being lead by collapsing currencies that is fueling breakouts in gold in just about every currency on the planet.
4) The recent rise in GDX and gold has been greeted with disbelief and has been given zero respect
And the BIG one……….
5) Gold has been rising not just in all global currencies but also in tandem right alongside the DXY!!!
Hi ! I wanted to congratulate all longs for an excellent week. US markets closed up 3% this week. We also had a very nice down move in Gold. So, all in all no change in the strategy, long stocks and short Gold.
1) Nicholas , for the last 7 times you posted to a peak during the last 9/12 weeks I shorted within 1 hour and made an absolute fortune collectively. ( check post and chart timing they are spot on, within 60 mins) So thanks you are indeed a great signal to short. We all love you here, well when I say WE I mean it was only WE after proving the formula on the 5th post.(yours :))
2) the SPX closed below LDT so interesting week ahead.
3) we’re waiting for the next Niclearse post 🙂
psssst……Aaron….
Lets keep this little back-pocket indicator to ourselves….
We don’t want to wreck it…. 😉 *shaking head here*
I was thinking the same here Barry!! Solid indicators that continue to perform consistently are hard to find. 😉
Bretz 5day TRIN gave SP SELL today. Last sell signal was 9/17/14.
By the way, my lunar chord supported short paid off to the tune of 1% today. The timing was perfect mid morning, it was a hunch with today being apogee and prices being up quite a bit. I would give Mon to Wed of next week a 75% chance of being down each day, Thursday 60%, and Friday 60%. I don’t see anything good about being long next week except if prices get oversold, there might be a rally into the end of the week. Next Friday is low tide of the month which often marks lows exactly.
Excellent analysis John.
I came across an article that talks about the seven year cycle that ends with a shemitah year (2000, 2007,fall of 2014 to fall of 2015), in which there have been two financial crashes. Will it repeat again this shemitah?
It’s worth a read and to keep an eye on the dates. Shemitah ends Sept 13 (sunday) 2015.
http://theeconomiccollapseblog.com/archives/shemitah-biblical-pattern-indicates-financial-collapse-may-coming-2015
For Q1 2015, US earnings growth now forecast at -3.1%, revenue growth at -2.3%
For Q2 2015, earnings growth forecast at -0.4%, revenue growth at -2.6%
ECRI leading indicators for the US now at -4.0% growth
If US equities are net bought against this backdrop it is really beyond belief.
John I agree it is beyond belief but so was every major top in history when looked back upon.
I said last week that China will be the next to devalue their currency and I believe that they will within the month.
Gold has been exploding in every currency aside from USD but has even appreciated against the dollar to some extent.
That is exactly what happened back in 2000 as gold began its first major bull run.
JPY depreciated early 1990, for the first wave down, and then appreciated for years. I wonder why that is, and if China would somehow follow Japan in 1990.
It is beyond belief. But perhaps slow earnings just mean that we can have zero interest a while longer? This is starting to resemble a giant game of chicken.
The inversion I spoke about yesterday played out nicely. Tomorrow I’ll explain why February 11th is so important.
John is right; this is beyond belief. I maintain the orthodox gravitational top was December 7th. Ever since we have seen one huge inversion period. I suspect that the more significant a turn is the longer the inversion takes.
But they don’t last forever. And they build up energy that will be released once the inversion ends.
My understanding is that Wednesday 11 is the big day. and then the first leg is down into March 5.
Tomorrow some more on this.
Do you have a blog?
Not sure what all the fuss is about surrounding gold?
It is back testing the neck line break as well as the 200 dma simultaneously.
http://stockcharts.com/h-sc/ui?s=$GOLD&p=D&b=5&g=0&id=p35551000307
Sorry meant to say 50 dma.
Beautiful picture
The commonly held belief is that the 1929 stock market crash was the commencement of the deglationary collapse of the Great Depression. Wheras the truth is that the stock market collapse was just a symptom of the deflation.
The deflationary collapse was already well underway in Australia before 1929 with unemployment exceeding 10%, due in no small part to declining commodity prices.
We are in a very similar situation today.
I am not a huge fan of the BDI as a leading indicator but when it plummets to multi-decade lows one has to sit up and take notice.
Something is very very wrong with the global economy but easy money masking the problem for now. That will change at any moment and when it does the markets had better look out.
http://stockcharts.com/h-sc/ui?s=$BDI&p=D&b=5&g=0&id=p30760905991
You were right. History says No V bottom in oil recovery. Retest(s) likely.
I sold OIL(an ETN) on Friday for a 19% gain. Thank you.
We are getting close folks, earnings showing signs
of beginning to turn.
For me that was the major missing component in 2014.
The Russell looked to be within about 0.5%
of making a new ATH at one point yesterday
before markets turned mildly lower.
A large fall in Gold this week is not what
I would expect if markets were to imminently
turn significantly lower, Monday will be interesting.
The fall in the baltic index to 28 year lows confirms further weakness ahead, http://rajveersmarketviews.blogspot.in/2015/02/down-goes-baltic-dry-index-yet-again.html
DOW will breach 10K in 2016. Any comments welcome.
Doubt it. Fifth year of decade are where most gains are made. USD strength won’t reverse in near term, which is bullish US markets. Low oil prices reduces transport costs which makes co. more profitable. 2017 might be candidate for 15K as year seven is down year typically.
You seem to be saying Obama will deliver a gain from 9K to 18K in 8 years?I think he will give you at most 1K gain if not flat.
Imo, market much higher this year. Lower into 2017. Then higher 2018 into 2025. I always trade short term trends tho’ so market direction doesn’t matter on longer time frames.
Target 9000 with 2 super long trend lines coming together.
Can you elaborate?
shorted QQQ at 104.05 on Friday, my first short of the year. only a ST trade for now, most likely we pull back towards bottom of consolidation before a spike up to ATHs
https://davinny.wordpress.com/2015/02/07/201527-the-final-lines-of-defense-for-the-bears/
Good trade. I also went short Fri mid morning, looking to go long at end of next week. Seasonally next week Mon, Tues, Wed are weak, and lunar factors (declination, distance, and diameter of illumination) are down. If we do get a substantial sell off, I would not stay short past next Friday.
Stock markets will rally: Big miss on Chinese imports (actual= minus 19.9%, forecast= minus 3.2%), exports also missed (actual= minus 3.3%, forecast= 5.9%).
=> More easing on the way!
Markets were up last weak as expected. Two reasons for this:
1) Gravity was up
2) we were under the spell of the sun-jupiter opposition. This was exact on friday 6 but has a shock window of 4 or 5 days. Usually this aspect is seen as bullish, but Jupiter is retrograde so it marks a top.
Counting 5 days from the 6th we get February 11. The strongest turn days next week will be Monday and Wednesday. So expect a low on monday and a high on Wednesday.
Now the inversion window finally looks ready to close we could look a bit further down the road.
March will be special for a number of reasons :
1) the uranus-pluto square will be exact around 17
2) March 31 we see the sun opposition to the node, creating a moon wobble period that starts 2 weeks before.
3) March 20 will see a combined equinox and total eclipse – in a moon wobble period.
4) Saturn turns retrograde march 10.
This a an explosive mix that should bring a lot of volatility. Not just in financial markets but also in the real world; earth quakes, missing planes and terrorist attacks.
This supports my general outlook : the gravity cycles will be down into 2017 at least. December 7th marked the orthodox top for the multi year bull market. This means we have started a down wave and we are now in the first wave down which will have 5 legs. Wednesday will be the start of a 3rd wave down.
Timing
From different perspectives I have 2 hot zones that will likely mark the turns.
First is march 5. I believe this will be a w3 low. The march volatility could support a volatile w4 consolidation. The second strong date is may 10. So this will be a w5 low and start some recovery into the next equinox/eclipse season.
This will only be the first leg down, but it’s a start.
As we get closer, the timing of W5 down – likely early April – will get transparent.
Cheers,
André
“So expect a low on monday and a high on Wednesday.
Wednesday will be the start of a 3rd wave down”
can you please elaborate some more, is Wed. high or down
The turn on Wednesday will be intraday. I suspect it will be in early trading. Most important is that after Wednesday it is basically down into early may with the first real low on march 5.
Hope this is clear.
Andre.. You are way above my pay grade ,,I will not jink this , I will be a quite little boy , and nod my head in approval . Thank you, and John ..Nicola
For completeness; the move will be down into feb 17, a retrace up into 26 under the impact of the venus-mars conjunction and then down into march 5.
Hello Andre, where can I start to read and learn about effects of gravity, planets etc…effect on stock markets ? Thanks
George,
A lot of books have been written on these subjects. But most of my insights come from my own research.
The general rule is that a strong gravitational pull makes people feel bad and markets should go down. The question is : how to measure gravity. I tested a lot of tidal stations until I decided to build my own gravity indicator. We know where the sun and moon are and what mass they have. If you think logically this is all you need to predict gravity. It took me a while to figure it all out, but maybe I’m slow 😉
Astrology is really searching for correlation of certain aspects and market reaction. One reason I can think of why astrology works is the effect of planets on solar activity.
My personal approach is to look for confirmation. When different techniques all say the same, the signal is stronger.
It took me years to build my system. But once you see it works it’s like magic.
Good luck!
If you call this correctly I will leave the lunar chord and try to figure out your gravity cycle.
I’ll take that as a compliment. No worries; as long as I see my postings are appreciated I will keep posting.
And I am certain this call is correct. It’s not just gravity; I use other techniques to confirm.
Great Work Andre! Does your work tell you the speed of the decline in price or just general direction. I assume if we are down into May then the decline should be more severe than we have seen recently.
BlueStar,
My work gives timing and direction. But logic dictates that when the long term cycle has turned the down moves in general will be larger than the up moves.
Yes Great work …..Andre
Bluestar Andre… My analysis is based on acceleration and very simple. Like Andres analysis, if all are in agreement the stronger the signal. Well this is the same for acceleration. Looking at only one indicator and multiple time-frame, you will notice at OB / OS conditions that price accelerates 90% of the time. When they don’t you only need to look at other time-frames and see that they are not in OB / OS territory. My blog shows when we can possibly accelerate, but it is not a long term analysis. but the same can be done for longer-term strength of acceleration. For example, many did not see the rally from 2012 as a strong accelerative move, but at a longer term looking at the Slow Stochastics, you will find the signal at OB. Hence OB entrance was the signal of the acceleration. Many believe OB / OS conditions are signals that price is about to turn, but it really is the other way around.
http://www.tfaat.blogspot.com
Does anyone have any more thoughts on
the 5th year effect.
I realise this has been mentioned a number
of times recently as a very bullish factor as
per Valley’s post above.
Phil, all I know is that if the US markets fail to make new all-time highs ahead of new lows the “BTFD” trade is all but “dead and buried”
In Dec, 1974, Edson Gould – one of a very few all time mkt timer great – used the coming up 5 year would be bullish. Well, it was correct then and every since. Gann, another great, called the 5th year the year of ascension. However, he has also in a different venue said 2015 would be a year of panic. Until the credit cycle turns, 5% deflation or significant rise in inflation or interest rates, odds favor ascension.
The credit cycle has already turned, John has already pointed that out with some ratio charts, but here’s further evidence:
http://research.stlouisfed.org/fred2/series/BAMLH0A0HYM2/
In Dec, 1974, Edson Gould – one of a very few all time mkt timer great – used the coming up 5 year would be bullish. Well, it was correct then and every since. Gann, another great, called the 5th year the year of ascension. However, he has also in a different venue said 2015 would be a year of panic. Until the credit cycle turns, 5% deflation or significant rise in inflation or interest rates, odds favor ascension.
GM, hope you are right. I use Strategic Investment Timing by Stoken. It is a simple but multifaceted system. Barring something extraordinary, the only eminent sale signal would be 5% deflation. The last report of the PPI was around 3% deflation. Close, and maybe the drop in oil will do it. It would take the next PPI to be -.42. The 1930 sell signal came in Sep, 4 months after the 1930 seconday high from the 1929 crash. So you could be correct that it has already started, but not officially. The low interest rates and low inflation has been good for the mkt, and if no inflation or rise in interest rates, still a bullish outlook (except deflation of 5%).
Kent – Gann’s 2015 “panic”, ie the Minor Lunar Standstill, doesn’t get under way until October 2015 so there’s plenty of time for an intervening price “ascension”.
The lunar standstills are a two-year process (arguably even three years), until the limits of the moon’s declination significantly widen after the minor standstill (or narrow after a major standstill). After the last two standstills, June 2006 and February 1997, it was 16 months in each case before there was any real sign of panic in the stock markets. [a 15-20% drop during August 1998 doesn’t look especially frightening on today’s charts, but was much worse back then] http://www.chartsrus.com/charts.php?image=http://www.sharelynx.com/chartsfixed/USDJIND1990.gif
That would realistically put Gann’s panic window between October 2015 and early 2017.
Thanks, Mark.
Can you explain what Gann panic is? Isn’t he dead for a long time now?
Hi Phil;
Good question!
I would guess that it’s true, as it keeps being repeated without correction, but that said, I’m leery that it’s statistically valid… How many data points are there??
I’d venture a guess that it’s more just a matter of looking through history and noticing a pattern in the (limited) data samples…
I’ve heard the market is “up” year-to-year about 70% of the time (please correct me if that’s not right). So odds are – each year – that the market will be up..
And “Year 5” just happened to be the one year that happened to all be higher…
Could have been any year, just happened to be Year 5.
Regardless, I’m just not sold it’s any more predictive than “the stock market is up 70% of the time”. Which means, there’s a 70% chance we’ll be up this year too…
And the Year 5 thing actually has nothing to do with it…
Just thinking out-loud here…
I’ve never looked at the historical yearly returns, so would be curious if anyone here has looked at each year-ending number in a decade and counted the number of positive/negative returns…
Thanks for the views guys.
i put the year ending in 5 in the same category as super bowl winner
a lot of fun for the talking heads but meaningless
the education system has been a tremendous success
students are taught but fail to learn
Most of the 5 year last century have been at/soon after solar min.. Cause of recent extended solar min has offset the 5 year solar position. At/after solar max could result in Gann’s panic assessment. Picturing 5 year as an equalizer maybe is will be a mark down year to leave room for balance of decade to out perform. Preelection year also outperform which may place a floor under downward price movement.
Good Evening John.
Stop frustrating yourself with the similar analyses of several months ‘married’ to
peak of mid 2014. Yes, the parameters you keep looking at are comparable to 2000,
2007, 2011. The crux of the matter is it is incorrect. The Market has told you that over + over.
May I suggest that you stay married to your present wife and broaden your perspective much larger. Actually you have already hinted at the ability + willingness
to look beyond this century. You had charts of 1980-90’s Nikkei and 11920’s of US Equity markets on Feb 4, 2015 posting. Then you reverted back to mid 2014 peak theory.
Life is too short to be married to analyses / theories that time has proven NOT applicable. May I suggest we all pay attention to what Martin Armstrong has been informing us. He has data base of 5,000 years so he has studied Rogue Waves = cycles that date back to Mesopotamians, Egyptians, Persians, Babylonians, Greeks,
Romans, Byzantines, the Rise + Falls of Empires in the East + West including the India + China + Japan > 2000 years ago and the Portuguese, Spanish, Dutch, French + British + Russian + American Empires. They were all intricately connected to Politics, Economy, Finance , Demographics + most importantly Capital Flows.
We’re experiencing the culmination of not just few decades but > 200 year long
cyclic phenomenon. An average nation lasts 200-300 years. That’s how long the World has been experimenting with Government Interventionism, in ‘modern era’
that began with Rise of USA + French Revolution, etc in latter half of 1700’s.
Cyclically we’re due for a major paradigm shift.
As Mr Martin Armstrong reminds us the Marxism or the ‘Statism’ began in France
in ‘modern era’. Really, it’s been around ~5,000 years or more. Human Nature doesn’t change. Technology changes but not Human Nature.
For last 240-250 years the MASSes have co-opted with deceptive lies of Marxism
that the State knows better the the MASSes. Essentially ‘Statism’ ~ ‘Oligarchy’
~ ‘Elitism’ ~ ‘Cronyism’ are similes that have over the centuries build wealth NOT from diligent hard work of producing necessary goods + services that society needs but manipulate others to do the work for them by maneuvering themselves into ‘power’ positions of influence in politics + banking who ‘manage’ OPM, other people’s hard earned money.
This epochal cycle is in ending phase so the parameters applicable for 3,4, 5, 10, 12, 17, 20, 30, 60, 120 cycles will NOT work. The ‘very bearish Megaphone / Jaws of Death’ formation from 2000-2014 actually turned out to be ‘Jaws of Life’ in which
World’s Capital Flows shifted decisively towards the shores of USA.
Statism disguising as Communism was a cover-up for Soviet + Chinese Elitism whose elites just replaced Czar + Emperor with ‘collective ‘people’s … Super B.S.
communist party committee while confiscating farms, businesses, individual wealth of all kinds so all can ‘share equitably’, the code phrase for ‘we the elites will share what the Masses produce + we confiscate’. We all know ‘Communism’ destroyed
any lasting incentive to produce foods + services bankrupting Soviet Union + China.
Remember 1989.To their credit they at least didn’t pretend people had any individual ‘ownership’.
We, in the West, gloated over how the ‘Capitalism’ has triumphed. Well, that Grand
Illusion is coming to a rather swift accelerating end within next 2-3 years .
That same fateful year of 1989 Japan went down after Nikeii + Real Estate Bubbles, manipulated into place by troika of Ministry of Finance, Banks + Crony ‘Capitalistic’ Businesses cross owned each others’ shares in a Ponzi scheme, collapsed once the Smart Money decided it was time to move on from the inevitable collapse of the ‘House of Cards’.
The Smart Money moved to Europe to ride the Surging Surf of EURO + EU formation, another classic Gov’t Interventionist experiment creating a common currency without common federal Debt like USA. The politicians, dreaming of
reforming the New European Empire resembling powerful Roman Empire to
challenge USA, knew they couldn’t convince the MASSes to vote for US of Europe
if they proposed to convert each member nations debts of different credit quality
into a federal debt, so they just deceived the European MASSes with Euro
+ freedom to travel + work anywhere in EU without passports.
What the politicians conveniently left out has been rearing its ugly face since 2011 when Euro peaked as PIIGS stumbled under the cumulative weight of Sovereign Debt and Smart Money astutely decided to move on over to USA, the last place to flee.
This capital flight is accelerating world wide, from Emerging Markets, including BRICS, with temporary exception of India with newly elected business friendly PM Mr Modi, + commodity producing Australia, Chile, Canada + OPEC + Non OPEC oil producing nations, joined by Europe and China of late.
There is only one last place for Capital to flee to. The USA.
Yes, the same USA that has accumulated $ 17 Trillion in Debt.
That ‘should have crashed’ its Bond + Equity Markets decades ago.
Markets don’t care re: ‘should’s or myopic analyses’
The Fact + Reality is that enormous, ginormous, + humungous unprecedented
debt load of USA is only 8 % of the World’s total debt load of get this $ 223 Trillion !
The MASSes have co-opted for last 240-250 years world wide, especially in
the Euro-Anglican dominated nations, the ‘West’ to live ‘dreamland of’ unending
entitlements from cradle to grave socialism’ punishing the productive with ever increasing taxation while rewarding the nonproductive governments + increasing
bureaucracies + their voters bought by unending entitlements + promise of more
by ‘taxing the rich’.
Most of the world’ debt is denominated in the Reserve Currency U$.
When one borrows one is in stock market parlance ‘shorting’.
Dear John + followers wake up + take a notice. There’s Mt Everest amount of
shorted U$. That is why the US Equity Market can NOT and will NOT crass just yet.
All the Capital that’s fleeing into USA, the Empire with no clothes of own, what is it ? at least 15 % of people on Food Stamps ?, is in effect covering the U$ shorts that’s been outstanding for months, years or even decades.
The Smart Money has already bought the high end Real Estate in Switzerland, London, England + USA to get off the Banking Grid. The loose change they have are flowing into U$ Bonds for now as it’s the ‘safest’ + pays the highest interest rates with Japan, long been paying negative and Europe beginning negative interest rates.
But with rates so low German Equity.
Mr M Armstrong is forecasting + it is more + more evident he is ‘spot on’ week by week and month by month ‘phase transition’ in which prices double in a matter of 12 months or less, in US Treasury Bonds to peak by 2015.75 (Sep 30-Oct 1).
This makes sense a s Greece exits Euro and other PIIgS follow one by one.
Northern Europeans will eventually give up, likely quite rapidly as the dominoes fall and who wants to prop up Basket Case of the Birthplace of Marxism, France.
Sooner or later German MASSes wil get it as will rest of the MASSes in the world in their collective OMG moment that Governments everywhere in the World do NOT know what they have been doing for last 200-300 years at least.
That collective Oh My God moment is forecasted to be 2015.75 when U$ Treasury Bond Bubble gets pricked as people around the world begin to lose confidence
and Capital ( Smart Money ) again deftly move into another asset class,
the US Equity. It is forecasted to at least double in phase transition for 1-2 years.
This is when PM’s likely also begin to rise our of their 4 yr massive correction like phoenix from ~ $ 1000 / $ 700 and really accelerate towards $ 5,000 after 2017 when Equity Market also craters as the confidence in governments’ ability to ‘manage’ the economy + financial markets get totally discredited, avalanched or tsunamied or volcanoed, choose your analogy. The Fed has used all its weapons of manipulations. and Mr Armstrong predicts the Fed will raise interest rates as they get alarmed re: sky rocketing Equity Market which they have set up by delaying
the facing of the reality of impossibility of government entitlements + pensions
even if they do tax the ‘rich’ to the their last pennies.’.
Raising interest rates will add more fuel to the rocketing U$ rally as short covering
takes off towards 157 or exceed 1985 previous record high before the Plaza Accord again artificially manipulated down + drove Capital into Japan to Nikkei + Japanese
Real Estate Bubble of 1985-1989.
Remember Japanese Nuclear planners forgot to plan for once in few centuries tsunami for Sendai Nuclear stations Sea walls.
US Equity will correct likely in sideways churning for several months as U$ Treasury Bond Bubble gets bigger + bigger and siphon some money out, likely the weak hands.
Again + again Market makes biggest moves when the majority is stacked in the extreme end of recent trend. ‘Majority must be wrong; is a must precondition for a major move to occur. Like sufficient kindling wood has to be gathered before a tiny spark can ignite into a raging forest fire.
I think you have noticed one ‘sticking out like a sore thumb’ measure’ of lowest
retail participation in US Equity in well over a decade. High participation by the ‘Dumb Money’ is a precondition for any major top like NINA (no income + no assets mortgages at US Housing peak. During Dot Com Bubble peak the inmates in the
prisons across the USA were buying into Tech companies with hairstylists + newspaper boys + girls having bought them jut before them.
This is one glaring piece of historically hard evidence of every financial bubble
from Tulip Bubble, South Sea Bubble, SiIver + Gold Bubbles of 1970’s->1980, etc, etc that is ignored / downplayed missing in your + many other analysts whose analyses are while quite extensive but neglect the key facto , the capital flows,
which is the real fuel / money that drives any economic or financial major trend.
Be better informed to survive + come out on top of upcoming tsunami waves
and not be pummelled down by dangerous under tows or currents that will down.
Learn from Deep History. Your work is quite good but you are NOT considering the alternative scenarios lot more seriously enough.
The worst enemy of Better is Good .It’s not good enough to be Good if one wants
to be a better analyst in times like we are all going through presently.
Tectonic shifts are happening.
The worst enemy of Best is Better. You are one of the better analysts.
However I’ve studied Financial Markets since 1987 Crash and noon comes close to Mr Armstrong’s data base + all encompassing analyses and forecasts + track record.
It behooves all of us to listen to this dedicated veteran analyst, a Real Student of History. He has a free blog like yours. IT will be eye opening and worthwhile investment of time + reflection. We all can learn from someone else.
I do appreciate your work + generous sharing.
Learner
“However I’ve studied Financial Markets since 1987 Crash and noon comes close to Mr Armstrong’s data base + all encompassing analyses and forecasts + track record.”
Martin Armstrong has been consistently wrong. I have followed him since the mid 90’s.
If you care to debate it I am more than willing.
Let’s begin with his calls in 99 for $5k gold within a few years and his call for higer interest rates by 2013!
Let’s add to that, that in 2011 Mr Armstrong was talking the possibility of a parabolic move in gold to $5K yet again!!
How many people did he push into gold right at the top with taht analysis???
Then he did a backflip and now has the hide to call gold bug(which I am not), every name under the Sun.
Now right when he should be advising investors to get into gold he is once again scaring the crap out of people so they won’t go near it.
Yeah he’s great!
Let’s also add that Mr Armstrong has been calling for “phase transition” and 23k DOW.
We’ll see how he goes with that call?
Mr M Armstrong usually gives the parameters with bullish + bearish reversals on monthly, weekly or daily basis to tell you which way market is moving.
He will write e.g. ‘ electing this bullish reversal warns of further advance.’
I ‘ve only noted one glaring error when he made a definitive statement during
mid 2013 when PM’s were crashing, ‘today, Gold will make a new low < …'
'I foolishly took a large position believing that.' That's about the only time that he went out on a limb + was definitive. Market didn't.
It is my responsibility for making a decision to take a large position + not put in stops
in place.
I doubt that he definitively said Gold will to 5K in 1999./ 2011. He would have given you the parameters 'if elected ' will point to certain target(s) by such + such time targets.
I find him brilliant + quite informative.
tblb2012 (Learner),
I appreciate your view. Can I ask you questions?
1. Is it not possible that as MA mentioned Sep 30, 2015 could be the TOP of US Equity?
2. My guess is once US equity peaks in 2015 then and only then smart money will move to US Bonds because due to global deflation Dollar will continue to move up beyond 2015 so smart money will still make money in Dollar appreciation if not in low yield.
During last summer Mr Armstrong was anticipating a significant low at 1.075 yr
( 1/8 of 8.6 yr ECM (Economic Confidence Cycle) turning point ~ 2014-9-3/4 in US Equity. He did mention re: possibility of cycle inversion which does happen time to time when expected low / high do not materialize + do the opposite. If it did make it
then it would have set up for phase transition rocketing to 2015.75 spike high..
However Market kept going up well beyond expected turn date. As it turned out
it was a high + not a significant low. The beauty of his turning time dates is it’s quite
accurate to within few days w.r.t. important change in a a certain market somewhere in the world. Within few weeks he determined by looking at many different markets
that it was the U$ rally that began accelerating. We all know now that was powerful
multi-month surge in wave 3 rally, to use Elliott Wave lingo. It just is pausing last few days to catch its breath.
So 2015.75 looks to be a significant low in US Equity, perhaps 10-15 % correction ?
to fool most into believing the ‘Crash’ predictions flushing out all the weak hands
and Smart Money transfer their capital from spike high Bond ultimate multi-decade high from 1980-1 and double their money or more within ~ 1-2 years by catching the
world wide loss of confidence in ‘Public’ Sovereign Bonds + Gov’t.
The only alternative is the ‘Private’ US Equity for a big enough parking lot for U$ denominated Capital looking for their next attraction and by then US Equity will be at relative ‘bargain’ prices certainly vs bubbled up bond prices with interest rates approaching 1 % or less for 10 yr Treasuries. Likely it would be SPX dividend paying heavy weights that will be very very attractive to Foreign Capital ( U$ denominated, Capital gain potential + higher dividend > measly USB’s)
It’s a logical set up. All the conditions are in place. I refer you to Armstrong Economics blog Jan 6, 2015 ‘ The Bond Bubble confirmed.’ It’s reverse order of what happened in 1928-1933. During that time Corporations were in weak financial positions with high indebtedness with corporate bond issuing.. Investors lost confidence in ‘Private’ Equity then fled to the ‘Public’ Gov’t TB’s while corporate bonds crashed with many going to zero.
This time it’s the governments that are incredibly heavily indebted while multinational corporations the ‘Private’ are sitting on $ Billions of cash often overseas to escape paying taxes when they repatriate the cash. In EW parlance it’d be like the rule of alternation.
Market likes to have a variety to spice it up + to keep everyone guessing.
I actually don’t understand your view. It seems that you have the same view except you believe the timing is Sept 2015. Is that correct?
Also, I appreciate the 5000 years of history — I didn’t know such records exist. But how did he go from that to pinpoint the exact month in 2015?
Combining astro and gravity I get this picture.
1) we are up from March 2009 into July 2020.
2) from 2011 until 2015 we saw an extended w3.
3) this week will give the start of w4 down into march 2018. The orthodox timing is feb 13, but feb 11 is within the shockwindow.
4) the last leg up is into mid 2020. I have 2 critical dates : may 16th and july 31st.
2020 will be a very significant year where many long term cycles synchronize. We do have some time before that to figure out what comes after that.
Cheers,
André
Andre, no doubt you have noticed that your dates for Feb/Mar on your previous posts more or less coincide with the Greek debt date?
For instance your Thurs 26 high is in line with Sat 28 deadline for Greece. Does that point to a unfavourable outcome and as such a fall in markets into your March 5 low?
It will be iteresting to see how it unfolds.
Cheers
Allan,
I am always amazed how news always seem to come exactly when you need it. Don’t know what the news will be, but markets will respond negatively.
I see the bankers witch hunt is back on after a few years of grace, I’m surprised the British media is making a big deal of this now.
Iv recently noticed a big shift in media stance towards bankers/euro zone/Russia and Greece, or is it just me.
Andre in one of your posts you mentions gravity up is indicative of an uptrend
<> Two reasons for this:
<>
2) we were under the spell of the sun-jupiter opposition. This was exact on friday 6 but has a shock window of 4 or 5 days.
Usually this aspect is seen as bullish, but Jupiter is retrograde so it marks a top.
.. and in a subsequent post ,
A lot of books have been written on these subjects. But most of my insights come from my own research.
The general rule is that a <>
keeping in mind our body is 85 to 90% water, I agree, that the force of gravity will impact us humans.
Could you please clear this.. ? thanks much
sorry have to repost the special chars in the text messed up the message.. sorry about that…
Andre in one of your posts you mentions gravity up is indicative of an uptrend
Markets were up last weak as expected. Two reasons for this:
1) Gravity was up
2) we were under the spell of the sun-jupiter opposition. This was exact on friday 6 but has a shock window of 4 or 5 days.
Usually this aspect is seen as bullish, but Jupiter is retrograde so it marks a top.
.. and in a subsequent post ,
A lot of books have been written on these subjects. But most of my insights come from my own research.
The general rule is that a strong gravitational pull makes people feel bad and markets should go down.
keeping in mind our body is 85 to 90% water, I agree that the force of gravity will impact us humans.
Could you please clear this.. ? thanks much
Sure.
I sometimes say gravity is up to indicate gravity is positive for the market. This means my indicator goes down as the gravitational pull grows weaker.
More gravity is always negative for market unless we have an inversion.
I understand the confusion and will try to be more clear next time.
Shorts no need to get excited unless $NYADV weaken to sub 800. Another day of side-way move.
I appreciate this is subject to change,
but given Ukraine and Greece this is a very
mild reaction atm, unless we sell of later today
we may see new US highs this week.
The chart pattern for SPX in this current rally is tracking very similar to Jan 16-26, with Jan 26 being an inside day and the 5th TD from the Jan 16 low. Today Feb 9 is an inside day and the 5th TD from the Feb 2 low. I would assume today either finishes close to flat or slightly in the green by +5 points.
If so then it marks a low risk setup for a potential gap down tomorrow and a short term sell off that retests the low again by either late Wed to early Thur this week.
The setup obviously fails on any lack of downside follow through tomorrow or 2065+ …
Thanks for that heads up Steve T.
Low on Monday confirmed- as expected 😉
But if tomorrow brings a lower low then how can Monday bring a “low”? More accurate is that Monday brings a pause to the action …
great call as always. Thank You
Tomorrow won’t bring a lower low. Gravity is growing less as we are heading for a square. The inversion on Saturday gave the high on Friday. The inversion today gave the low. Now it is up into Wednesday; there is nothing to push it down tomorrow.
Wednesday is when the fun begins I assume?
Yes, Wednesday the start of the crash cycle.
John Li What is a panic. I think it is like 1987. Gann put out what he called a Financial time table. You can find it by googling time-price-research It goes from 1784 to 2121 putting all those years into low prices, high, extremely high, panic, extremely low, Major Panics etc. 2015 is in the panic row.
Thanks — I see that now, and see that he is using the moon and the sun. I just wonder what is the logic behind that and why it affects human emotions. There are two panics and one crash? What is the position of the moon during those years?
We are all acutely aware that the highest declination of the sun occurs during the summer, and lowest during winter. Very few are as aware that the moon does the same thing, but over each month rather than over each year. But there is an important difference between the two, in that the moon’s maximum and minimum declinations each month gradually change over an 18.6 year cycle.
At one extreme of the cycle, the Major Lunar Standstill, the max declination of the moon each month exceeds the max declination of the sun over the year; and the min monthly declination of the moon is lower than the min yearly declination of the sun. In other words, for a period of 2/3 years of the standstill the sun appears to be contained within the movement of the moon.
9.3 years later, at the Minor Lunar Standstill, the monthly movement of the moon appears to be contained within the yearly movement of the sun.
Gann observed that these periods coincided with feeling of panic in humans. He was by no means the first to discover it though, because ancient humans spent many generations building places like Stonehenge and Callanais to measure the relative heights of moon and sun in the sky (the solstaces were of secondary importance). So there is no doubt that these standstills are very important to humans – although the exact reason why is more open to argument. My own view is that the cyclical degree to which the moon gets between us and the sun is most important, which partially shields and then reflects solar wind.
So here we are in the early stages of a Minor Lunar Standstill, coinciding with a rare tetrad, coinciding with a type of solar cycle which is new to almost all of us – a triple confluence of the things that cause exaggerated agitation, impatience, aggression and panic – yet most are expecting the next few years to be a simple reflection of the last few.
Wow Mark, thank you so much. Reading your posts is much better than 1000 wiki pages because you explain so well.
I see that the major and minor standstills are panics and crash. But what is the significance of the midpoint between the two, labelled “F=Panic”. It did get the 2000 crash.
Thanks Mark! New information about lunar declinations is appreciated.
John – I’m not aware of any particular significance to those midpoint years, other than the fact that they are exactly that – midpoints between standstills.
Its interesting how different they are, depending on whether they come after a minor or a major standstill. After a major standstill, prices decline until the midpoint. But after a minor one, prices quickly recover (after roughly a year or so) to form a high at the midpoint, then another panic, then a higher high.
So, a single major panic at (or soon after) a Major Lunar Standstill; but after a Minor Lunar Standstill, the panic is effectively split into two halves – both in terms of severity and also cycle time.
That would imply, taken on its own, a short-lived panic around late 2015 or during 2016 with a quick recovery in US stock prices into a similar panic around 2020, then a bigger surge up to a bigger panic around 2022/2024.
But first, an 80 to 90% chance of a mania – starting about now!
Lunar Chord has two negatives: apogee, declination; one positive: full moon plus 5.
Seasonals: negative until Wednesday.
Planets: mercury retro over tomorrow. limited upside two weeks after as market takes a breather.
Current price structure: set up for short term weakness.
Current position: short, profit on entire portfolio since Friday 1.5%.
Summary: seasonals positive starting Wednesday, looking for long position when price turns around.
No one can know with any degree of certainty
precise daily market movements, if you could
you would amass riches beyond your wildest
dreams within weeks – and the last thing
you would do is post on someone else’s blog.
Trends yes, but they are not definite.
Amen, Phil….
I’m short stocks and long gold, and “hope” Andre’s forecast pans out, but that’s certainly not what I’m basing my trading on…..
Sorry if my posts seem too certain. I have to assume it works since I am actively using it for my trading. It is a somewhat unique system that is in line with the theme of this blog so I am not sure what you are objecting to.
And by the way it works and to repeat:
John’s Lunar Edge works.
Adding apogee and perigee adds clarity.
Adding declination more clarity.
Adding tides more.
Adding seasonals more.
My equity curve is up sloping since using this combo..
Barry, don’t be praying for yourself , prey for others who will need it. If it goes wrong you just lose a few bob, but for others…..
Hi Aaron…
Pray/prey?? LOL~ 🙂 And hope I don’t lose ANY bob! hahaha 🙂
But guess what I was trying to say is I’m still not sure how anyone puts money on the Sun or Moon of Jupiter or gravity or Lunar anything or………..regarding trading….
Honestly, I read these posts, but there’s so many different outlooks, all conflicting one another, that it all just comes out as gobally-gook to me…
I don’t mean to offend anyone, but I’m just not convinced it’s the answer here…
Whatever works for each person should be fine. Neither Valley nor Andre is insisting we follow their methodologies. Just offering info.
My personal poison is EW and I recognise that you can shoot it full of holes too. Having some additional ‘help’ on the side is always welcome to me.
Barry, the best I can offer is that this appears late cycle,
with US earnings possibly nearing a peak.
A mild parabolic phase with clear new ATH
as per the recent DAX price performance
cannot be ruled out – that performance helped by
a weaker Euro for context.
Late Q2-Q3 is my best guess for the bull market to roll over,
however if earnings guidance begins to trend back up
this will prove incorrect.
QE is hugely supportive but earnings are also vital at these
market levels, as the price performance of IBM or MFST shows on
weakening guidance – QE cannot abolish the wider
business cycle, that is illusory and will ultimately prove a costly
lesson to some investors.
Hi, dont have my data here at work… but wasnt the 1929 shoulder 27TDs after the top, just as in 1987? And the SPX top/shoulder last week was also 27TDs after the Dec top…
and you astro-guys… we are at heliocentric Earth-Jupiter conjunction, just as in 1987. In 1929 I think the crash began some weeks before the conjunction?
btw Eart-Jupiter heliocentric conjunctions correlate with solar wind flux and the interplanetary magnetic filed (IMF). Suggesting that there is a MxR mechanism (angular momentum exchange), where Earth and Jupiter dominates (Earth dominates the inner planets, Jupiter the outer). Also Venus is significant, and is adding an effect that typically is seen every three cycles.
Somehow this is related to sentiment and the stock market. The result is a negative period around Earth-Jupiter conjunction. Some kind of market correction typically occur in this interval. So if markets have corrected, and we are at the conjunction, it is often a (early) low. But if markets have not made a correction, and we are at the conjunction, the correction is ahead (late correction).
In astro finance one typically hears that the conjunction signals market reversal. I think it is more correct to say expect a market correction sometime before/after the the conjunction 🙂
Jan,
I agree. The earth-jupiter conjunction was energized by Venus (trine). This makes a powerful constellation. But the earth-Mercury conjunction jan 30th makes it complete. These conjunctions aligning within one week is remarkable.
As Jupiter is slow moving a shock window of 5 days is not too much.
I expect this week to be extremely important.
André
Looking at just the moon I see 2 significant events on the horizon:
1) feb 18 new moon close to perigee (19); a so called stealth supermoon (Richard Nolle)
2) the full moon @ apogee march 5.(=cit)
Wednesday we are at last quarter. So untill Wednesday the sun-moon angle is increasing (less gravity) but the moon is also heading for perigee (more gravity). These affects are compensating, so I expect a somewhat consolidating market with a positive bias.
The stealth moon has a shock window that opens feb 13.
So from Wednesday on gravity increases with a first target around the stealth moon. This will cause the first low. Then some recovery heading for first quarter and finally the last leg down into march 5. March 5 is a very significant date, supported by Bradley dates and a host of other timers.
I don’t expect anyone to ‘buy’ my expectations. I just share my analysis so you can judge for yourself if it helps.
André
Thanks Andre. Won’t hold you to it but if we get a significant correction then I will be tickled pink.
Like others here, Andre, I will be watching closely how your predictions play out. Thanks for sharing —
I think your research is quite remarkable, wish I grasped all of the concepts myself, but thanks for your posts here.
Looks like it has begun……………
Just to give you a taste of what confirmation looks like.
My gravity indicator gives 11,17,16 and march 5.
Next I look for confirmation in astro.
11)
– Mercury stationary direct
-sun inconjunct Jupiter and semi-square Neptune (gc)
-Mercury inconjunct Neptune (hc)
– Bradley gives 10 (h) and 16 (g)
– within shockwindow of astro crash cycle exact on 13.
17)
– mars trine Neptune
– moon semisquare venus and Mars
– moon conjunct mercury
– within venus conjunct mars window (13-22)
– within stealth moon (conjunct Neptune) shockwindow
26)
-sun conjunct Neptune
– mars trine Saturn
– moon 60 Uranus/150 pluto = activation uranus/pluto square
HC latitude configuration:
Mercury parallel Uranus
Mercury parallel Neptune
Mercury parallel Mars
Mercury contra-parallel Jupiter
within window of end mercury max cycle (21-27;exact 24)
march 5)
-earth/mercury square (hc)
– declination configuration
sun contra parallel moon
sun contra parallel venus
Moon parallel Venus.
– Venus semi square Uranus (hc)
– Mercury trine Uranus (hc) march 6
I have still other timers but I don’t want to give away everything ;-),
Hope you begin to see how nice the confluence can be between a gravitational analysis and astro. And how combining heliocentric and geocentric astrology gives an edge.
I won’t do this often. But now you can see how I search for confirmation.
Cheers,
André
Thanks, Andre’. When the student is ready the teacher will appear.
typo ; 11/17/26/5
NO Comment…..[smile]….
The market is going to do what it wants to do. It is hopeless to predict. But perhaps, Martin Armstrong’s capital flow is a force to reckon with.
Andre… You have been spot on. Your analysis is second to none. So much appreciative that you have chosen this board to share your uniquely great work. Please keep posting. I’ve learned so much from your approach and just want to say THANK YOU.
Thanks; I appreciate this.
Likewise, I am happy to read about different methods also.
Keep up the good work!
J
Hampson, I mean no offense, but what is the strategy if we begin to break up to new highs? As unlikely as it is, what if this is the start of 8/1929?
Step aside
Hi all ! I think it’s not going to be too long before John gives up the bearish outlook and join us on the bull side. New highs are on the way in all major indices. Very easy to make money in these markets.
Let me know if you have any questions.
I have a question. Do you ever sell? Is there a profit target?
I’m not planning to sell anytime soon. As long as the central banks print money and buy trillions of $$ in assets, and rate are 0% and even negative, i will continue to hold.
Thank you
I have SPX 1,450 and I have no plan to sell.
Let me know if you have any questions 🙂
John, he gives no specifics in any case.
J
I have exactly the same question for John Hampson as John Li’s. I am curious to know what his strategy would be from here. While I believe that the correction is imminent (not the crash), there should be a good strategy in place if the markets keep chugging higher like they are now, Certainly the new ATH scenario, where Nasdaq takes out the 2000 top around 5100 cannot be ruled out
Big breakout in AAPL today is a BIG warning to bears. The COMP or as some say AAPLdaq is likely to reach ATH at 5100 (from 2000) before serious (10-20%) pullback,
Now setting at 4785 the COMP is only 6% from ATH (1.3%) today. The only news I see is the iWatch release in April, so that may be the target date for ATH.
I have been using inverted Bradley dates for timing since Oct, but it looks like it may be un-inverting. This would confirm ATH date.
My feeling is that strong down move tomorrow and/or on Thursday is in the cards. SPX 1990-2000 range should be tested before end of this week.
I expect wild gyrations to continue with final top or this bull in March or early April.
It is looking like new ATH, clear new high on AAPL.
I mentioned yesterday’s the very mild pullback,
even with Ukraine and Greece there was a large lack
of downside traction.
Earnings almost out of the way and even with several
disappointments the Q overall appears strong enough
to provide support.
Burnell, that is a very big call to make.
That would require a significant worsening of
geo political tensions or Greece effectively
walking away from EU talks, an outside bet IMV.
Phil, when the market is ready to go down, nothing else in the world needs to happen. Nothing specific caused the 87 crash. It’s cumulative. Hence it is imminent, given posts at this blog, and elsewhere. Bubbles burst.
PS…I’m sure you noticed the FTSE making a head start back down?
GM, In regards to 1987, interest rates had been steadily trending upwards that year (reaching 10% on the 10-year as I recall, but could be wrong). I’d point to that specifically as a reason why markets crashed. That and the portfolio insurance craze which instead of protecting investors, actually accentuated the market’s downturn.
It was a crazy day – I remember staring at my Quotron (or whatever we were using back in the day) in amazement.
My point was (as you seem to agree) that it’s a cumulative result of various factors, never one news item. This time interest rates have been falling for over a year, but the business cycle has cycled.
An example, wholesale sales: down….inventories: up. = bad news ahead.
http://www.alhambrapartners.com/2015/02/10/wholesale-problems/
Arthurk,
You mentioned april for the iwatch release. I took a look at one of my Apple time-charts. Surprised that I was.
Imagine for one moment that Apple is a stock in the mirror. How?
-Count trading days from the low october 16, 1990 to october 16, 2015 (6304). Split them in two equal halves.
-Notice that it took 123 trading days from the october 16, 1990 low to reach the spike-high, on april 12, 1991.
Now count backwards that same amount of trading days -123- from october 16, 2015.
Further notice that the stock based during october 8, 2002 and april 17, 2003, for a total of 132 trading days.
132 x 23 (imagine 23 as being a part of 123)= 3036. Count that amount of trading days forward from the same low, april 16, 2002 and see for yourself what date comes out. And where do you end up when you count it backwards from the low april 16,2002? Close isn’t? Your hunch may turn out very accurate, indeed.
Typo: april 16, 2002= april 17, 2003, just as in a few sentences before..
http://www.zerohedge.com/news/2015-02-10/speculators-have-never-been-long-vix-they-are-today
Interesting article… Ordinarily, that headline would have me concerned, but regardless, I am definitely one of those speculators…
Barry,
I agree. I don’t like that. I am a bear and I don’t like company.
The Vix is yet to make a new low in more than 9 months, every time we get to such low levels in the vix (near 12), complacency results in shor term pull backs, so the old highs in the nasdaq near 5130 could be the next major resistance for another pull back
Yes folks, that looks a contra indicator.
Just like the 100 SMA of $CPC which stands at 0.99, rising since March 2014 indicative of participants being so bearish, buying more puts than calls. This indicator contradicts the notion that people are bullish.
In 2000, when every man and his cat and dog were bullish, the ratio was sub. 0.50.
More short squeezes ahead.
Just my thought here, and not really sure what the result is, but….
There is obviously the majority of people long here…
Not just many traders, but more importantly, asset managers of all stripes that pretty much are always fully or near-fully invested…
Many charts that we’re aware of all pretty much show that….
But they’ve GOT to be aware of the risks here too, so many buy Puts / Sell calls / use inverse ETFs, etc., to hedge themselves…
They can TELL everybody they are fully long, (always fun to do at cocktail parties ….when the market is going up)…..but also have some back-door protection at the same time…
But this is distorting some of these indicators and readings at times…
Again, I’m not sure what that means going forward, but I have no doubt it leads one to believe (by all the volume in down market protection vehicles), that there is more bearishness out there than actually exists…
Again, just an opinion, and like many things, everyone’s got one of those….
GM, October ’87 I was 17 but already fascinated
by markets and spent a lot of that day listening
to reports, I began trading shares at 19 two years later.
On the UKX, heavily influenced by commodities
so if crude resumes it’s downward trend it may struggle.
For me markets are exceptionally difficult to read (short term)
currently.
1987 was the best of time.. the Peter Lynch era when those baby-boomers who bought the stock market saw multi-baggers return.
Risks to the upside with new AHT of the RUT,
SPX and DJI is what I see, let’s see what happens.
Despite all the noise in the media, the bear has really not gone away quite yet, http://www.safehaven.com/article/36442/bear-market-lessons-from-history
Nicolas, I know I’ve mentioned this before, but I only ask one thing of you….
PLEASE tell us when you get out of your positions….
Whether it’s because you’ve already bought your private island, and realize that really, you can only drive ONE Ferrari at a time anyway…..OR…..if it’s because you “just can’t take any more pain”, please…..please……tell us when you decide to liquidate your positions in the stock market….
Thank you….
Hi Barry ! I think everything is based on central banks in our era. I will sell when central banks decide to no longer support the markets, which is not anytime soon. As long as central banks buy trillions of dollar of assets, I will keep most of my long positions. I can take profits from time to time because I want to enjoy all that money, as you said.
Thank you
Nicholas clearly unaware that the Fed eased through 2000-03, and again through 2007-09. And again in 2015-17. They control nothing.
Hi GM;
A few month’s ago, I even posted a link (with an explanation) about Japan’s (still on-going, it appears) experience in the early 2000’s with this very thing….
I tried to be helpful, but now, I’m just going with it…
I think the markets here and now are an easy call, an easy short.
Simply because the dollar/yen carry trade looks dead, very hard to see that FX cross moving up past the 121 level, but very easy to see it crumbling back down to 100.
Pull up a long term chart, see what you think?
is that a reversal in treasury bonds today
does it mean anything?
i’d say yes if biotechs continue to weaken here
Oh Nicolas if only it were that simple. Amd yes I hear the chorus “well it’s worked fine so far”……………however there are currently massive distortions and dislocations underway globally that will lead to massive recalibrating across all sectors of the financial markets.
Central Bankers think they have it mastered but history shows that interventionism is always doomed to fail.
I said tne other week that the SNB decoupling the CHF was just the start. and now we have the Danes travelling the same stupid policy. It will end in failure very soon and we also have the Chinese economy hurting badly and they will need to step in very soon to take action on the Yuan.
Where does this leave the US?………….overpriced dollar, overvalued stocks and risk aversion all but non existent with a financial derivatives eposure to US banks in the trillions of dollars.
Good luck Nick with the Central Banks covering your back if that one blows up.
Do yourself a favour and read what Gordon Brown ex British Prime Minister and Chancellor of the Exchequer said in relation to the GFC when he took a phone call early one morning whilst on his way to Brussels just 2 hours after the Lehman collapse.
Do you have a link to that?
John I don’t but you will find reference to the above everywhere, it is pretty much now folklore.
In a nutshell Gordon Brown was in Luxembourg headed to Brussels the weekend of the Lehman collapse.
He took a phone call from Sir Tom McKillop head of the Royal Bank of Scotland.
McKillop said to Brown “we are blleding cash, what ate you going to do about it”?
Brown says that at the time he thought McKillop would say 24 hrs at least.. McKillop told him 2-3 hrs at most before Britains biggest bank would have ceased trading.
Andre, just out of curiosity if market does not sell off today or even if it does not sell off for rest of this week and instead continues to even higher levels, does that invalidate your thesis of what you outlined previously regarding Feb 11 onwards?
Steve T I was going to ask a similar but slightly different question. Was the ‘high’ we were expecting per Andre above yesterday’s high or much more?
I would be more than happy with a day or two of slippage in getting to that high. After all this is all new ground that Andre is trying to explore so we need to allow leeway.
Andre, please do not take this as a criticism of your methodologies. Just a ‘pleb’ enquiring. Thanks for all the info that you share.
Well the Tue Feb 10 gap up day nullified the bearish setup that I was monitoring. And even the Mon Feb 9 low failed to get UVXY to even hit $30 and it stalled out in the low $29’s before selling off that day.
Right now with the lower highs in UVXY on Feb 2 and Feb 9 and also with rising lows of Jan 26, Feb 8, and now Feb 10 (tentatively), the rising uptrend channel appears to be morphing into a triangle consolidation since Feb 2 with resistance and support levels of about $29 and $25.
SPX appears to be breaking out of its consolidation channel that it has been stuck in since start of 2015, not quite there yet but right at the top now. The rally from Dec 16 low to Dec 29 top occurred in the next 8TD. Feb 2 was both the low and high (i.e. bullish reversal) and today would be the 8th TD from then. So next couple of days will be key in determining which way it breaks out, and I do believe we are now due for a break out (in either direction).
FWIW Mercury retrograde ends today …. but up and down volatility is supposed to exist for at least the next month.
Looking purely at the charts I would say that we get a slightly new high above yesterday’s high, tomorrow, and then start our descent towards the Feb 2nd bottom ….. but don’t go below it.
Then a new ATH for one LAST TIME and then the End of the World is Nigh.
That’s been my wave count for a while now and unless it goes below Feb 2nd or does a new ATH before heading back down, I’m sticking to it.
Yes it would. But keep in mind that the sun-moon square is due in a few hours. So I still expect tomorrow to be down and that is will be down into 17.
Andre your ‘high today’ call was right on the button. The surge after hours was phenomenal. Well done and my grateful thanks for sharing all this!!
Looks like a short squeeze will come before the next depression.
Mark has mentioned repeatedly that 1929 is an example of a parabolic move after the solar max. Everyone knows it can’t last and yet everyone thinks they can get out fast enough. The bears holding shorts at new ATH are the losers even if the situation is just plain crazy.
Market goes down on a panic because of seemingly unsolvable problem in . Greece is not…so, bulls have the advantage.
So lies, no Greek deal, ant the media great, CNBC keeping the markets on life support just to make it through to the weekend.
Dow futures spike and fall over100pts either way,, lol,
2007 all over again.
20 point swing on S&P futures. We are going lower folks.
Peace talks fail, Greece talks fail. A complete contradiction on both issues yesterday, released on mainstream media.
http://www.bbc.co.uk/news/world-europe-31434528
http://www.bbc.co.uk/news/world-europe-31432471
I strongly suspect the stories was fabricated in order for longs to close, iv got no real serious positions going but this a complete farce.
Have we seen the peak? Who knows what BS the media puppets to the bank will conjure up next.
It would be funny if the subjects involved did not affect the lives of 1000s.
Here’s a great example of just how widespread and obstinate the bearishness in US stock markets is now: http://kingworldnews.com/major-warning-fear-barometer-just-spiked-one-highest-levels-history/
Apparently we should be fearfull because this measure has spiked up into “Excessive optimism” several times during the past year. Yet it spent a decade or more below “Excessive pessimism”, and that doesn’t even get a mention.
If it can spend many years in extreme excessive pessimism, then it could easily be about to spend many years in extreme excessive optimism.
The text says extreme fear, puts expensive etc, but the graph shows extreme euphoria. (From the link) The graph makes sense, as it is from CSFB, but the text seems to be some marketer trying to sell something.
Merkel did it. Russia cease fire. RSX already knew it a few days ago. Its chart says so. Sanction will be off one by one over the next 6 months. Bringing relief to geopolitical tension, and badly needed trade in the region…. A bout of opportunism on hand.
Bulls just overcame another wall of worry.
LMAO!……not at you Newt, but this is cease fire number what?……..
Obviously everyone has forgotten that this is a gorilla/civil war which means that political leaders can say and do what the hell they want but at the end of the day it is the people on the ground that will decide and I suggest that as it wears on political divides and thus intervention will once again become involved.
You may be right! It was getting too painful for Putin. Merkel was too afraid to have to send in her tiny army to back up the rhetoric.
This may also have short term implication to the energy complex.
Gorillas, scary, especially when armed. 😉
lol @ “gorilla”……:D
js actually that is hillarious……stooopid pre emptive txt.
As you can see I don’t check my posts too closely.
Allan, check this out.
Lol …….I just showed my wife the post and showed her the vid. She fell off her chair laughing 🙂
I suspect “gorilla” is actually somewhat close to the truth in any case. It probably is an insult to the primate to refer to people who kill others as “gorilla”….imho
J
pretty funny how “news” is “reported these days”
only way to discern the truth is by purveying comedy shows and blogs
and even then it takes a lot of time and effort
Target reached on SPX from Jan 29 of 2075+ (then 1990) by next Bradley turn date – today.
https://solarcycles.net/2015/01/28/charts-updates/#comment-47851
However, I am changing my bearish outlook to a 30% probability int term as discussed previously in this thread (#comment-48865) based on the breakout of AAPL, one of the “leader” stocks I follow.
I now see a 70% probability of test of ATH for NASDAQ at 5100 by end Apr – beg May, This should be interesting with the crash prediction from Andre over the same period,
Instead of making a prediction without a crystal ball, I am going to hope and patiently wait for a date like Sept 22, 2014 when we had a marginal new (price) high but ugly/rotten internal breadth and significant negative divergence. This date will come but not today.
USDJPY has just tanked by over 1%, will the markets follow suit?
USDJPY now plunging, down 1.6%.
If I traded, I would be adding to SPX shorts at this very moment (16.52 GMT).
Catch-down to follow IMO.
You gotta love Gorillas!
USD topping out here as suggested yesterday.
I’m looking for the fall to “at least” 90 area in $DXY, and have inititated several trades short the buck.
Can someone help me understand the sun better?
It seems that the southern hemi is still peaking in sunspots:

And yet it is the northern hemi that is having trouble with the polar inversion:
http://www.solen.info/solar/polarfields/polar.html
Is there a relationship between the polar inversion and sunspot peak counts?
Price supportive: moon phase approaching new moon, declination hits south over weekend-then treks north, apogee past and perigee ahead. Seasonally good now to next Friday.
Price suppressive: mercury retrograde over, energy slump.
Conclusion: I lost 1% betting on weak lunar factors and second week of month seasonal weakness. Now in cash, system indicates going long but I am going to take a breather cause I have had two losing trades in a row and price sometimes gets out of sync with cycles and so next week may be down.
seems like next week “should” be bullish because we have the bullish part of the lunar declination cycle and the bullish part of the lunar phase cycle in play all week. But market is extended, SPX is hitting the upper bollinger band today on the daily chart. So maybe next week we consolidate for a day or two and then head higher into the end of the week.
Monday is President’s Day, US markets are closed.
With new highs on the DAX and the NASDAQ, I wanted to congratulate all longs for another excellent week. Well done ! I’m looking forward to new records in all major indices and further money printing by central banks.
Have the central bankers decreed that weeks end on a Thursday then Nic old chap?
Nicolas if you wish to keep congratulating youself for participating in this obscenity that is stealing the futures from younger generations for decades to come so be it.
Greece, eventually coming to the rest of the world.
New ATH on the MCX today.
RUT about 7 points from a new ATH atm.
Not sure there is much to stop this now.
Ho hum….There is nothing new under the Sun……..”It was the worst of times, it was tne best of times…”
Or is that the other way around 😉
And cue Nicolas….., I’m pushing it expecting to get 6th time lucky but here it goes.
Short SPX 2088
Nicolas is a troll. Nothing more, I suggest ignoring him or her completely. Seriously, it is just a wind-up.
J
Ditto jegersmart. Not sure why Nicolas gets so much attention from the board members. He might have just had so much fun with the attention. On another note, despite Nicholas’ sarcastic posts, the fact is that he’s been right that the markets are chugging up and up. If you are truly long like you said you are, Nicolas, I sincerely hope that you could get out of this pos before too late. D day is around the corner. I am seeing triple top in Nasdaq as gold is temporarily bottoming.
I started shorting again today, btw…
Hi Erick;
For me, it’s that Nicolas seems terribly smug (on a regular basis), but also, a couple of months ago, he said something that really chapped me the wrong way….
On 12/08/2014, Nicolas said, “Hi all ! Another good day for QQQ and IBB.
Where’s John ? Is he bankrupt ?”
I just found that terribly rude… John is kind enough to publish this forum, as well as post some great charts, and ~that’s~ the comment you make to the host??
Also, he confuses “analysis” with “mantra”….
If the market goes up, he claims “the CB’s were buying”…
If the market goes down, he claims “the CB’s are going to be buying”….
And then basically tells you, and I paraphrase, “you are welcome for my analysis”….
I’m pretty sure that at some point he’ll find that what he’s preaching isn’t “analysis” in any shape or form, but, in the meantime…..it’s annoying…..
Although, I will say, he tends to be most prolific at ST market peaks, so he’s got ~that~ going for him…. 😉
Nicolas has rubbed salt into the wounds of the bears. Nicolas has also been right on the current trend. I don’t trade because unless we are talking about peanuts; I can’t afford to lose. So I’m kinda in Allen’s camp in that regard. The following article presents probably the most compelling case I’m aware of about the risks of trading in the current environment.
And I wouldn’t bother to read any more of Bill Holter’s missives because he’s never been right on the price. He’s a gold promotor and perennial gold bull. The question for me becomes, can I afford the risk if he might eventually be right?
http://blog.milesfranklin.com/gaps-will-lead-to-the-truth
Nicolas is a troll. Irrelevant.
😀
J
Today’s rally is confirmed by $NYAD (cumulative) which hits an ATH. In fact, it prints a positive divergence (higher lows) since December 29th while price was consolidating side-way.
Agreed with you Barry. I guess Nicolas and his dumb money are part of the reason why the dumb money confidence levels are starting to get a little overdone again. A push to new highs would trigger extremes again and the last three times it put a cap on upside potential.
I’ve found it absurd that someone out there is still buying this market. Of course unless you day trade or very short term trade.
I am short SM and long gold, and I am feeling confident about it.
Similar positions here, and looking for a spot for the next layer of shorts to be added… Was very tempted today, but didn’t pull the trigger…
That said, taking a hard look at adding SQQQ when the time comes….
Nicolas is long QQQ, so……..it just seems right…. hahaha
Andre,
Has your scenario been invalidated yet? The force seems strong with this rally.
Too soon for final conclusions. Sunday I will go into this; but I think a understand now. So long term my vision hasn’t changed. If we get a sell of today it is just a matter of fine tuning the timing. A low on march 5 is still my prime scenario.
Andre,
Thank you. My cycle work suggested that a much lower low was ahead. New highs invalidate that view somewhat.
Nicolas is the only person actually making money and correct the whole time. I see the same thing on every other blog, bulls being chastised for making money. That’s the name of this game. If you want to donate money to others go for it, but don’t complain about it. Follow the market map.
wave 3 should be around 2120 as projected
Updated – Finishing Wave 3
And Swing Trend Indicator still on FULL BUY
http://unbiasedswingtrades.blogspot.com/2015/02/swing-trend-indicator.html
Not quite sure how you’d ~actually~ know if other people are making money or not, but don’t let that stop you from making statements like that…
And it’s not that Nicolas is making money that bothers me….
(and BTW, it’s only AAPL that’s making him money…..the others….barely…)
The goal for ALL of us is to make money….and there are a LOT of different styles and time-frames to do that…
But it’s the smug, condescending, and rude comments….that do….
Really not necessary…
Roger that Barry. Well said. BTW what does your trading system show after today’s strong rally?
I don’t have a system. Instead, I rely heavily on cycles and Ewave plus recently I have added the astrology factor. Andre’s posts have been a big help as well. I am confident that from the risk reward standpoint, the upside is limited, while the big correction is more likely with much more rewards. It is coming, we need to be a little patient here 🙂
It looks like it may be finally here folks.
The ATH that invalidate the 2014 top thesis.
Harmonic timing tool
I have now devised a harmonic timing tool. This weekend I’ll talk some more about this.
Anyway; this tool gives February 15th, March 5th and May 10th.
The Bradley window runs from 10 – 16 (midpoint 13).
Now I understand the Wednesday high was the W3 high and that gravity is now giving a divergence.
Harmonic timing confirms March 5th as very significant cit, as I have stated all along.
So, even if we close up today, we are headed for a march 5 low.
My crash cycle is exact today (due in a few hours) and has a few days window either side.
So everything concentrates on the next few days.
So was I early with my call ? yes. Does it invalidate my forecast ? No.
See you Sunday.
André
Can’t wait to find out more about the new tool. I think you are really on to something with your gravity based trading.
Do you have any sense of what timeframe you would expect the swing high between March 5th and May 10th will occur?
sopriscap,
Sunday I will go into this. But I already have an idea 😉
I don’t buy a rapid reversal of markets right now.
The DAX gave an early warning signal of higher levels
for global equities.
Next the sharp decline in Gold, then the AAPL ATH.
Yesterday this was topped off with a 52 week high on the NAS.
In UK markets the MCX broke out making a new ATH.
The RUT, SPX and DJI poised to do the same.
Risks look to the upside imv,
whatever someone’s latest new “system” may show.
Worth checking the monthly SPY candles, and comparing with the 07/08 top.
Some rhythm there, which indicates February will be very volatile yet, and end up lower, with lower lows ahead in March.
Tricky to spot day by day, monthly candles reveal a bit more IMO.
If oil has bottomed, market will go way up. If not, market will go way down. Oil price is critical for the whole house of cards, and probably prone to some manipulation.
I continue to believe Hampson is correct in the medium term (not even long term). This means that the peak in the SPX will be anywhere from now (double top) to 6/2015. But what is the right strategy to be able to hold on to the worst case of a 6/2015 peak — this thing can really go parabolic!
Erick;
No change to my trading system – still 100% long – 50% from 2052 SPX, and 50% from 2002 SPX…
I, on the other hand, being infinitely smarter than my own system ;-), am holding short, at 104% net short currently….
Had a really good January – up 6.9% – and even a good start to Feb thru this Monday, but obviously not ~this~ week…
Money-flow is telling me this is a “all hat, no cattle” rally, and I was expecting to see more up AND down activity, but my wallet is telling me something different…
What we really need now is a Texas sized “gully washer” to float prices down to more approachable levels.
Thanks Barry. Best of luck!
hey, barry. what site or tool do you use for money flow? do you track wall street journal daily buying on weakness, or selling on strength or sector inflow/outflow or something different?
That’s it folks – SPX just printed a new ATH.
John Li, of course John Hampson is correct longer term,
there will be another bear market with significantly lower levels.
That’s not even a discussion surely, John Hampson made a timing call
on US equities.
How do I know the bull market is over?
When SPX 320 SMA (currently at 1,926 and rising) is breached and can’t promptly make a V recovery as it did in the past few years.
So, imagining that “stop” being worked in real time as the the market is trading….I read that as:
The market could easily be at 1875-1850 before you start to “wonder / hope / pray” where/when a V-bottom will occur??
Which means if there were a steady decline, we’d probably be below 1800 before you actually said to yourself, “maybe the V-bottom isn’t coming”….
Is that a fair thought?
A mate asked me today why I hate this bull market so much? i said it’s not that I hate the bull market as much as I hate what this bull market respresents.
It didn’t spring from hard work or organic growth as in previous recoveries. This bull market represents a lack of accountability for those that caused the last collapse.and is based upon free money for those same people. We didn’t learn anything from the GFC and are in fact in a far worse state financially than we were before it.
Like I said in a earlier post. We, the older generations, have stolen the futures of younger generations in an attempt to cover our mistakes.
For that I am angry, but ashamed more so.
Allan, I totally agree with you. It’s one thing to be an unemotional trader and be just about making a buck from the market, but I think it’s so important that one does not become apathetic towards the continual degradation and corruption or the financial markets and world in general. Hence I share the same sentiments as you when it comes to my feelings towards this bull market that it represents something almost sinister about the world we are living in.
Doodoo, ‘sinister’ is a very nice word to describe where we are and what has been allowed to become of us.
john li, john started his bear call end 2013!!
Yes that was too early. We used the 1990 and 2000 analogs, and did not expect a higher second solar peak etc. However, the 1929 analog is showing that the peak should have been in 2015. Depending on how you compare the cycles, 1929 would suggest anywhere from late 2014 to late 2015, and of course, we can always surpass that analog and move to 1873 or even beat all historical records.
At some point he would be right — maybe today even. I grant that John is right in time, but I am not sure about price. But every time we make a new high, I do wonder if it is better to step aside and wait for a new second chance, or risk a parabolic move up in price.
robbie, I think it would have still been a decent
call by JH if December 2014 had been the high.
However, the NAS is at a 52 week high and the SPX
has printed a new ATH.
JH made a good case, however I think there now
has to be acceptance that it just did not develop
as forecast.
That’s not a criticism of John Hampson, what he attempted
to do was/is very tough – precise market timing.
The stock market is known as the great humiliator
for a good reason.
Of course John was wrong, we all are on a continual basis. I still value the depth and angles of the research he freely shares, I am not here to be led by or “witness” some sort of magic trick.:)
If the fact that John was and has been wrong diminishes him in your eyes then you are here for the wrong reasons, I suggest.
For some people the main game is always the need to be wrong or right. I want to thank John once again for providing information that I wouldn’t necessarily seek out myself, and a forum to discuss issues where most of the participants are interesting.
J
Ditto, Jegs… Good post…
Just to re-iterate what Jegersmart just said, I ~know~ I’m always going to be wrong….
Every trade I make, I presume at some point I’m going to be wrong…
Which is why I scale into, and out of, almost every trade I take….
Scale-up sells…. Scale-down buys…..
And just try to let time work it out for me…
Appreciated
As per the post .. it is not a criticism of John
what he attempted to do was/is very tough.
Please read the words rather than reading something
in to them which was not posted or intended.
The market makes fools of us all as per the
great humiliator summation.
Andre, I do not see how you determine Mar 7 to be a “low”. The first half of March should be an extremely volatile and likely negative time period for equities. Mar 16, 2015 concludes the 7th out of 7 iterations of Uranus/Pluto waxing square (the previous one occurred on Dec 15, 2014) which has been ongoing since late 2007.
The prior event in Dec 2014 had the two weeks leading up to that event to be quite negative for stocks (i.e. Black Friday Nov 28 top) and especially the final week just before it where Dec 8 was a CIT for a failed secondary top and over 100 point decline to a Dec 16 low.
So I do agree with you in that Mar 7 is a critical CIT date but I am willing to speculate that it is more likely to mark a top rather than a low, due to the astrological signature present near that time.
“But what is the right strategy to be able to hold on to the worst case of a 6/2015 peak — this thing can really go parabolic!”
John Li, I have been tracking an analogy with what has been happening now and the run up in the late 1920’s (i.e. 1927 to 1929), relating to interest rate hikes. FWIW I believe Feb 2 marks the top of the bond market and lowest yield. Apple came out with a $7(?) billion dollar bond offering and they have astute timing having picked near the exact top back in 2013 when they did a big bond offering then also.
Recent economic data appears to imply that the Fed will tighten, with only the consensus among economists of exactly when and not if. Right now the range seem to diverge between the earliest being April 2015 to possibly early 2016. The majority seem to pinpoint either June or Sept 2015 for the first initial rate hike.
When that occurs it will likely cause a major collapse of the bond market bubble and all of that capital will immediately seek a new home and best bets converge towards it going into a heated USA equities market. That will likely be the fuel to propel the stock market to parabolic heights for a subsequent 18 month period, even though equities are already at historical highs. Consider today’s high to be the base for a breakout bottom, if you will.
FWIW I think the Fed will do the initial rate hike starting in June 2015 …
I like your way of thinking here Steve T. I have been starting to go short longer US bonds (by buying TMV) over the past few weeks.
The Fed realises that it is now fighting for its life, as the calls to audit or end it get louder and more widespread. Central banking is largely a confidence trick. so how could the Fed inspire economic confidence and guarantee its very survival with one swoop? – start raising interest rates sooner than expected.
This sounds plausible.
Phil White said:
”
As per the post .. it is not a criticism of John
what he attempted to do was/is very tough.
Please read the words rather than reading something
in to them which was not posted or intended.
The market makes fools of us all as per the
great humiliator summation.”
————————————————————————–
My post, and indeed almost all my posts are not aimed at you Phil. Just for clarity.
J
Steve T
I agree that the bond market is going to go through a very rough patch at some point, however it is less clear to me where this money will go. Most people diversify of course. Can you imagine if even 50% of the funds in bonds went into just US equity market? SPX at 3500?
Current divi yield on S&P 500 is around 1.94% as of the last few weeks as far as I can see. Not sure bond investors will jump in at any price or yield when you bear in mind the volatility? I suspect that the reality will not be a bond market bloodbath wholesale, some areas of the fixed income space excluded.
Time will tell…..
GLA
J
Steve T, a final parabolic phase or “mild” parabolic
phase as per the DAX cannot be ruled out.
However I would be exceptionally surprised if
this bull market lasts another 18 months,
possible of course, but unlikely.
If US earnings remain resilient and do not
peak in 2015, then my view of a late Q2-Q3
2015 final top may be incorrect, and this incredible
bull market may make 2016.
jegersmart,
Thank you for the clarification –
probably lost count of how many times
I have thanked John H for his work and for
sharing it.
and it’s appreciated thanks
Hi all ! Yes, we can thank John for his analysis but at the end of the day he was wrong. I think he still underestimates the power of central banks. In our era the only thing that matters is central banks. I know that for some it’s difficult to accept but it’s the truth.
Just precious. Thank you so much. May I call you Icarus?
It also looks like the RUT printed a new ATH
before the close.
I thought I was pushing my luck, 6 times was just too lucky. I closed my short from 2088 for. A loss of 9pts.
Have a good weekend all, I will try again early March.
lol Phil.
Okay, new drinking game….
Every time Phil writes a sentence with “ATH” in it, we drink…. 🙂
Drinking and trading not a great combo )
In all seriousness what has happened today
is significant, multiple market commentators
thought this was not possible, and these
levels would be repelled.
Perhaps those Go USA type signs with
ATH on the other side.
Hi Phil;
The signs…I like it!! hahaha
That said, I suppose it’s important to give the talking heads on CNBC something to talk about all day, but not to me as I view the market…
I mean, if the market collapsed from here starting Tuesday morning, OR if it had started a collapse yesterday, would either really matter if the S&P dropped 200 points from here??
You’d have Nicolas crapping his pants either way…. 😉
And if we get another week of going higher, and people will be bored from saying “new highs”… So just not seeing a significance….
I just view it as:
Money flow is zig-zagging lower as price goes higher….
TRIN / TRINQ are in a good place to mark a top…
You’ve got Nicolas hurting his arm patting himself on the back 😉 , etc….
There seems to be enough liquidity to be giving junk bonds a bid, so there’s that, but still, just not seeing a huge significance of 2090 versus 2095…
So I’m just being patient, picking my spots, and waiting for a move lower….
All that said, things happen all the time, that most can’t imagine could ever happen….. In the markets, or anywhere else either…..
Thanks..
That’s the 37th “ATH” from Phil in the last week. I am not playing that game.
imho
J
Well I’m not claiming prescience.
Just guessing which is what everyone else is doing,
some like to view it in differently, ultimately that is
all it is and can ever be.
Prescience? That was not what we were thinking……haha
J
Don’t get me wrong, I think John’s analysis is top notch. I’ve never seen so much content in posts with supporting data. All I’m saying is tops take time. Indicators can tell you a major top is at hand and it can run against you for a year and 300 more SP-500 points, which in this case is around 15%.
I trade all in short or long, that’s just how I do it. It just bothers me that some people jump on people for being long and some people jump on people for being short. I guess that’s the name of the game because people always want to believe their book is right.
As far as I can see, everyone jumps on Nicolas for saying buy the dips, but it’s always worked. Then they say, oh, well, wait until it doesn’t…..Well no shit. But rather than chastise him for buying the dips and making money, why not congratulate? Is it because it’s against your book? I assume so. The only time I see people get so upset is when they are losing.
Thanks
geno0010
I agree completely, except in the case of the Nicolas troll. He appeared on here and has been stating ever since that the market is easy and to buy 3 instruments and that the CB’s will always have your back. That is just dangerous. In addition, the 3 instruments in question haven’t been great for him even if I did believe he has positions in the market.
You can tell by the way he writes that he doesn’t have a lot of experience, which I personally think is because he is an alias who is just here to wind people up. No one would make themselves sound as laughable as that.
This is my last post on the Nicolas issue, having spent way too much time on an alias like that.
imho
J
Thanks everyone, new post