

Extremely stretched valuations, highly lop-sided sentiment and allocations, excessive leverage, long-standing negative divergences, persistent shift to defensives, negative leading indicators, disappointing earnings, declining financial conditions: these are some of the ‘old’ rules that dictated stock market peaks. Yet, many months in their presence, equities still haven’t dropped in any meaningful way.
Looking at the SP500, there has been no fall of even 10% in the last 2 years.

Source: Rachael Shasha
Yet those indicators/rules would historically dictate a fully-fledged bear market. Add in the smoothed solar maximum timer, which now looks fairly definitively April 2014, and the continued levitation is even more surprising.

Source: Solen
Do the old rules still work? I still believe they have to. There are too many different angles amongst them for them to now all be redundant, even with central bank intervention distortion. But this really feels like the last chance for them to hold.
A selection of global stock indices shows what may turn out to be a long distributive topping process, if this isn’t to be a consolidation by time.
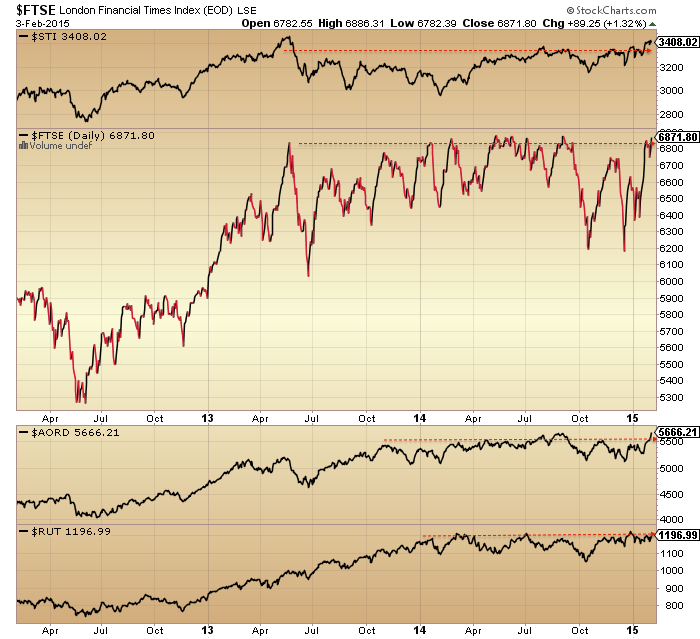
Source: Stockcharts
A selection of risk-off negative divergences in play for a year would echo this:
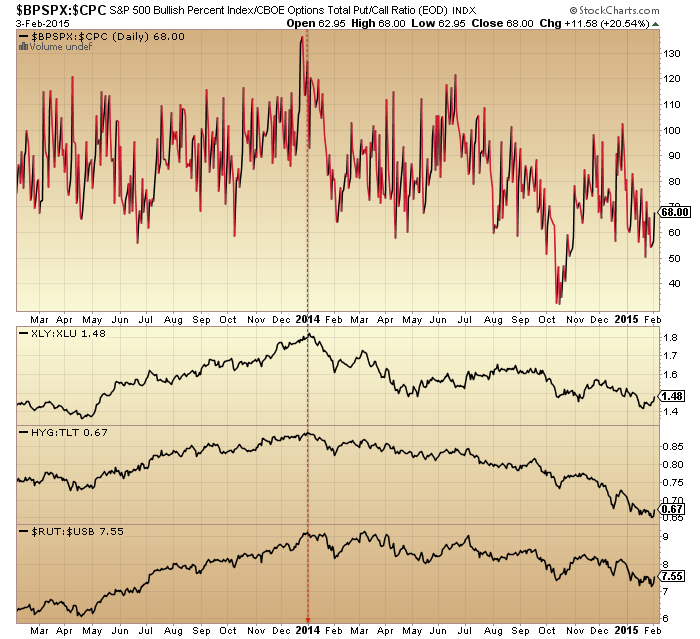

If we argue the correction or ‘bear’ has been by time not price then such indicators would now be poised to break upwards again. The problem with that angle is that there has been no resetting of allocations, leverage, valuations, sentiment and various negative divergences. Corrections by time gradually neutralise such indicators to refuel the bull, yet this has not happened.
 A look at breadth shows what appears to be an initial attempt at a stock market peak at the start of 2014, followed by a breakout to the upside. We have then had a second attempt at a peak in the last 6 months, but potentially NYAD is showing another breakout which would reset the topping attempt again.
 This would fit with developments in European stocks indices which are breaking out and look positively bullish. Potentially, the Eurozone’s QE and improving leading indicators could keep US stocks from falling significantly here in early 2015, as we could argue the US did for European stocks in 2014.
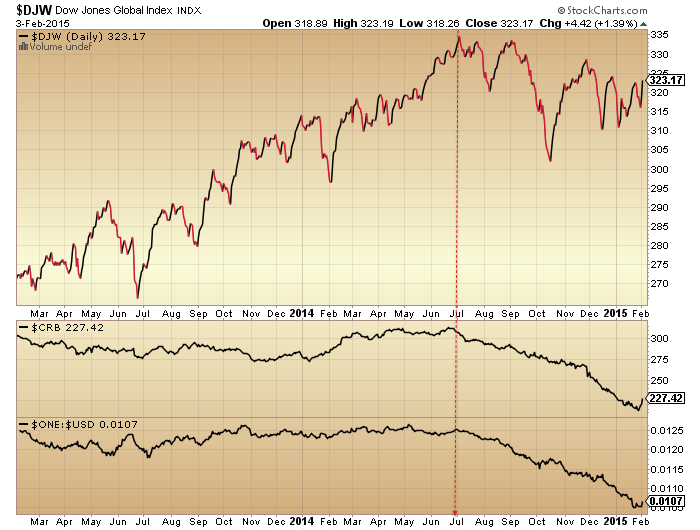
The big picture still looks like this: a definitive trend change in major asset classes in mid-year 2014. But we need to watch to see if the up-ticking of the last week could potentially spell a break from, or pause in, the downtrend.
 US economic surprises versus valuations looks like this. See how stocks largely ignored a breakdown in economic strength in the first half of 2014. Will they ignore the current trip into the negative? Also note how valuations have risen at their steepest rate since the October 2014 low: the move up in prices has been very much counter-earnings.
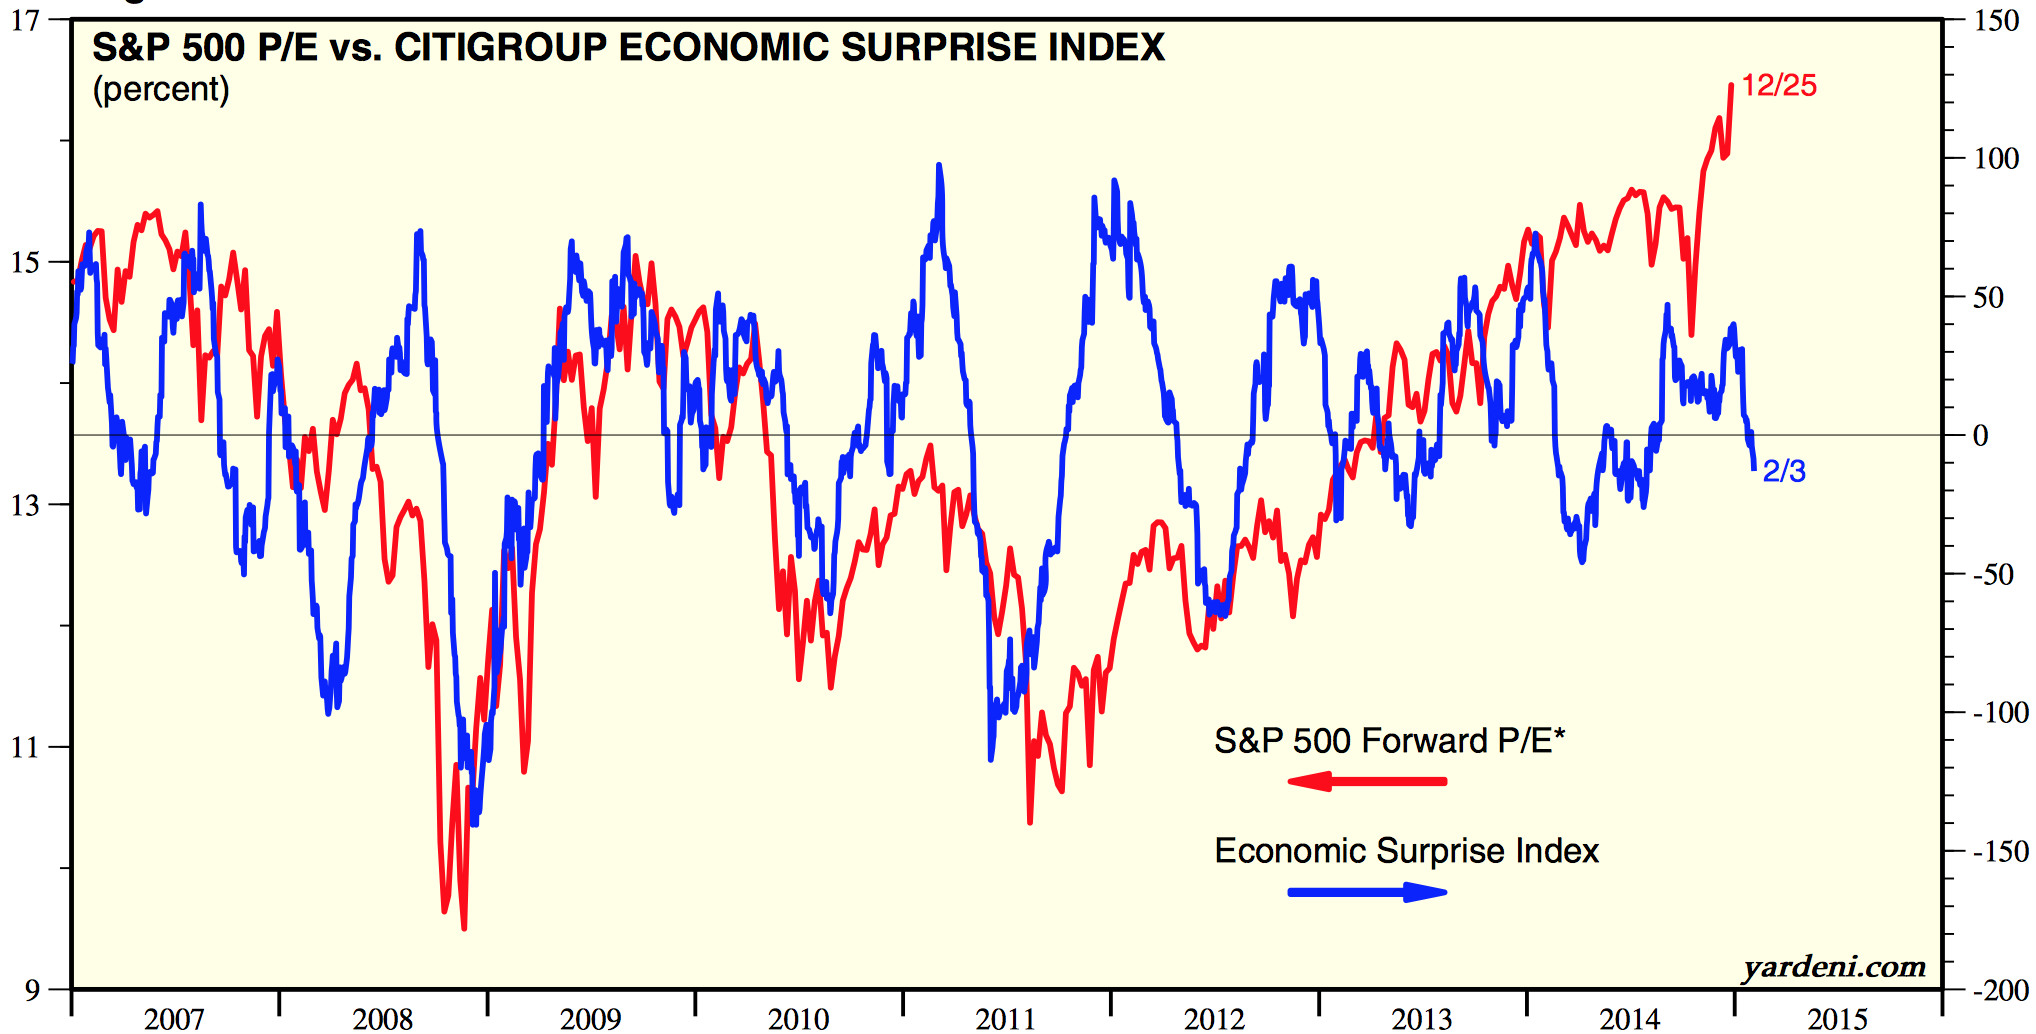 Source: Yardeni
Draw it all together and I still have to favour the ‘last gasps of the topping process’ angle. I refer to my 3 key dates of the turn of Jan 2014, the end of June 2014 and the end of Dec 2014 as they three key milestones in this, all anchored to the 2014 smoothed solar maximum.
However, if equities (meaning US equities joining European) and indicators break upwards again, then it would raise the prospect of a final blow-off top, a parabolic termination that could perhaps take us to mid-2015. I base this on the 1929 experience post-1928-solar-max, the failed topping attempt in breadth in 2014 perhaps failing a second time here, and the geomagnetic seasonality of the markets. Something like being here (circles):
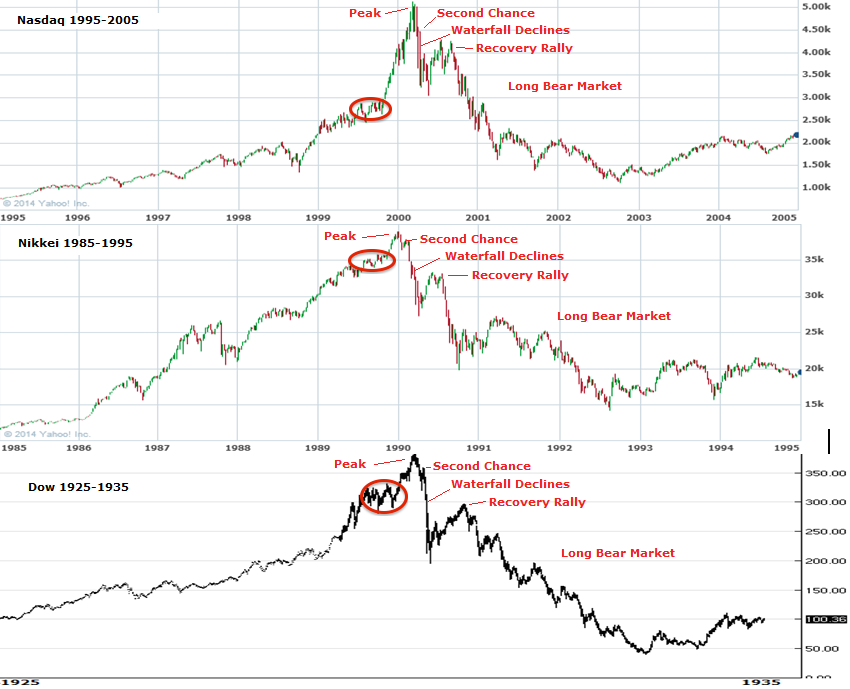
I just still find that very difficult to make a case for, given how super-stretched sentiment, allocations, valuations and leverage already are. From where is the fuel for another significant leg up?
The next few days are key. Did yesterday’s full moon mark an inversion top from which we now decline, keeping US indices from making new highs, whilst European indices in hindsight will show a blow-off top? Or do we now have a clear 2 week period of typical strength ahead into the new moon making for a comprehensive global breakout in equities? If the latter I would expect gold would be repelled downwards again.

German DAX.
daily:
http://stockcharts.com/h-sc/ui?s=$DAX&p=D&b=5&g=0&id=p09866691438&a=211163269&r=1423037936197&cmd=print
Weekly:
http://stockcharts.com/h-sc/ui?s=$DAX&p=W&b=5&g=0&id=p78617011065&a=378135729&r=1423037953056&cmd=print
THAT was my point. Not that your analysis isn’t sound nor interesting nor potentially prescient but that the conclusion was inappropriate given the reality of the market.
Fundamentals or solar moves are immaterial. The market price tells us what we need to know. IT is the sum total of knowledge and views.
Forecasts are just those.
Look for trends, topping patterns, reversals. Nothing else matters with regards to wondering what markets will do. They are interesting and helpful but not material.
Market price is the reflection of economic plans by the market participants which is information unavailable. Market price is weakly effected by numerous planetary, solar, and lunar patterns. To trade purely on market price is wasting a valuable tool kit of weak effectors (moon phases, tidal action (thanks Andre), planet retrogrades, moon equatorial crossings, etc.). These weak effectors when combined provide a useful outline of where price is likely to go, kind of a natural bollinger band that is foreward looking.
Burnell, agree with your view on that SPX level.
A close above 2065 then we are heading for new ATH,
that looks the only resistance left.
Setting up for new highs on the SPX, RUT and DOW otherwise.
Reblogged this on thedarklordblog and commented:
The QE fueled, blow off top argument gains momentum with the EU taking the baton!
thanks John
Hi john,
Re: Three dates – you say “Jan 2014, the end of June 2014 and the end of Dec 2015”
Do you mean Dec 2014?
Yes – sorry – corrected
A balanced view of where matters stand – thanks, John.
http://finance.yahoo.com/blogs/talking-numbers/the-correction-that-seemingly-never-comes-221403619.html
And some interesting thoughts here: http://www.athrasher.com/category/commentary/
2000-ish is not broken and results in a strong reaction.
USD is ready to lose some of is power and correct? in this case I can not see how stocks could go down.
The Federal Reserve and other central banks have made a mockery of the “markets.” End the fraud. End the Fed!
What is missing in your missives is…the impact of all the GLOBAL CENTRAL BANKS distortion…their own QE versions and the massive currency wars going on…best to think about and incorporate…else, you can be right, but long before your call comes, would be broke…funny monies abound…just look at China, Switzerland, Scandinvian countries…
That’s the big one on the other side of the ledger, yes.
Thank you John….n
Thank you John!
Biotech breaking down.
yes, misdirection and obfuscation working on the majority
dow up 600
but the real story is the parabolic ending in biotechs
if this holds today, you will know that “IT” has started…….finally
and $/Y unable to reclaim 117.8 which is the 50% fibonacci from 1990 high and 2011 low
high in biotech occurred end of Feb last year so seasonally we are in the window as well.
Since the Dow topped on Dec 26 last year, we have had a 1000 pt rally and 3 600 point rallies. Wow! To this bear it feels like we have gone up the full 2800 points, but we are actually down, lower highs and lower lows so far. When gold was topping in 2011 it had a series of sharp rallies. When oils was declining from $100, it had several $5 rallies. The nefarious purpose of these rallies is to scare all the shorts out, and to reassure the bulls. The market does not think, but it sure feels like it.
The credit cycle and the stock market. Low interest rates and low inflation are good for the market as we have seen. Inflation above 5% is bad for the market. Rising interest rate after a certain point is bad for the market. None of these have happened so what why should we be bearish? Our last chance is 5% rate of deflation. The drop in commodities has made me think this is happening now. It last occurred in1930 and 2008. Otherwise, the top could still be a ways off.
Hi ! It looks like John is finally giving up the bearish case and adopting my point of view. It’s still not too late to participate in this bull market. I stil recommend the same stocks: AAPL, IBB and QQQ.
The mkt performance certainly has demonstrated the importance of credit cycle and the CB’s importance. Deflation is the only thing that has overridden the current situation. Germany shows a clear break-out. Yet, the deflation rate is greater than 5% . Something has to give soon. Wall St. is all in on credit conditions. I doubt their algorithms factor in deflation so the smart boys may be needing another bail out. soon. There was the Peso crisis in 1994, LTCM, SE Asian in the late 90’s as well, plus 2008. Are we overdue? The rise in the $ and the collapse of oil signals that possibility.
Don’t forget that a rising dollar coincided with blowoff phases in the US stock market in the 1980’s and 1990’s.
The $ peaked in early 1985. One could say there was a blow off phase in 1987, but it was really the early beginnings of a great bull mkt and 2 years off isn’t close enough for me. The $ did peak in 2000 coincident with the blow off. I am using the US Dollar Index. It looks a bit different than the trade weighted one? But either way, they can go together or opposite and even uncorrelated.
people spend millions on cable tv for entertainment
i just come here and wait for the right post or two
best comedy available anywhere
I know! If we get a bear market its gonna get so boring when Nicolas disappears.
Nicolas may come back as a bear. He is a trend follower and he has been right.
Yes We Can
i remember one forum i used to post on 8-10 years back
most posters posted their actual thoughts and were somewhere in the middle
but there was one poster who signed up under two different aliases
he would take the most outrageous positions on both extremes
he was finally outed by the administrator and in hindsight we could have seen clues in his puncuation and capitalization tendencies
but he was responsible for some of the funniest postings ever
just random thoughts while waiting for something to happen (BTK breakdown)
itching closer to some resolution
Oh come on Newt! Even if he didn’t just post with hindsight, QQQ IBB and AAPL have gone nowhere in 2 months….? I think you give the troll way too much credit.
imho
J
Old rules: I fully believed that declining corporate earnings would affect the stocks.
I am surprised that market can stay levitated. I partially attribute this to zero cost of margin debt. With interest >0%, there is strong risk management needed for margin debt. Sideways or slow upward movement eats your profit. With zero interest, there is zero cost in margin even if the market goes sideways for a while.
Have exited long with .7% gain. Holding cash.
Lunar Chord:
Negatives:
Tides: falling into next week
Moon: full moon doldrums
Distance: apogee on 6th
Declination: today and tomorrow Scorpio (remember last month’s sting)
Positives:
Planets: mercury retrograde bullish until it ends Feb 10
Seasonals: positive all week but two green candles may be the main gains
Plan on entering short on Monday to eek out a few percent before new moon favorable days approaches.
Happy trading from the Valley of the Moon!
Market internal is resting similar to Oct. 23rd…while price up a bit to throw off the shorts and keep them frustrated. Tomorrow may be the break-out day. A hop tomorrow will likely result in new highs.
D.V.
declining corporate earnings do impact stocks,
however SPX mean earnings are not declining.
Energy yes, mean earnings are still increasing.
at 20x SP it matters quite a bit by how much those earnings increase not just that they increase
Phil, I should have been more precise: Q4 earnings were ok. The guidance for 2015 is the most negative in history.
http://www.newsmovingmarkets.com/2015/02/s-500-guidance-worst-in-recorded.html
biotech retesting parabolic break down levels. Down hard from here.
complete
What on earth?! Draghi doing something which makes the market fall! That’s a first. Has he changed sides?
all in all a very constructive day leaving the door wide open for the down-side bias: Biotech first break of parabole, Dax no new high, Yen breaking last uptrend line from the October lows.
Pegasus, yes agreed, however slowing growth
in the context of still rising mean earnings will
not cause the next bear market, the perception
needs to be that earnings are peaking.
You can still have severe corrections within this cycle.
My personal view is that we are very near the peak
in the current US business cycle.
Cute little Scorpion (moon) ouch!
Thank you John for another great piece of work. I also would like to give Andre a shout out. Your work is inspiring and admirable. I have your posts on the wall along with my EW analysis. It helps me tremendously…. You are a GEM on this board.
Me to erick…n Both
As long as some people are interested in my work I’ll keep posting. Really appreciate this.
Good luck John. The problem with crazy is that double crazy is still crazy. I hate to think those circles are where we are right now. That would be like 1961 Electronics Crash vs 1959 solar max. But we have come so far, I wonder if I should reset my Bayesian too.
It is admirable that John is not wedded to his view and is prepared to consider an alternative scenario, should that be necessary.
However, I still feel that the markets are living on borrowed time, and that the next big moves will be down to new lows.
If it helps at all, John Hussman still sees internals as bearish and valuations now worse than at any point in history expect the last bit of the dotcom bubble.
In his words ‘I can hardly bear to watch (what comes next)’
John, how does the sunspot solar peak chart you use compare to a similar chart based on solar flux? Perhaps solar flux is a better measure of the effect of the sun on “animal spirits”. Perhaps different measures of solar output have better predictive power than sunspot number as sunspots vary in size rendering the chart based on sunspot number misleading. I wonder if solar flux is more accurate to generally predict the market. I have read the Atlanta Fed paper on the effect of solar flares on the market.
This is by no means a definitive answer, but here shows the last solar max versus sunspots and flux – sunspots captured it to the month, flux 2.5 years out.
http://www.swpc.noaa.gov/products/solar-cycle-progression
Polar field strength for N hemisphere gave a +10 reading for 1/17. Maybe this time the magnetic flip will take.
Someone mentioned margin debt above…has anyone noticed how late they are at reporting December? It’s usually out the 3rd week in the month following (third week of January). It’s February and we don’t have it yet? Before Doug Short did his amazing chart correlation on it perhaps not many were noticing. Makes me wonder how bad the data is that they aren’t printing it?
http://www.nyxdata.com/nysedata/asp/factbook/viewer_edition.asp?mode=tables&key=50&category=8
Yes, still waiting for that
I believe those circles on the last chart were the ones I suggested here a little while back.
I have no inside knowledge but the thought was based on many cycles that suggest more like a Aug/Sep 2015 time frame for a top.
I am a little worried about the SPX pattern at the moment. I call it the 911 pattern as seen in the Australian market leading into the 911 incident.
After a top you get a lower double top with a double bottom as well.
Then you get lower top, a break of the double bottom, a bounce to the double bottom and then collapse.
SPX looks like it is working through the sequence.
A break above the LDT invalidates of course.
Credit to you Voltaire. I tried to find who had suggested it but couldn’t locate it on the site.
Looking through charts tonight, just not ready to call “the top is in” quite yet…
Futures are down at the moment, but still see another push to the upside ready to go….
Can’t help but think we’re getting close to a top though….
John lays out a pretty good case for it, and I think a substantial sell-off will unfold very soon…. Just not this week….
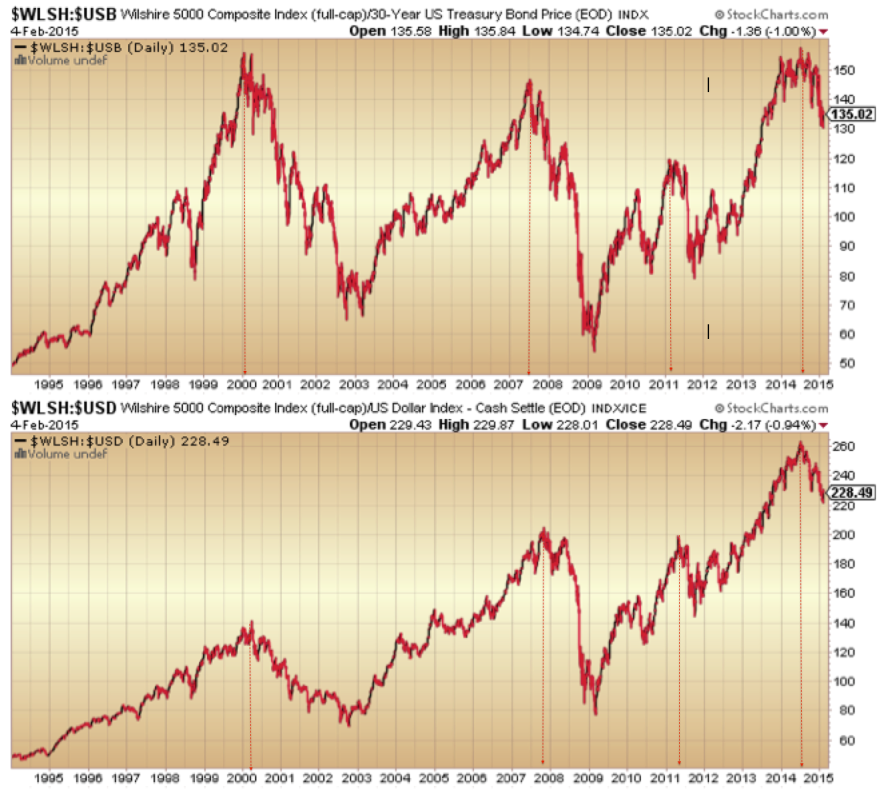
Still when we look at stocks:treasuries and stocks:dollar the top is unequivocally in. But the question again is are both risk-off measures still potent? Again I would have side with they surely still must be…
Thanks John. I am in little doubt that the trend has and continues to head down.
Daily trends on the US indices are now well in place and volitility is trending higher.weekly charts are rolling over as are monthly charts about to follow.
Resumption of down trend will resume at any moment following what was no more than a DCB off the 200 dma’s and test of the 50.
Deflation is about to change gears upward and the Chinese decision is yet another sign that liquidity is drying up fast.
Shanghai ended in the red on PBOC easing. Has the CB omnipotence lost its luster?
When you have your fill (and some) at a magnificent banquet and then the Chef announces that there are another 10 courses still to come…..all you want to do is throw up at the thought.
Jeremy Siegel says 20k DOW in 2015.
Thanks Mr Siegel
Listen carefully to the comments about US growth and the US economy holding up the rest of the world.
medianline traders call such a move ”going line to line”
http://stockcharts.com/h-sc/ui?s=$SPX&p=5&yr=0&mn=0&dy=20&id=p37081880646&a=338320968&r=1423139748291&cmd=print
per Voltaire but looked at with my tools
yesterday’s high was at MOB level
http://stockcharts.com/h-sc/ui?s=$SPX&p=D&yr=0&mn=3&dy=21&id=p11845898933&a=228973899&r=1423140139369&cmd=print
and those who waded through the work at the referenced slate pile
saw the classic red line green set trade trigger at the top…
using the tools. traders who wish to trade in line with John’s work were given a very low risk entry…. if it is negated, so be it
http://stockcharts.com/h-sc/ui?s=$SPX&p=1&yr=0&mn=0&dy=2&id=p97987838640&a=331273786&r=1423140472724&cmd=print
I’m glad you mentioned the ‘red line green set’ trade. Whilst I understand the ‘red line’ bit I’m not sure how the ‘green set’ was created in advance to know where the turn would be.
An explanation of that using your example from yesterday would be of immense help. Thx.
Actually I think I just ‘got it’. It’s where the price touched the blue median line set. Please would you confirm my understanding. Thx.
Interestingly price has just retraced back to the .886 (2051) level in pre-market. It will interesting to see whether it reverses here.
In any case one’s risk is limited to approx 4 points. That is very good.
slater9, I’ve been reading through your slate pile stuff and most things are falling into place. Thanks very much for all that info.
I trade the DJIA via Spread Bets in the UK and that is a 24 hour item like the E-minis. Since a large part of your strategy relies on gap openings is there a version of the methodology you could suggest that will allow me to trial the median line stuff using the instrument that I’m trading?
Thanks in advance for any pointers you can give me.
Oh no, another rout for the bears. Not so fast. Yesterday Nicholas was bragging about Apple, QQQ. amd IBB. Since the top in late Dec, up slightly, down slightly, and up nicely (live by the sword die by the sword.) respectively. Today’s jump has not regained yesterdays high range. Of course we could break out from here as Germany did, but this is very similar to 2007 and 1980.
Another thing to ponder…..USD is now impacting the US hard!…….however the Renminbi peg to the dollar is hurting the Chinese far more……..I smell a devaluation coming very very soon!
Shorters getting skinned alive yet again! Shorters will have their day within the next decade!
DV, in terms of your previous comment on guidance,
yes I agree.
My take is that we are very near the cycle peak,
I have mentioned the end of Q2/3 2015.
If guidance began to tick back up I would need
to alter my view, that looks unlikely.
The key to major declines is a shift in expectations
to earnings having peaked, or about to peak.
We are not quite there yet.
Once that begins to take hold the door then opens for
large scale rapid declines.
Outside of this the market can still correct on sentiment
swings, however in terms of the next bear market then
that’s inextricably linked to weakening earnings,
not just weakening guidance.
Weakening guidance is the foreshadow to peak earnings,
which is why volatility is beginning to rise.
GLA shorters. I’ll be back on this thread once we show the slightest sign of a prolonged downturn (none of this 5% drop and recovery within a week rubbish). At the moment there is none.
One can observe $NYHL to spot weakness.
Market Internal very similar to Oct. 24…a close above yesterday’s high and a drastic improvement in NYADV would give longs a commanding control.
second chance
my work says the second chance is NOW

however, with the nonfarm payrolls numbers tomorrow, it would be wise to wait with the call until tomorrow…
This is what should be going on
What about the PPO bullish cross you are showing?
right now everything syas buy. I am forecasting it will change within a few days. Question is whether we turn here at top of the range, or we get the breakout, which in turn could(should) be a fakeout 🙂
To follow janbenestad here, you know things are going good…..~real good~……when Nicolas, Krish, and Newt are all out yakking at the same time…
Words to the wise…..
“Sell 30 April at 142 !!” 🙂
Let my own action speak for my long term thinking. I sold 50% of my STOXX 50 bought in Sept 2012 at 2,500. 36% gain. Buy low sell high.
I think Europe’s trouble will come back big time by later this year.
economic stagnation, high unemployment, low inflation and high debt…you kidding! ;)) Will sell the other half soon.
buy oil (low) now and sell high later.
Janbenestad is right. Tomorrow will show a high, driven by a tidal inversion on Saturday combined with the Sun-Jupiter opposition. Also, heliocentric Mercury trines pluto and is inconjunct Uranus, thus activating the uranus-Pluto square. Reasons enough for an inversion tomorrow.
But Monday will give another tidal inversion and the moon will be inconjunct Mars, creating a low.
Everything screams Tuesday. Last weekend I gave a crash alert. And it will start on Tuesday when Mercury turns direct, together with some other things I will talk about next Sunday.
Anyway, be careful going short tomorrow and keep your stop tight.
Thanks, Andre’. Glad you are including planetary positions in your analysis.
Barry, thanks for the summation
Hi Specie… I knew you’d understand…. 😉
I think we’re there… Maybe tomorrow, but I think we’re there…
BABA continue lower while NBI back-testing broken ending wedge. Very speculative end of the market showing signs of weakness.
Momentum junkies have not made money in Biotech since early Dec – getting itchy
I’m not worried about my positions one little bit. Global distortions are now excelerating by the week and for those that care to look through the bullish speak you can see things as they really are as I am sure many here can.
I was just going over the latest US data releases and it is an unmitigated disaster!
And yet………as was the case in 2000 everyone has their heads buried to the hilt in TA and nobody can see the train coming head on toward them!
Hi all ! Another great day. I still don’t understand the shorts. Rates are so low they are even negative up to 10 years in Europe. the US 10-year treasury yield is at 1.70%. Stocks are really the only game in town. Where would you put your money, a 10-year Swiss or German government bond at -0.75% per year or in stocks ? Shorts have still not figured this out and this is why they are loosing money hands over fist.
Nicolas do you understand the implications of delation and can you even see the signs?
And….BOOM-Shaka-laka…
There you have it, folks…. ~Analysis~ of the times…. *big sigh*
This can not be a real person. I call BS on this. Is that you BBE?
In fairness to Krish he is looking
for an interim trend change rather than shorter term
set ups, which are great if you are adept enough to
do that.
This looks like a move towards
a break out to me, unless we sell off
towards the close tonight.
RUT over 1200 atm and within striking distance
of breaking to new a new ATH.
I appreciate there are always multiple different
way of interpreting price data, the huge breakout
in the DAX is still not accepted as such by some.
http://andrewunknown.tumblr.com
Andrew is quite good.
Oh, and for those few that even know what “Sell 30 April at 142 !!” is referring to, I salute you as the true market veterans that you are…
And if you’re here, you’re still in the game…
Seriously, well done… With much respect….
Barry
Can’t believe I watched that again the other day
Mostly just the scene in the pits
I understand the pits are closing forever
I love speaking in code
Resilience is underrated.
WTH is Elvis anyway?
Russell 2000 is higher than all of 2014, except for 12/2014. This makes those circles seem likely now, and I fear a parabolic rise of crazy.
Biotech should be repelled here if it was a break of trend
A s/t pullback is expected from weak employment numbers to delay the top of my SPX target 2075+ from Jan 29 to the next Bradley turn date of Feb 12.
https://solarcycles.net/2015/01/28/charts-updates/#comment-47851
Nice call last week, for a rally, BTW… Well done..
Hi ! I just wanted to congratulate all longs for a good start of the year. 2015 promises to be another stellar year for longs, even better than 2014. I am sure John will soon drop his bearish outlook and join us on the long side. I will repeat what I said before, this is by far the easiest market I’ve seen.
Hi Allan…
Well, couldn’t get’em down to $2.75, but just bought a slug at $2.85….
Thought VIX would be down more this week, but it really didn’t soften as much as I’d hoped for…
Regardless, we’ll call it “Mission Success”.. 🙂
GL to us both…
SP500: 666-996-1200-1366-1531-1736-2065
It has to soon break violently downwards, or manically upwards.
Monthly sunspot numbers (ISN) are still up in their plateau; and the northern magnetic field strength is increasing so tentatively that SC24 max is sure to fade away only very slowly. Northern hemisphere sunspots are likely to either remain persistent, or even increase temporarily, during the next 6 to 9 months (judging by SC24 performance so far).
Even if ISN (“Ri” in the graph below) has been in a downtrend since early 2014 (which is arguable, since the figures don’t follow obvious trends especially in weak solar cycles) then a simple extrapolation shows that ISN will not drop out of its plateau (the most consistent marker of speculation peaks in previous weak cycles) until late 2015.
Well folks we are about 1% from ATH’s at the close,
so if you subscribe to the 2014 US market top
rational, it’s make or break right here.
Either it’s repelled or the case is lost.
Margin debt figures, virtually unchanged.
http://www.advisorperspectives.com/dshort/updates/NYSE-Margin-Debt-and-the-SPX.php
The Dow Theory is now flashing a ‘sell’ signal
http://www.marketwatch.com/story/the-dow-theory-is-now-flashing-a-sell-signal-2015-02-03?
Thanks all, new post is out