
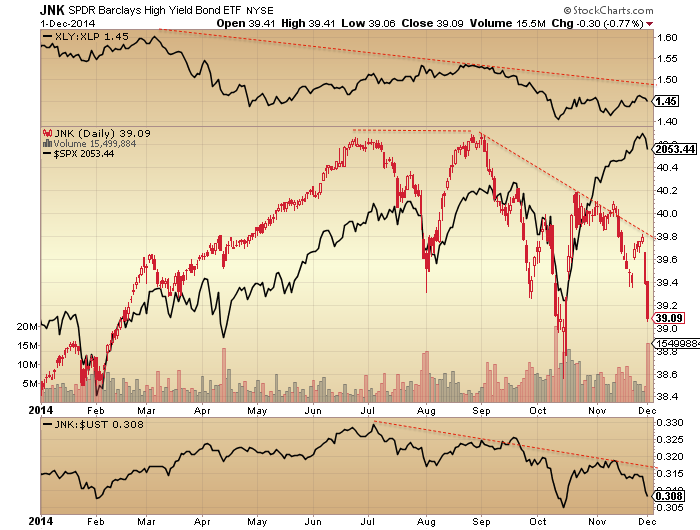
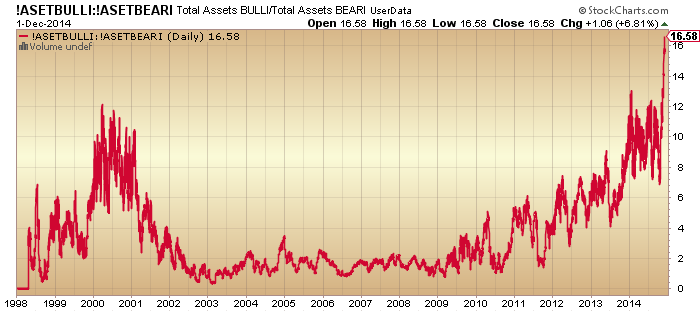
Oil plunging. High yield dropping. New all-time lows for bond yields in many European counties and Japan. Gold and silver major reversal. Apple large down day. Crazy spike in Rydex allocations.
ECRI leading indicators for the US negative. A combination of oil price drops and US dollar gains adding to sharp earnings projections revisions. On Sept 30th, earnings growth for Q4 was projected to be 8.3% and revenue growth 3.8%, but now these are more than halved to 3.8% and 1.5% respectively.
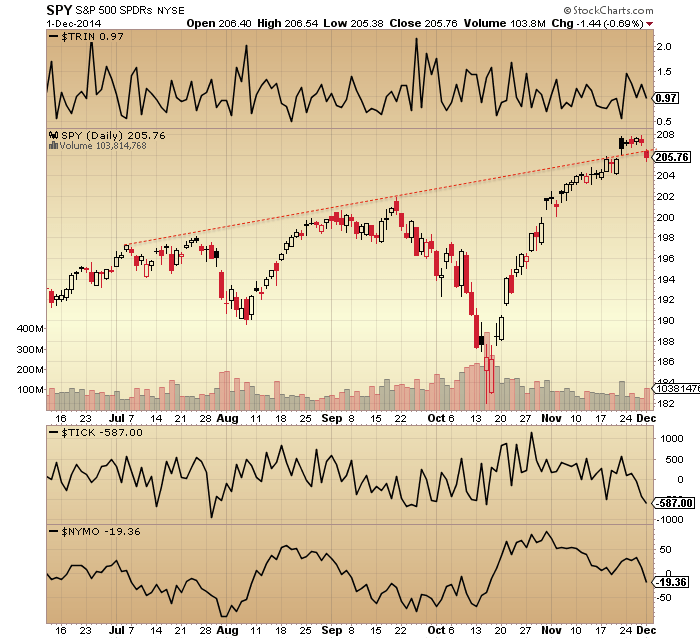
SPY looks like this:
 Source: Stockcharts
Currently an island/overthrow top. But now we need follow through.
The Russell 2000 looks like this:
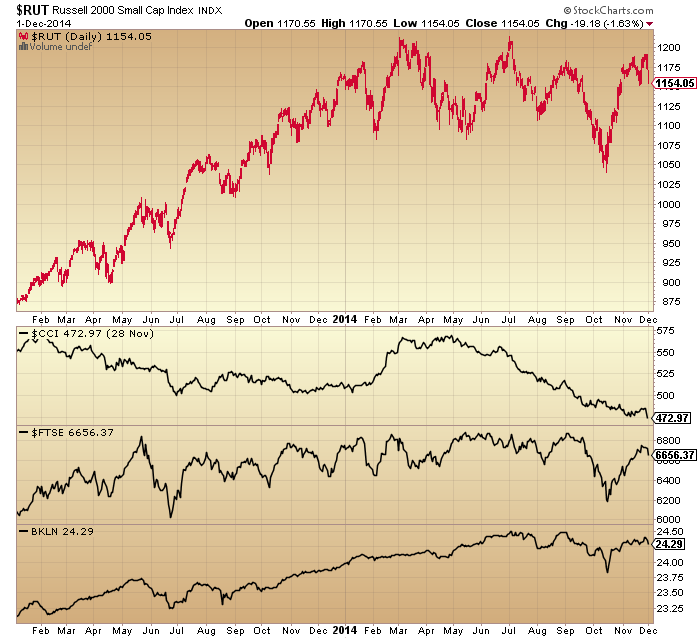
Repelled at a critical point. Same for the FTSE shown underneath. If these indices were to maintain their 2014 topping processes then they couldn’t stretch much further upwards.
Indicators largely rolling over again, also suggesting equities turn here.
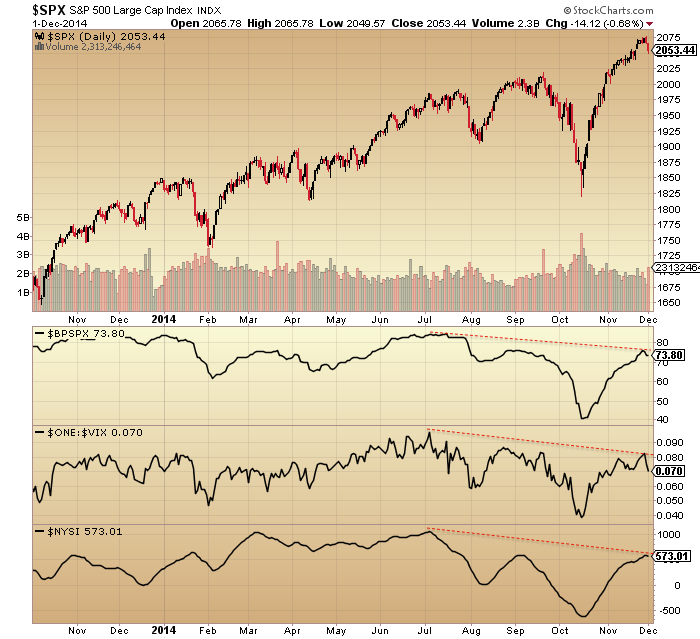
So it seems like indicators and cross-asset developments are turning the tide on equities just at the critical point.
I believe it comes down to how the price process now plays out. As previously noted, we might see a price range play out from here on divergent momentum which could hold equities up into late December, or we might see a more straight forward reversal from that island top / megaphone overthrow and print a significant down month for December.
We don’t yet see a significant reversal in the US Dollar, and the Indian, Japanese, Chinese and German stock markets are still motoring. Plus, Apple and the Nasdaq 100 reversal candles yesterday need follow through. So these are the threats, but it may be the point at which US equities start to lead to the downside.
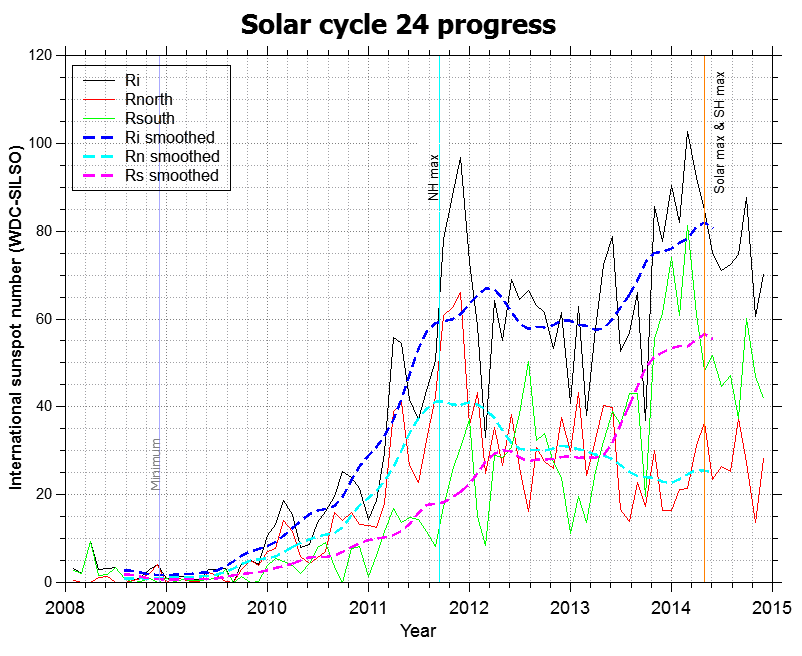
Commodities started plunging in May 1929 and forewarned of the stock market woes (hat tip Edward Dowd). They began to tumble in May of this year too. Some are quoting oil’s fall as a stimulus, but it should be clear from associated developments in government bonds and the USD that this is a deflationary wave more in tune with 1929. But this doesn’t pin down when equities might tumble, only that they should be on borrowed time. The latest sunspot update suggests the same:
With the story of the topping process in stocks (which I have laid out in detail on the site) revealing a kick off Jan 1st 2014 and an intensification from the start of July, I maintain the probability that stocks are completing their topping out now, and keep a lesser likelihood as the end of December. Given the recent cross-asset developments in gold, high yield, government bonds and oil, I don’t see a stocks bull market extending into 2015. The Rydex allocations spike looks fairly terminal too.
The situation is fairly delicate at the moment, as a little more craziness can’t be ruled out. So we need to see a follow-though day to the downside. But I believe we are into the final price manoeuvrings before the heavy falls finally come to pass.

Thank you John. The markets made a new Hindenburg Omen observation on Monday, indicating their instability. It is just a matter of time, either soon or rolling over in early 2015.
Also on Friday in Russel http://www.financialsense.com/contributors/chris-puplava/hindenburg-omen-black-friday#.VH1TAhHl7Hw.twitter
“Beat Market Bottom” points towards an American tulip phase in US Stocks. As one sector after another rotates into US Stocks the rally will continue and accelerate. This is the irrational phase wherein Small Specs get whipped out for being unable to stay financed against the irrational hyper parabolic rally caused by all sectors rotating exclusively into US Stocks. This rally won’t stop until the FED raises rates next Fall, 2015. P/E ratios no longer matter as “hope springs eternal” with no Fear and its Panic Selling in sight.
It may be difficult to understand but ever increasing Polarization in America is feeding the rally in US Stocks. “All” are attempting to become the “1%”. Until “All” come to grips with the fact that they can not become the “1%” the rally in US stocks will not end as there is no Fear in sight that would cause Panic Selling. For now, –Hope Springs Eternal– that “All” will join the ranks of the “1%” if they do not Panic Sell but continue to BTFDs.
You seem to know it ALL and have ALL the answers. You even seem able to predict the future!!!! You must be very wealthy by now.
How could I possible ‘know it ALL” given that I went short DOW futures two weeks ago and offset last Friday near the Monthly close at a lose? I am successful not because I trade perfectly but because I trade in a disciplined manner by cutting my loses short and letting my profits run. There are Traders who are successful even though they call the markets correctly only 20% of the time meaning that 80% of their trades are losers. Why? See above adage for the “why” of their success.
Note that if you have been following what I have been posting about stocks that I positioned based on a Weekly expectation leading to a Monthly expectation and that Neither occurred so I did not wait for my Stops to be hit but got ought AT A LOSE just minutes from the MONTHLY CLOSE last Friday. That I could have waited and got out better yesterday is of no consequence because I am successful BECAUSE I AM DISCLIPINED.
Note that I recently posted that Cattle could experience its Tulip Mania phase too. Last Friday I went long cattle futures (BTFD) and yesterday Feeder Cattle futures closed limit up and within minutes of this morning’s electronic trade it went almost limit up.
Yesterday I went long Oat futures (BTFD). Take a look at March, 2015, Oat futures for the past four trading days and note the three candle stick tails. Note that yesterday was the lowest close but also a Hangman candlestick. Note that Wheat futures are soaring and note what popular human breakfast meals are made of.
Another oops: “Bear Market Bottom”. Sorry about that.
What’s happening, John. I was getting worried about you, health wise. Summation index has given a sell signal from several megaphone formations. It should be a significant fall here. Even the a/d line is turning down from a megaphone and the OTC line has non-confirmed the OTC. It’s all there, now it just has to happen.
Thanks Kent
HOPE SPRINGS ETERNAL. In America, it is being forecasted that December will be warmer than average. That means that the Weather will not drop the velocity of money but allow it to rise especially given the expectations of dropping gasoline prices. HOPE SPRINGS ETERNAL at least in the minds of those stock buyers who envision themselves in becoming the “1%”and, therefore, they will not panic sell out of their highly leveraged positions but add to them by BTFDs.
The FED is unlikely to raise rates in 2015
as growth slows.
This is not some tulip mania, it is late
stage cycle price action.
The US markets will turn when the perception
beings to anticipate the turning of the earnings cycle.
IMV there remains too much momentum left in
domestic US (and earnings)for markets to trade
decisively lower right now.
A continuing sell of in crude could possibly rescue
the bears by beginning to quickly erode confidence,
however on my take we are still months away from that
point.
Richard, I’m probably the most mega-bull here, thinking the DJIA will reach 75K by 2032, but we are in for some volatile trading from now into 2017-2018. There will be some peaks and troughs along the way. I have us in the first wave up off the 2009 low. This wave will be retraced in a second wave probably kicking off in the fall of 2015. Then we will see the huge, multi-year, “tulip phase” move up after that period if my cycle and EW analysis is correct.
I just try to stay with the daily trend and capture as much of the gains as I can.
http://unbiasedswingtrades.blogspot.com/2014/12/swing-trend-indicator-timing-for-2014.html
That 2032 target ties in with the 17-18 year cycles that have been evident since at least 1929. Aldo ties in with Armstrong’s private wave, as money flees a government bond bear market into private assets.
I won’t be a broken record, but there’s only one way we get through 2015-17 and out the other side, kicking off a new growth cycle. That’ll be the same way we did in the 30s ant again in the 70s, devaluing everything against gold.
Nothing new under the sun my friends.
This fits nicely with Jeffrey Hirsch’s Almanac super boom trend beginning in 2017ish.
I only found out about this site when I stumbled on to it this summer as I was doing further research about the weather in order to trade commodities better. Many on this site know about the solar barycenter rotating inside the sun and before the top of a SC and that means a coming Little Ice Age. The depths of the coming Little Ice Age is expected in 2030 which wouldn’t fit well with you stock market mania top.
You might also want to find out about the complete Sun/Moon/Earth interaction of every 19 years 5 hours and what that means to stock crashes. The next 19 year crash will be in 2025.
You seem unable to grasp the political/democratic reaction to a mini ice age, or just the end of the confidence in government finance.
Money will flee into private assets, there will be nominal growth, although probably not real growth.
The era of big debt- funded government will end, but they will go down with all guns blazing and capital will seek safety in real assets, including stocks.
histiry repeats, including the risks of conflicts as empires die.
SPX top predicted Dec 30th at about 2105. The astrological basis explained : http://satsirikhalsa.com/articles/effective-use-of-the-varshaphal-and-lets-pick-the-market-top/
Still short here 🙂 But from what I gather we start the day up, another opportunity to add up there.
John, the sun still seems active here, both visually and with flux readings. 27 day forecast was boosted up.
http://www.wm7d.net/hamradio/solar/27d_forecast.shtml
Any thoughts on this?
If forecast month plays out, the mean flux would be 176 making a new solar cycle 24 monthly high.

Yes that’s the flux chart I had seen which made me doubt the relevance of flux versus sunspots as flux peaked late 2001
Maybe the flux peak lags ssn because sunspots appear at equator at the end of the cycle, and readable emissions are directed more at earth. Just brainstorming.
Mkt had another BIG high May of 2001…..As good as any other place to sell…..you can’t fight the mkt month after month…..seems to me you are talking and trying to support your short position……
Interesting…would that be a double top with 1/2014? Light therapy affects moods, so it could be why we are peaking late this cycle. Yes, 2001 was different, but with one data point, we don’t really know the mean and standard deviation.
Bond yields paint you the 2015 picture in advance,
or at least to a large degree.
Many of the points made here by both John and others
are valid, unfortunately it looks like the timing will be out.
As this is an exceptionally difficult area in which to be precise,
there is no shame in that.
The uber bulls see 2/3 years left in this cycle,
that just does not ring true to me.
We are likely to be in an early stage bear market by
this time 2015.
Phil, what about the oil train? Doesn’t that paint a picture…..now? No more funny money to prop up oil from speculators and since the world is broke those energy savings aint gonna be reinvested into the economy like the 1990’s. Hence, you are see true organic demand and the state of the economy.
Spiral update just tweeted https://twitter.com/mjmateer
Still has a ways to go… adding along the way. Nice opportunities in the yen crosses today.
Can’t really use technicals nowadays can we, look at the USDJPY USDRUB, especially the latter, huge shooting star and today new high again and ruble crashes and burns again. How do we trade these markets? I am rather jaded.
VXX rising putting pressure on SPY…
Crash in Stocks keeps becoming less likely:
http://finance.yahoo.com/news/u-construction-spending-posts-biggest-150248752.html
Yesterday the agencies loosened their lending rules for the US housing market. What that means is that the rally in housing could be over BUT it also means the Speculators in housing will be able to sell at profits. Those Specs will be looking elsewhere to invest in and that investment will be US Stocks. This is another “sector” that is starting to “rotate” into US Stocks besides the ongoing “sector rotation” out of bonds into stocks.
Most of the third world is based on commodities. With commodities falling (except for US cattle futures which are the exception to the rule) world wide investment money in world wide commodities will “rotate” to US Stocks along with some of it going back to Japanese banks in a reversal of the Yen carry trade.
As time advances more and more “sectors” will “rotate” to US Stocks that will feed a rally into late 2015 when the FED is expected to raise interest rates. That P/E ratios decline doesn’t matter as long as Profits exceed all other returns such as interest rate returns. That means that Profits can decline (2015) from greater Profits (2014) but stock prices keep on going up.
It is continuing reports like this that keeps the Hope Alive. With out Fear there will be Panic Selling regardless of the amount of leverage. The Riots didn’t produce the Fear for Panic Selling so what will?
It is becoming obvious that Stock Buyers are in a “climb the wall of worry” mood that just keeps stocks going up with no panic selling anywhere in sight. What that means is that any “worrisome” things/events/INDICATORS are just blocks in the Wall of Worry to climb over.
Anyone catch the great ftse long today? I managed 80 points 🙂 slowly recovering my silly bear losses of earlier this year. Ftse to 6900-6950 by end December me thinks. All indicators point to a fall but the market is unstoppable. Oil stocks recovering hugely today suggest the market expects oil has bottomed.
Congrats on your trade Krish.
Thanks. It was a rare one for me. Normally exit too quickly. Long way to go to recover my bear losses though!
Yes letting your winners run and cutting your losses short is a HARD trade!! Speaking from experience here although hopefully changing my habits one trade at a time.
Nigel, you can reference oil and a range of
commodities which underscore a similar outlook.
I have mentioned oil a couple of times recently.
All this is unlikely to be enough to save the bears
in 2014 imv, the key is the US earnings cycle and
lower expectations within a continuing rising trend
will not be enough, the perception needs to be that
earnings are about to turn lower to unlock the next
bear market, this is most likely 6 months away approximately.
Tomorrow is the last day for a turn. Then down into January 30th.
Andre,
Could you elaborate a bit on this? I had thought given the extreme roc in apo/perigee that late January was more likely to be a high of some degree? As you had been calling for previously.
And if January 30th is a low, then what do you think for the next extreme roc date in Late April? Low or High? There is a big fibo/geo date around 4.27.15 that seems to align for a market pivot.
Thanks.
you’re saying we go down from here and continue lower for the next two months?
I see a major low on January the 30th, with a first stop on December 19th. After that a significant high in the last week of August, with a minor high end of march and a minor low early June.
Gravity makes a multi year turn in December. Solar activity stays positive into 2015 as Neptune is heading for an opposition with Jupiter and Saturn towards a square. This is scheduled for September. After that solar activity will decrease. With gravity down august will bring the high and after that some years down.
If the august high will be a new ATH is uncertain due to gravity. But a severe decline will have to wait until solar activity turns in sync with gravity.
Need to clear up what u r saying. First top for ‘a’ low 12/19/2014 then 1/30/2015. After which a further minor high end f March 2015 to a important hi end of aug 2015. Do I read u right? Thanks, libadvsor
Do you have a sense of the minor high between 12.19 and 1.30? I have 1.12-14 and wondering how that fits with your work?
Thanks
What’s unclear?
Main structure : jan 30 low, august 22-ish high. The move down into january will be a 3 wave; down, up,down. First low december 19. The next date will come soon; probably early january.
The move up to august is also 3 waves; but they take longer. march 30 high, june 2 low, aug 22 high.
There will be minor subwaves everywhere, but I think this is the main structure. I combine solunar force (not the same as apogee/perigee), solar activity cycles and my own astro timing.
Andre,
For what its worth I do timing work with spiral analysis similar to Carolan. My dates, at times, are very precise. One spiral ….48-78-127…. (in trading days) is an example that you will find has been very accurate recently. And 127 projected from the 11.28.14 high out gets you to 6.2.15.
Looking out into 2015 my work suggests big pivots near Feb. 6th, March 24th, June 2nd, and August 14th. At least when looking at dates that resonate with your scenario.
Also, the 78 trading day period is generally near 112 calendar day which fits with the 108/9 day cycle that you have spoken about.
We’ll see. Thanks for your work.
Anyone who is short US stocks needs to wise up and fast. The last two day’s decline in treasuries exceeds the rise going back for many days –and– the US Dollar index is rallying all over again. This means more “sector rotations” into US Stocks. Yesterday’s one day decline is it. That is all she wrote. Rally time in US stocks has restarted.
If I am correct about this then my offsetting my shorts near last Friday’s November monthly close is going to look vey professional and wise on my part. Those of you who start Hoping beyond reason that the Top is in, as prices keep going up, will be undisciplined in your Stops (if you even have any) and will suffer devastating loses. Above all else, success in trading means success in keeping loses small.
Richard you seem to have gone from someone who had quite interesting macro economic ideas which were appreciated by most here to becoming a somewhat ‘forceful’ advocate of how we should all trade. Chill please. We all ‘know’ our own trading strategies. Thx.
I don’t want to see people on this blog get financially wiped out which is very easy to do especially given the heavy commitment that a major top is in (betting the farm) with a major decline to follow should it not happen. I think that John’s report a few days ago “Bear Market Bottom” needs to be reviewed and built upon for a clearer warning of what could go wrong and/or what is brewing to drive stocks much higher.
Should yesterday be a one day decline and stocks continue higher it will be a very big blow to many who are heavily committed to the short side.
With respect, no don’t need to try to save other people from losing their money. I bet the viewers/posters here are all big boys and they can deal with their own conviction and losses.
Share your market view here. It is good enough.
Please remember. No one has a crystal ball.
Richard Issacson is the new Cramer and Gartman.
Hahahahaha! Now that I know I know what to do. Thx
Sorry there needs to be a comma between the first ‘I know’ and the second one. I’m sure most of you got that but Mrs Cooper, my English Language teacher would have been horrified. Lol.
At least he is not the new Elaine Garzarelli.
IMO short term indicators leading to possible price acceleration upwards until Friday with outsized sell off next week. Opinion based upon Solunar chart on Time Cycles Research.com, declination to North on Friday, seasonals, and todays price action. Next week has weak seasonals first three days, full moon(weak until 4 day after) on Saturday, apogee(weak days prior) next Friday.
Today: Up, Wed: Up, Thur: Up, Fri: Up
Next Week: Down all week.
Betafish that’s quite a compelling list for next week. Thx for the info.
Yes, I have found that the first three trading days of the second full week of every month are negative. Also, the three trading days before and day after apogee are flat to slightly weak over many time cycles. The days after full moon are usually flat to slightly weak. Combining all three points to a weak second week of Dec.
Richard,
with respect you do not need to resort
to caps lock to make a point.
If you are long and happy with that position then great,
no one needs to be bludgeoned in to sharing that position.
You did the very same when short before a rapid about turn.
Some of us have had the same opinion for months,
long is usually the winning trade in a bull market.
Where did he caps lock? When you say caps lock, I expect to see something like this: YOU DO NOT NEED TO RESORT TO CAPS LOCK!!! I don’t see anything like that in any of his posts.
I do see an occasional word whose first letter is in caps. I presume that’s his way of adding emphasis, which is something virtually all of us do in conversation via tone of voice, etc. We don’t have access to underlining or italics in these comments, so caps are the only way we have to emphasize a word.
We could be entering a period similar to early Sept. which saw 4 whipsaws in a row. 2 days down were followed by 2 days up that then reversed, again and again. Eventually the trend became visible, as each whipsaw did not regain previous highs. The market finally succumbed after the 4th whipsaw.
The swing trend indicator is still on tentative sell, but it did whipsaw March-April 2014. Could do the same here.
So, I’m selling into this rally today. If the system flips back to tentative buy, I’ll close shorts and go long.
look to deceasing $NYAD cumulative for clue.
Newt. – Need to break the 13dma Chart idea courtesy of SoulJester
http://stockcharts.com/h-sc/ui?s=$NYAD&p=D&yr=0&mn=7&dy=0&id=p44883089207
Bounce of it today is not good for bears.
$NYAD cumulative, A drop below the center line of the Keltner Channel is a pretty reliable sell signal.
Keltner signal seems a little slower http://scharts.co/1ycAFRg
Ah! We see the same chart. No sell signal in my book. I also use 5 EM to draw my fans.
OPEC –can not– outlast low US crude prices:
http://www.marketwatch.com/story/opec-is-wrong-to-think-it-can-outlast-us-on-oil-prices-2014-12-02
Also, US shale oil producers won’t be crashing into bankruptcy like many suppose nor crashing bond and stock markets like many suppose.
Understanding current “market conditions” the meat of this article points to no stock market crash at this time but a rally in stocks to resume. For that purpose it is one of the best articles I have seen.
The first word of the article is “Opinion:…..”. one man’s opinion.
It will take time to reveal the cause and consequence of the oil crash. No rush. I’ve bought my first position of the strongest… could I be wrong and better bargain ahead? May be.
Today’s US auto reports point to this mania being like the 1920s and not the 1930s:
http://finance.yahoo.com/news/gm-s-smokin-sales–obama-aids-taser-and-biogen-idec-attacking-alzheimer-s-171527310.html
Euro/Yen lower high not confirming equity highs – 72% retrace from first move down with today’s action firmly bearish. Keeps bearish aspirations alive and well.
What is up with the USD/JPY? I thought we would get a reversal by now.
going long or short a yen carry trade, one needs to differentiate which currency you are trading relative to the yen, it is not like the old days where any of the yen carry trade will more or less move in the same direction. all relative to their strength or weakness against the us$ now, things are more complicated these days and if it wasn’t difficult enough before…so many cross currents, learned it the hard way.
$ index at critical juncture – fail or break through – reason for vol in commodities as players position according to what they think the outcome will be. Euro looks to have a little more down-side to 1.22. Yen not so sure.
if you look at the rsi for the weekly US$, major divergence, in normal times i would position to short but…i just try my best to follow the trend and hope i make a few pips even when technicals tell me otherwise.
strong $ index resistance going back 10 years
http://www.investing.com/quotes/us-dollar-index-advanced-chart
Pegasus, are you trading the yen (long or short) and if so which pair? I’ve gone in and out (mostly long) on the US/JPY
Thanks
James – have a long yen short $ position and short $ stocks – financials and tech. Not nimble enough to catch smaller moves but hope that on the way down can catch 1 or 2 counter trend moves. $/y has clear topping patterns here and is quite oversold. A reversal like in 1990 or 1998 or 2002 can move the pair down into strong support in the 92-94 area in 3-6 months. That is what I am looking for.
John, agree that Oil is crashing. So has gold. Is there a chance that Gold/Oil is the solar max crash, just like 1980. The stock market did not crash in 1980, but did have a correction. Why not the same this time around? SPX drops -20%, but in hindsight, the mania/crash is in Shale Oil and Gold.
Your own “trading-the-sun.pdf” says that 2013 should be a commodities peak, not equity peak. That was right on with Gold and Oil. Shorting those would have worked very well.
The closest analog I can find based on a variety of sentiment and technical indicators is March 2012 following a rally of over 200 pts in SPX from end of Dec 2011. Then we saw a triple top – early in month, opt exp, EOQ, where each top showed a higher high and low. I would expect similar outcomes here.
Bad news for bears. No sell signal on options indicator then or now (yet) so only a 7-8% decline followed. Correction would only be to SPX low to mid 1900s then a 300-400 pt rally.
18k dow very soon….santa rally might bang us up to 18,500
Krish, everything you say CAN happen. However it doesn’t hurt to keep things on a VERY TIGHT LEASH!! Good Luck to all here.
Everyone just loves taking a stab at predicting the future so they can have that I told you so” moment. Huh?
On the contrary Ronbo. Most people who take a stab don’t follow up with ‘I told you so’. That’s one of the many great things about this blog.
If the indicators are playing like the past few sell-offs, we should get a new low under 2049 then a new all-time high, followed by the larger sell-off.
This would also give the $NYAD bearish divergence on a new high.
AAPL should test 108, so I bought the Dec. AAPL 115 Puts
You observation is very good. I am looking at $NYHL(histogram). If it turns negative again in the next few days, it would a clue for me to send in my scout short again.
The Swing Trend Indicator stayed on tentative sell today, so I’m comfortable that I sold the rally today. The market will decide if it was the correct decision. 🙂
The “safe” short is $VIX TSI zero line cross over. I always short there to protect my SPX and RUT positions bought two years ago.
Too much air space below the price curve. A (partial) fill would be nice and health.
Good luck to you trade. It should work…
DJIA Should trade down to 17,630 this week
WOW!! That’s a BOLD call geno0010. Much as I would like to see that happen a 200 point drop in the DJIA sound a bit ‘incredulous’. Of course if it DOES turn out to be true then look out for my ‘CHEER’ to you.
Thx for posting.
Purvez – It’s only a 1.4% move down, very easily achievable. I have this move up starting yesterday as a B wave with a C down to come.
Mr. Hampson – Do you want to keep the comments guided toward solar/lunar/astronomy or are other methods welcome?
SPY Dec put option OI jumped 17%, about 120k contracts. VIX put option shrunk 15%, call option OI jump 16% to 20% for the 17 and 18 strike price.
About the Christmas Rally everyone is expecting, you shouldn’t expect one just because it’s Christmas. Market situations change. For one, the past six years have seen Christmas rally because of QE. This is the first Christmas without a QE.
A few more points. Russell2000 is a good yardstick and it broke 10ma and 20ma. Nasdaq 52 weeks low stocks has now outnumbered 52 weeks high stocks 2 to 1. And the number of stocks in Nasdaq above 200ma is less than 45%.
To Richard, the panic you’re referring to is called herd panic. It doesn’t come until late in the game when the herds realized too late they’re about to be slaughtered. I remember you said something along the line (and not just once) that if one doesn’t know such-and-such one should not be managing his or her money. If you don’t mind me saying, this is quite a put-off. And not trying to be rude, as a professional trader and from reading what you’ve been posting, I feel too there are a lot of things you don’t know about the market. But I wouldn’t be telling you things because, well, that’s just manner. It’s good you’re being disciplined. That’s a valuable trait in this business. Another trait you might consider is to “stay empty”. It’s an old Chinese fable, if your cup is always full, you won’t take anything in. I don’t write much here because most of time I’m listening to what the market is telling me. If I talk too much, I won’t be listening enough.
We get schooled by the market everyday. Stay humble.
As the most interesting man in the world says, “stay thirsty my friend”.
I love the “stay empty” mantra.
Again, Great work John! I’d like to add a fundamental perspective that earnings have not been supporting the advance over the past 3 years. The S&P 500 has risen 5 times faster than earnings since 2012 as depicted in the following chart.
P.S. John – How do I insert the chart directly into the post?
When John posts a new post, I’m sometimes guilty of kinda skimming through the text and charts, and looking forward to getting to the comments…
Still do it, but was looking through the charts at the top of the page a little closer tonight, and have a question for anyone that is “long and strong”….
How does the last chart, the “Total Assets Bull / Total Assets Bear” chart, ~not~ bother you??
Thanks!
The last chart looks at just Rydex Index Funds. I have no idea how representative this is especially with ETF being the dominant investment vehicle for traders. Note also that this chart did nothing in 2008/2009. Alone, I do not put much weight into this chart.
@John Li or whoever is familiar with shanghai composite
Something is brewing in shanghai index. The bottom looks complete in from a weekly chart. It still got lots of room to run till early next year. Anyone know how to play this?
HangSeng and Shenzhen is at higher valuation. I can foresee the divergence between Shanghai index versus Shenzhen will narrow in the next few month.
Divergence indeed. ETFs that trade A shares have seen large outflows in the past week, and the exchange link shows that foreign investors are just not interested in China. So why have Shanghai kept going up? I suspect the Chinese govt is buying so as not to “lose face”. I don’t trade Shanghai if there is an opportunity here, or if the random whim and fancy of the state adds so much noise that any signal is not really profitable.
While Hang Seng is at a higher valuation, the quality is also better. If you compare the same companies, Shanghai is actually more expensive, eg by 11% according to Hang Seng China AH Premium Index.
I suspect the most profitable place to go long is where there is free money thrown by the govt….perhaps to support IPOs to get retail interest up again. Not sure how non-Chinese can trade it though. I remain a China bear.
Thanks bro.
Spiral update – 12/4 cits at 3:00, 8:00 and 14:00 https://twitter.com/mjmateer
If you review VIX and UVXY then you can just lump Nov 28/Dec 1 as another “false bump up” just like what occurred Nov 12/13 and Nov 19/20. That is the market can only muster up at most just one follow through down day in USA equities after it hits a new high with a slight selloff reversal in the previous day. Or to put it in layman’s terms, what is happening are the dip buyers are rushing in on any slight weakness even if it is just 20 or 25 SPX points decline.
Expect new ATH soon either this week or next week latest.
In the comments of some past article some other poster pasted a chart of the 1920-1930 DJIA chart and annotated that we are presently equivalent to early 1927. The market is on the verge of breaking out in parabolic fashion and the final climax will likely end in some form of exaggerated blow off top. It would be in everyone’s interest to review that chart again and keep an open mind, especially if you are always leaning towards the short side or attempting to pick the top.
The big drop (i.e. 10%) already came and passed in Oct 2014. You will likely not get another perfect storm until spring 2015 at the earliest and worst case scenario (for bears) maybe even not until fall 2015.
Change your mindset, change your perspective, change your focus. Instead of trying to “catch tops” for 20-40 SPX points, you should avoid that (uncontrollable) urge and instead focus on waiting for those temporary spots of weakness to catch opportunities to go long instead. The bull trend will net you double or triple the 20-40 SPX points you might get (if you are both fortunate and lucky enough to time it exactly to get in and out before you get killed) and you also have time and nature working with you.
What exactly will initiate such a parabolic breakout? If I were to guess I would speculate it is when the Fed decides to raise interest rates. Initially the market might sell off on that news, but it likely creates a mass stampede out of the larger bond market and a mad rush into USA equities.
great post, Steve. Much appreciated!
Your posts one of the reasons I continue to pore over these comments.
What if the stock market becomes a replacement for the bond market. The “equitization” of debt could bring unprecedented stock market highs.
I think I was the first one to post the chart source using an analog of 2009-2017 compared to 1921-29 on Aug 28. Both 8 year periods where the Fed went bananas following a sharp 18 month economic contraction and a 50% stock decline. The mantra then was also “do whatever it takes”. Someone a couple weeks ago added the annotations – good work.
Source: http://stockcharts.com/freecharts/historical/djia19201940.html
There is also a high correlation with the bond market which peaked in year 6 (2015) and the blowoff was a result of rising interest rates and bond investors switching into already elevated stock prices.
Bonds: http://thehousingtimebomb.blogspot.com/2009/05/great-bond-crash-of-1930s.html
Requirements I see for meltup (2016-17):
1 – Republicans retake control of the Senate – check
2 – Euroland implements full QE (with or without Germany)
3 – Republicans retake Whitehouse – probably Bush III
4 – Massive corp tax cuts – see John Mauldins proposal for 15-20% rates
That does not mean everything will be the same – history may not repeat but it might rhyme.
Wow now Steve T has decided to stop providing useful information on fractal comparisons and decided to tell us how to trade too.
People like you with your sarcastic remarks are what drives folks away from good quality discussion. I do not need to listen to this or put up with any of it. I post only because I enjoy the “chat” and exchanging useful info with others. Besides that it is actually detrimental to my overall investing or trading.
Steve T a large part of your comment related to telling all of us HOW to trade. The rest as I said has been very welcome and would continue to be so.
The sun’s overall magnetic dipole is continuing to gather some strength, but very very tentatively (as befitting a weak solar cycle: http://wso.stanford.edu/Polar.html#latest
But the northern hemisphere strength is refusing to budge. When it eventually does so, it will most likely give rise to a temporary increase in sunspots – how long that increase will last is impossible to know, but it is possible that we could be seeing some of it right now (northern sunspot count has started to increase recently). Judging by previous solar cycles, the final surge in sunspots could complete any time between now and late 2017, with the statistically most likely time around Q3 2015.
Mark, while the dipole is shifting, can you explain why the tilt angle is back to highs?
I am a true newbie at this.
Thanks for posting that – its a very obvious illustration that SC24 is not done yet.
The heliospheric current sheet devides the sun’s northern and southern magnetic polar fields as they extend away from the sun; so the sheet is flattest when both fields are balanced and strong. At the moment, they are relatively imbalanced and becoming increasingly so, and also persistently weak – hence the steepness of the angle.
While this angle remains high, our planet is being exposed to the sun’s northern field then its southern field alternatively four times every 27 days. Whether this is one of the solar factors which influence human behaviour, I don’t know – but it isn’t going away anytime soon.
Mark,
I too am on board for mania in 2015. Here’s sc 16 vs 24, my fav sc comparison since i first visited this site. I trimmed off the first 18 months of sc24 in order to line up the similarities in behavior. This projects to November 2015 peak, market peaked 2 months before sc16 peak, that renders September 2015 as the peak (give or take a few months from that projection given several lead lags in each spike within the cycle compare).
Place your bets. (Accumulation mode gold/silver stocks and index calls)
To further that conjecture, one might be able to evaluate the next breach of 100 as the execution of the final cycle peak.
Joseph, your chart shows the very strong similarities between SC16 and 24; and the 18 month offset makes sense to me to account for the unexplained delay in SC24 getting started.
And now we have neutron counts at Oulu apparently dropping away from their 0% level. See the bottom chart here: http://cosmicrays.oulu.fi/
This is exactly what happened in the lead-in to the last five solar maximums (including the relatively weak SC20). These previous lead-in times ranged between 6 and 18 months. The current (as yet very tentative drop) coincides with the upturn in solar flux since September 2014, so that suggests SC24 solar max between March 2015 and mid 2016.
Neutron counts at Moscow have not (yet?) confirmed a drop-off (see the -8% level on the monthly chart at Moscow): http://cr0.izmiran.rssi.ru/mosc/main.htm
Moscow’s daily chart shows the effect of increased solar wind since September. An increased solar wind shields us from galactic cosmic rays (actually hydrogen nucleii) which cause neutron showers at the earth’s surface.
Mark and Joseph Teofilo,
Great posts. Thanks for writing. I also expect Oct 2015 to be peak for world equity based on historical Lunar model I follow.
I often feel like that guy in “True Grit” about to hang, who asks not to let his family have to go live among low people. I am the fool who bought silver on “advice”instead of sticking to what I understand. The stock market seems to me, to be what would happen if the Soviet Union had a stock market and their employees were given a list of what to buy or sell each day using state funds.
John, good movie reference. I watched this scene from True Grit, it is really rich. I also lost on SLV, which may have a crazy gain middle of next year based on astro indicators featuring Venus in the main role as the Retrograder.
Barry,
I think many long here are aware
this is a late stage phase bull market,
only uber bulls seeing another 2/3 years left
in this upswing may disagree.
I agree with many of the points raised here,
having seen multiple cycles it gets easier(a little)
to recognise the various signposts.
My outlook only really differs related to timing,
although it would surprise me if the next bear
is multi year.
The only real hope for those heavily short right now,
outside of an outlier event, is for a sudden loss
of confidence in the global growth outlook
altering perceptions of risk, and equity valuations.
That looks very much an outside bet to me,
however I reserve the right to be wrong.
Unfortunately I do not have any magic formula.
FWIW Phil i agree. I expected a pullback in October which we got. The market seasonality is doing what it normally does. This time is no different. Best hope for bears is to top out by end of this month. Next window is March next year which i think is likely. Like ive said before, one candle stick does not signal a market top. We need to see multiple signs. Also there will be plenty of time to get on board when it does turn as i very much doubt this bull will die without a fight!
Someone mentioned the Nasdaq. This has been the leader and continues to be. As soon as we see it top out there is a another warning shot. We are about 10% away from all time highs – double top? If so S&P could easily be 2250.
luigi, I like that Chinese proverb,
had not heard that particular one before.
And yes the market is known as the great humiliator
for a very good reason, it has the ability to make
any of us look very stupid, that certainly applies to me
many times over the years.
John I’ve read your great blog for a year. I also believed fundamental indicators but this time price didn’t confirm them. We have in Poland such phrase “to seek a hole in a whole” (sorry if it’s not correct English) what describes people who search problems in perfect scenarios. I started searching such holes when my shorts started bleeding (currently I’m without position).
First: Emerging/Developed market cycle supports developed markets since 2010: http://wojciechbialek.blox.pl/resource/MSCIEMMSCIWOrldod1988.png
This cycle is also visible on dollar, inflation etc. When developed markets are weak, commodities strong, emerging/third world countries appear to be strong and rising. But when situation turns back capital escapes to the strongest economies and emerging economies have big inflation, some bancrupt or even experience war (currently also in Europe). This is why dollar is a king and euro is still alive.
Since Fed prints money bonds are not safe haven. Turning this money back will cause implosion of the system so they need to supply economy with fresh money (about 3% a year). And there is a hole number one:
– What if this solar cycle ends mania on governments debts?
Stocks topped 2 cycles ago, equities 1 cycle, perhaps it’s time for bonds?
A hole number two:
– What if stocks rise until the strongest of them – NASDAQ makes all time high? It’s still about 10% below ATH from 2000.
More weakness in euro yen keeps the stock market rally in check. $/yen without a proper pull-back since 105 or 14 points. Normal 62pct pullback would be around 111. $ index into strong resistance zone between 88.80 and 89.80. It is bound to get interesting here.
Yen short covering rally not expected until USD/JPY hits 120:
http://www.marketwatch.com/story/dollar-flat-against-yen-after-setting-fresh-7-year-high-2014-12-03?siteid=yhoof2
and probably won’t happen until after this Friday’s NFP.
Good point
Euro yen continues to exhibit bearish patterns foreshadowing a potential larger move in stocks and yen.
Steve T has a valid point on the lack of follow through
selling since the October low, this trend has been
dominant with even the most minor of dips being bought back.
Breath indicators on the RUT and SPX were mentioned frequently
here a few weeks ago – can anyone provide any updates? – TIA.
The NAS was mentioned earlier today.
As far as what I follow for clues, the bottom-line for me is…..breadth has only gotten worse since I last chimed-in here on that…
Money-flow looks even weaker, and RSI on the various charts I look at has (overall) rolled over even further…
Chart after chart, to me, right now looks like a more drawn-out version of September… Which tells me that it’ll probably be a bigger break than we had in October, ~when~ it breaks….
Wish I could tell you when that’ll be, but really no clue as to exact timing…
Regardless, still holding 100% short, and even flirted with being back in profits on the overall position Monday.. That was quickly fixed on Tuesday, however..
Regardless, that’s what I see, and where I am…
Channeling my inner-BBE, and I think he’d agree, we’ve got Wile E. Coyote running over the edge of the cliff, his legs have stopped running, and he just looked down…
The only thing left is for him to look out at the viewer with that “Holy crap….” expression, right before he plummets…..
Obviously, I’m still waiting….
Thanks..
the comment by purvez at “wow a 200 point drop in the dow as incredible” sums up this market perfectly and why johns analysis is correct in a crash occuring
Hi Rob;
I thought the same thing when I read that…. My first thought was they meant a 2-THOUSAND point drop….
Then I realized no, they did mean 200 points, and called it “incredible”….
All I could think of was, “Wow……indeed…..”, but not for the reason the poster meant, I’m sure…
My bad… “Incredulous” was the word….
EUR/USD is about the enter the Fib Support Zone that resides from 1.21-1.22, I’m a buyer there.
http://unbiasedswingtrades.blogspot.com/2014/12/getting-ready-to-buy-eurusd.html
Barry,
Appreciate hearing your view, thank you.
Call up a chart of FXY (yen etf) and SPX. Yen began its rapid descent in mid-October, just as SPX shot higher. the correlation is near-perfect. So when the yen finally reverses, so will the SPX. Or, the correlation (i.e. the carry trade) breaks down.
Yup, a -.90 correlation, about as inverse as you can get.
Nasdaq cumulative breadth measures (2 hr):
http://stockcharts.com/h-sc/ui?s=$NAAD:$NATOT&p=120&b=4&g=1&id=t10521341486&r=1417618114665&cmd=print
30 min…
http://stockcharts.com/h-sc/ui?s=$NAAD:$NATOT&p=30&b=5&g=1&id=t18975380182&r=1417633958407&cmd=print
There appears to be a dichotomy brewing where if someone presents their viewpoint, especially when it pertains to the big picture, and the logical and rational action plan for such viewpoint that it gets reinterpreted as someone telling another how to trade or invest and that such benevolent teaching or advice is mostly unwelcome.
Richard Isaacson is probably bang on with his big picture view. I think it only comes across bluntly because he likely cares about what would happen if others choose to ignore it.
I presented a bigger picture view (2 – 3 years out) of what I think is going to happen. And if I am one to believe that it could happen (i.e. parabolic surge with final blow off top) then obviously I am going to shout from the rooftop to anyone who cares to listen to presently quit thinking about trying to get an ideal short entry and instead change your mindset! Now if you disagree with my perspective and instead are macro big picture bearish then that is a different issue. But for others who do not see what is occurring and only see new 52-week or ATH, and say “gee, time to short the overextended and long bull market now” then that would be my target audience.
In a bull market the surges from the overall trend dwarf the mini dips by at least a factor of two to three and it keeps repeating. It is a futile and tiresome journey to attempt to call or pick the market tops and short it, especially when it could not be any time close to ending and you have all of the forces of nature working against you. Not saying one cannot still profit from making counter trend moves to the market but that the bigger and easier money is made investing in the trend.
Steve T since I was the one who commented about you trying to advise us how to trade I believe I should respond to what you’ve said above.
Most people on this blog, including myself, have welcomed and looked forward to your views on where the market is going and have had respect and even admiration when your predictions have delivered. I will repeat I would welcome to continue receiving them.
My only objection was your INSISTENCE that we all change perspectives, views, etc to your way of thinking. I think that’s where I draw the line.
You are welcome to keep shouting about how you strongly believe what is going to happen in the market.
All I ask is that you leave it to the reader to take action on your comments or not.
That was also the same thing that Richard did which I, along with others, objected to.
Richard has since continued to post and his comments remain well worth reading without any accompanying advice on how to trade.
Please may I request that you do continue posting and allow us the intellectual independence to take action or not.
Thanks
Sorry, but I don’t get the whole “how to trade” thing. What am I missing? To me “how to trade” has to do with timing entries, indicators to use (or not use), stop placement and risk management in general. I don’t see any of that in Steve’s posts, only a warning that the dips are small and the surges after the dips are multiples (in terms of points) of what the dips are.
I personally welcome this kind of advice because, even though you might say it’s stating the obvious, I can use reminders of “the obvious” from time to time. Just that simple concept that the surges are several times the dips in terms of points is something that I hadn’t really thought about in those terms until Steve pointed it out. And because of that, the easy trade is to buy the dips. When the drops start being longer than the surges, well that will be the time to consider changing course, but until then buying the dips will likely be much more profitable than selling the rallies.
So I appreciate these posts and although I can’t speak for anyone else who reads these comments, I suspect there are a few others who appreciate them as well.
Thanks for the friendly reminder. Never have I given trading advice or command what others have to do. I only have stated logical thinking as to how one should rationally act given a specific scenario. If you disagree with the scenario then that is fine.
But if the market has the potential to DOUBLE in price from current levels (my thinking aloud here), why would anyone consider shorting here in the hopes of picking off a possible interim top?!!! Not only do you incur potential trading losses if you do not time the entries/exits to the T, but more importantly you miss out on profit from what could be possibly the biggest stock boom since the dot-com era. And back then there were many publicly traded companies that soared to ridiculous valuations with no profit or tangible business plans but just based on hype.
If you want to short then you better definitely have a high probability tool to pinpoint exactly when the markets are prone to have those 8%-12% significant declines to make it all worthwhile. Otherwise it is a fool’s game to play the other side.
That is all I was saying. Hopefully last thing on this issue.
pimaC this is the paragraph I was specifically objecting to:
===
Change your mindset, change your perspective, change your focus. Instead of trying to “catch tops” for 20-40 SPX points, you should avoid that (uncontrollable) urge and instead focus on waiting for those temporary spots of weakness to catch opportunities to go long instead. The bull trend will net you double or triple the 20-40 SPX points you might get (if you are both fortunate and lucky enough to time it exactly to get in and out before you get killed) and you also have time and nature working with you.
====
If you are fine with that then that’s ok with me. Just not fine with me.
+1
Gold approaching resistance of 1000 euros.
As I posted a few weeks ago when gold was near 900 euros and should bounce, all year gold has traded in a range of 900-1000 euros as both gold and euro fight rising dollar.
http://stockcharts.com/h-sc/ui?s=$GOLD:$EURUSD&p=D&yr=1&mn=0&dy=0&id=p22993123412
Well, I never realised that StockCharts had FX data, albeit EOD only.
Still… great to know – cheers to you, arthurk.
http://stockcharts.com/h-sc/ui?s=$GBPJPY&p=M&b=5&g=1&id=p81383313437&a=378993603&r=1417633310883&cmd=print
Hang on, it gets better…
http://stockcharts.com/h-sc/ui?s=$GBPJPY&p=M&b=5&g=1&id=p81383313437&a=378993603&r=1417633770247&cmd=print
http://www.peaktheories.com/self.php?id=1774
Thanks for sharing that rob.
THANK YOU
Weakness should start hitting the markets now at 2:00 EST and last through December 8/9
Should read 3:00 EST, it’s 2:00 where I am
Just curious to know based on what indicators do you say with confidence the exact time when markets should get weaker ?
Well, they’re based on daily indicators,so it’s tough to get the EXACT time, but should’ve been toward the EOD today.
Just some thoughts to the “big bullish wave that is projected to occur” posts…
I’m currently 100% short…based solely on a system….
I have no idea if I’ll be right or wrong with this trade, but it’s been a pretty decent system the past several years, with trades that last anywhere from 3 days to 3 months…
That said, actually, I hope you’re right….
I’m SURE I can make more money in bull market than I can in a bear market, if for no other reason than there are a couple of accounts I manage that are pretty much only offering a “long stocks or long bonds or long cash” choice….
And I’ll have some real estate to sell in a few years too, so I REALLY want the bull market to persist…..for years….
That said, again, I’m currently short because my system tells me to be short…
No other reason… Not trying to pick a top…..not trying to make a political statement….not trying to prove the economy wrong…..
Not anything…..but make a few bucks….
Hopefully, we’ll get another downdraft, my system will reverse, we’ll all get long, and we can all, along with CNBC, cheer-lead the market higher until it doubles or something….
But until then, all I currently see (through my indicators) is increasing erosion in everything that I “think” makes the market go up, so there we are…
I will of course let everyone know when I get the next buy signal (cover shorts and go long), but I can assure you, it won’t be right now…
GL to all….
Thx Barry for reminding me that we are all here to make some money. Greatly appreciated. GL to you and all here.
Unfortunately, I seemed to have forgotten that myself for the last 2 trading days…
Well, I see we at least we got another new high out of the way…. 🙂
Hahahahaha!! ‘another new high out of the way’. Now THAT’S a perspective I LIKE VERY MUCH!! Thx for the late night smile.
hi all ! So, have you finally bought IBB and QQQ and AAPL ? Good God, this market is very easy.
I’m not sure exactly ~what~ is going to happen in the markets going forward, but there are just times I’m convinced it’s going to be epic…. 😉
I read your comment and then saw ‘eclectics’ comment below!! Together they make a great read.
Stupid post, lol.
Size matters?
True, but distance matters just as much.
https://pbs.twimg.com/media/B384H4mCUAAUWOD.jpg:large
I read the following within the ‘subscribers section’ of the site but thought it was worth repeating here. Hope I’m not breaking any ‘intellectual property rights’ here. Any ways its a good ‘general observation’ which resonated with me.
=====
Remember, this is an auction market, no one has put a gun to anyone’s head to buy or sell a stock. In my experience, the source of the loss comes from the way some trade…their strategies or the lack of them, not from price volatility.
=====
Sorry should have mentioned that the site is hftalert.com
The million dollar question for next year’s rally is how big is the bazooka? Any less than impressive will certainly disappoint.
All eyes on ECB in the next three meetings.
Well, the Swing Trend Indicator went back on Tentative Buy, so I have to buy tomorrow.
I have a feeling it’s going to whipsaw me, but whipsaws only eat a little bit of yearly profits.
is this a system you developed? You trade it, so you must have confidence in it. How do the returns from the system compare to just buying and holding, using a simple exit mechanism like the 200 day MA? What did you use for back testing?
It is a system I developed. I posted the 2014 yearly results earlier on this thread, all the buys and sells and the dates of the buys and sells. The returns far exceed buy and hold, but a lot of the short trades get their profits eaten unless I use a different exit strategy. Finding bottoms is A LOT easier than finding tops.
thanks, geno. sound like a great system. I’ve been working on several systems over the past few months, some of which have backtested well. I’m using TradeStation for backtesting. The problem with the ones I’ve developed is that they don’t trade very often, so I’m trading them on a number of different instruments in order to have more trading opportunities. The one I’ve been working with lately does best on the FX etf’s like FXB, FXE, etc.
Wondering why every sell signal reverses in the nick of time? Bet your shorts don’t scare these buyers. http://www.zerohedge.com/news/2014-12-03/central-bank-buying-sp-500-futures-extended-until-end-2015
That’s old news. See the “newer” incentive program on metals from Sept 1 14 to Jun 30 15. Hence my weight on the metals 🙂
weight means long AND short, before anyone decide to… you know.
WT, sells. reversing in the nick of time is a sign of a bull. Many of us have been fighting it, to our chagrin. I still am,
pimaCanyon – Have you ever tried your system on FX pairs?
no, but I suspect it would there too. I haven’t traded forex. I’ve looked into it, but there are a couple of things that bother me about it: 1) the bid/ask spread seems wide (especially for a market as huge as forex is), and 2) my broker would be one that comes under the category of “dealing desk”. I’m not sure I understand completely all the implications of that, but what I do know, I don’t like. So, to trade forex comfortably, I’d need to open an account with a broker that does not have that “dealing desk” deal.
Sounds like you trade forex? If so, do you have a broker you like and trust? What’s your feeling about the spread?
first sentence should have been “no, but I suspect it would perform well there too (on currency pairs)”
word has it that there are large $/Y sellers @ 120 thus the nibbling around the area so far. read a number of reports that there are major resistance coming up for both $ (90) and $/Y (120 but this may just be due to it being a rounded number, the real battle lines are in the 123 to 124 area), if these resistance lines gets broken then who knows how crazy things can get.
120.15 61.8 fibonacci from 1998 top and 2011 low. Big test here. Fx tumbling not something which all Japanese welcome as Richard has pointed out.
No correction in pair for 1500bps which is pretty rare.
interesting, it just took a quick pop to 120.15 area.
Central Bankers are not limiting their buying to the SP500. They are buying every major market on cue.
Aside from the historic run in the US indices out of the October lows look at the price action of the European and Asian indices the last few weeks and you don’t have to be a looney conspiracist or a genius to see what is going on.
Central Bankers are scared s#%tless about the markets declining even a few percentage points.
The rhetoric from the ECB and Fed Reserve when markets were selling off in October was obvious. They were literally falling over themselves to offer the markets guarantees……….WHY?…..Why do Central Bankers now see it as their duty or responsibility to support stock prices at any cost?
Why have stock markets been allowed to become nothing more than an extension of Central Banks and why have CBer’s abused their positions to the degree that yield chasing has become extreme and risk insurance is no longer quantifiable much less attainable at a reasonable rate?
Italian 10yy’s at less than 2%………bloody insane!!
Do you have data that’s accessible that shows that CB’s are actually buying stocks or stock index futures?
I thought it was illegal for the US CB to buy stocks or futures. Obviously it’s not illegal for Japan to do the same, but I understood that the Japanese CB is buying ONLY the Japanese market and not buying other markets such as the US market.
Australian AllOrd up strongly for the third day running after Tuesday’s disastrous GDP results, in fact the worst results in years……maybe not such a surprise thet stock prces were driven higher given how the picture looked going in Tuesday.
The same can be said for the Hang Seng today.
Central Bankers paw prints are all over these markets.
http://stockcharts.com/h-sc/ui?s=$AORD&p=D&b=5&g=0&id=p44075910531
Allan, what’s ur view on gold miners and gold itself when the miners are lagging the progress of gold considerably?
Allan
Agreed, southern europe debt is just a basket case, 2% yield to hold that rubbish lol?
Lets see what the crooks in ECB can muster today. Perhaps they can indeed find justification to break some laws to give the banks what they need?
Should be a fun few days coming up.
imho
J
By the looks of the DAX it seems like the market has high hopes for ECB today? Rumour—->news or just bulldozer….?
J
Alan, Jegersmart….I too keep asking the question that Alan asked. Why are the CBs propping up the Stock Market? Given their mountains of debt I can understand their need to manipulate interest rates via the Bond Markets but how does it help them to have strong Stock Markets?
My own answer to this comes down to the systemic risk of the Too Big to Fail Banks. These guys have got derivatives exposure which could topple them in an instant and the only way to ease the risk is to fund them to allow them to keep the teetering mess upright.
Now giving money to Banksters openly is clearly not a politically acceptable option so one ‘stealth way’ of funnelling funds to them is via the banksters buying leveraged call option positions which are then bid up by the CBs through their stock purchases. To funnel $10 to the Banksters the CBs only have to bid up stock by $1.
The bit of my ‘answer’ that I can’t fathom is if the banksters are winning who is losing? It surely is not the MMs. Clearly I need to think further on this.
However if anyone here has an answer or an alternative suggestion then I’d love to hear it.
Thanks in advance.
Purvez. I think the more they intervene (manipulate) the more they are afraid their whole ponzi scheme will come crashing down. They also know another 2008 endangers their power and existence, so they desparately do not want anything to go wrong. They are presiding over a house of cards.
Purvez,
rHEY GET IT FROM FOOLING TRADERS, PENSIONS AND OTHER MONEY THEY MANAGE THEY MANAGE.
Please excuse the caps. Plus they cover shorts placed, having preknowledge o \f the coming support.
I think the main (or only?) reason to prop up the stockmarket if that is what is definitely happening is to allow banks to deleverage further because they are allowed to post their own stock as T1 collateral under current regulations (which seems nuts to me at least). That complimented by almost free financing for them (and not much lending going out) should mean they can deleverage over time so that they can survive a “normal” market in the future. Quite a few banks are insolvent technically speaking as stated beofre on here – contacts that I know well across the European banks at least are quite concerned to say the least.
Any other views welcome of course…
J
In terms of market timing, none of us have a crystal ball.
You can be utterly convinced in a certain trade and
still be wrong, conviction does not always equate to accuracy.
I appreciate posters alerting others to a different take which
they think may be overlooked, underestimated.
I have taken some flack over the past few months
for views that some considered too optismistic.
It’s ironic as I tend to be uber cautious rather than an uber bull
never using margin on any positions.
Where I differ from some here was/is on timing,
as 2015 seemed a more natural end to this bull market
with the likely turn in the US earning cycle.
There appeared to be a lack of a single decisive factor
that would tip equities over and that still appears the case, for now.
The best hope for the bears right now is a continuing rapid sell
off in crude which may begin to erode confidence in 2015 global
growth prospects, with investors beginning to question current multiples.
This erosion in confidence is more likely in the second half of 2015,
that’s how I currently see this developing.
Just FYI – I have gone short DAX at 10018, stop at 10098 – looking for a retest of the (steep) trendline at around the 9750 mark over the next few sessions.
I dont normally post live trades but there is no point making the hindsight comments as most do on here,
J
In fact I clearly cannot even spell optimistic, just noticed the typo
in the prior post )
3 billion of USDJPY 120’s roll off today – that will open up the topside and expect equities to be dragged along with it… more soon
Looks like another buy the dip opportunity today with the Dax. Maybe dow too if it drops a bit more. Have a feeling this will build and and then sell off in Jan/Feb like last year.
I don’t want to say I told you so, but I told you so,,,Mario, all talk no action.
No QE from ECB, and hearing live con link it’s unlikely to be early next year either,TBH he never will.
Next body blow is kamikaze Abe losing election next week.
Market starting to turn down. Dax just dropped nearly 3% from peak
these momo traders can’t figure out what they want to do with the euro…they so desperately wanted draghi to deliver.
CBs fear index just rang, buying what they can again to shore up market.
Just a matter of time now.
somebody decided to take a peek as to what it looks like on the other side of 120 ($/Y).
They are now full on looking at it……… relentless doing it too.
Abe, beware what you wish for. this thing may quickly get out of your control, would not celebrate too much if you get your ‘landslide’ victory.
James, I am a bear …… I am just really puzzled by everything that is going on in the world…….. USDJPY EURUSD USDRUB gold silver, oil, copper, miners .so many things seem to extreme and don’t seem to make sense to me to the point I will just accept how crazy volatile this market can be. Look at the ruble and the way it’s crashing – it’s scary.
Closed my USDJPY longs ahead of rollover, shorting more SPY here…
Aaron, the ECB will be unable to boost Euro
area growth unless they can significantly devalue
the Euro, that’s the key longer term.
In reality, the ECB is not trying to boost growth, just deliver price stability, its sole mandate. They say it all the time, do it all the time, still no one understands it.
Their sole mandate guarantees they will act next year to fight deflation.
The only asset able to cope with their bid is gold.
And they’re already alluding to it.
I don’t trade, but I see traders here trading markets they think the CBs are directly manipulating upwards. That is a sign of madness on two counts. Why trade such markets if you believe them to be manipulated.
No, this is just a topping process, a big bubble takes time to burst, and sentiment is still strong. Time will kill that, then you will see the CBs, as usual, are in control of very little.
You have crude selling off again atm with Brent below
$70, the ECB has not obliged with any immediate aggressive
QE, so in this context if you cannot generate some downward
momentum in equities it will look evermore like a rise to year end.
i don’t think the yen cares what the equities market is doing anymore, moving on its own now.
There’s no risk in equities, so buy all you can. Look, let’s say the S&P 500 drops to 1800, then the FED will do QE4, print trillions of $$, buy stocks, buy bonds, and in a few weeks the correction would be over.
Thank you Nicolas, your advice is always so simple and concise. Equities simply will not come down as far as we can see.
so buy here at today’s price and hold thru a drop to 1800? You’d be comfortable weathering a drawdown like that?
I should be transparent here and divulge that my trade was stopped at 10103 on the Dax, due to IG Markets (in this case) calculating their Cash price on the futures contract….
So a loss this time:)
J
Great day for us bears. Oh yeah.
Yay weakness, coming in right on cue.
At least medium term top may finally be in.
A summation sell signal 2 days ago, then new highs yesterday. Since they were nonconfirmed, it was actually good, but how did it make me feel. Uncle, I give, tap out, concede, no mas and now a primal scream. Man, this has been torture.
Add to that the NYAD -div and now testing that 13dma
Whipsaw action just like early Sept? Indicators say the market is vulnerable to a correction.
I can’t comment on whipsaw until it’s over, unfortunately. You never know.
Add to that +div in VIX:VXV, -div in BPSPX, -div on macd, rsi and +di on BPSPX, -div in SPX:VIX, etc. etc. a top is either at hand or very close. (Very close = within 40 pts on SPX)
We also have daily ADX rolls on all 4 indices now, DJIA, SP-500, Russell and Nasdaq
Geno, we use similar tools….as you’ve said and I agree…our tools are pretty good in picking the bottom. Not so good in id the top….
First week of December is seasonally strong. Moon reaches north declination Friday(some time deep sell offs after North is reached). Full moon on Saturday(price suppressor). First three trade days of second week of December are weak. I have short bias from Fridays close until next Wednes.
Although I now notice that my trade would not have been stopped on any of the other accounts I hold with FXCM, Saxo and GFT……I will raise it with them, although I am sure they will me to f**k off….
J
Worth a try Jegersmart. A few years back I had a glitch on their platform at a most unfortunate moment and a position got closed out because of it at quite a loss. I hadn’t done anything to initiate the transaction.
I spoke to them and to their credit they investigated it and re-instated the position.
Unfortunately I still closed it at a loss, albeit a slightly smaller one. Lol!!
NYAD -div http://stockcharts.com/h-sc/ui?s=$NYAD&p=D&yr=0&mn=7&dy=0&id=p44883089207
SPX:VIX -div http://stockcharts.com/h-sc/ui?s=$SPX:$VIX&p=D&yr=3&mn=0&dy=0&id=p30582041105
VIX:VXV +div http://stockcharts.com/h-sc/ui?s=$VIX:$VXV&p=D&yr=3&mn=0&dy=0&id=p89606448817
BPSPX -div all indicators and -div http://stockcharts.com/h-sc/ui?s=$BPSPX&p=D&b=5&g=0&id=p15511561883
Yeah thanks, they calculate the Germany 30 “cash” contract on a futures price and apply a “fair value” adjustment apparently….it doesn’t seem so fair at this point lol…I suggested they call it the Germany 30 futures instrument or alternatively a Germany 30 “we just make up our own price” going forward…..I am sure that will help:D
80 odd point loss instead of a 160 odd point gain doesn’t seem so fair right now:)
J
Yes I find IG pricing compared to FXCM quite skewed almost continuously. Only just now as we were reaching the lows their pricing which had been consistently ‘lower’ than FXCM’s all day suddenly caught up and is now slightly higher!!
I use it as a vague sentiment/front running gauge by comparing the two.
Buy the dip worked well today. I made good money on it. Hope others did too. The FED probably made a few bucks too buying S&P minis today.
Yeah but do you know WHAT CAUSED that sudden up swing at the half hour? Nothing on the news that I can see.
Huh!?! Does anyone know what just caused that spike upwards?
Sorry that was me closing my shorts. I give up. Good luck.
I commiserate on the pain underneath that comment. 🙂
Every point of weakness is being manipulated. Now that I realize it, it is too late to get in.
Basically, the ECB wasn’t happy with this morning’s market reaction, so they came out and talked again….
That’s pretty much what “investing” has come down to nowadays, it seems…
Wow more non-verifiable rumours but what a reaction to the rumour. Indeed we live in strange times.
By the way anyone seen this?
http://www.marketwatch.com/story/its-official-america-is-now-no-2-2014-12-04
Report released about ECB QE package which will be brought out at the next meeting in January. no doubt released to reverse the losses today.
ECB QE package: ECB will buy one bond per month for 3 months.
the “markets” are but a stage
the director (PTB) waved a wand and a rally was created
Can you buy these wands?
Before you buy it watch what happened to Mickey in Disney’s Fantasia.
at the begining of the year 100% of strategists were calling for higher rates
30 yr treasury bond rates are now 1% lower
is a similar situation developing in the dollar
over 95% of strategists are currently calling for a stronger dollar
while the dollar is right up against a 30 year downtrend line from 1985
http://jessescrossroadscafe.blogspot.com/2013/09/us-dollar-very-long-term-chart.html
Specie, it’s a point on bonds I mentioned earlier
this week, it has been a huge about turn from
inflationary expectations to lower growth with
possible deflation.
Ultimately it signals towards the beginnings of the
next recession, but that remains in the distance for now.
WT, I hope that has not been too painful,
unfortunately many others are likely to join
you over the next few weeks as this market rise
is unlikely to top at the end of December imv.
Q3 2015, then you may have more fortune on
the short side.
Well just woke up(5 am local) to see that the markets have done it yet again……BTFD is alive and well and this tidbit….
LOL an Italian telling the German’s it my way or the highway. Now that’s going to go down really well……….NOT!!
Sayonara to ECB QE.
http://finance.yahoo.com/news/ecb-weighs-further-action-economic-090041372.html
maybe not, but the market bought it (ahem…) anyway.
Market participants continue to believe in more upside and they continue to use every news event as an excuse to buy.
This comment is a little out there so please skip it if you want
There have been a lot of newletter writers and such calling for a collapse in the dollar for a long time
i figure the dollar has the most powerful people (PTB) behind it and will be very difficult to topple.
a lot is developing in the IMF/SDR/yuan area but it’s an uphill fight.
the universal bullishness on the dollar right now shows overconfidence and may lead to a large decline
but i heard a new one as far as reasons why the dollar will never fail
supposedly the u.s. has received alien military technology which will allow dollar supporters to never fail in their efforts to keep the dollar in power
that’s how far dollar propenents are willing to go, funny
Tch tch Specie…how can you even DOUBT that!!? It’s all verified and true. Not only are the markets a stage the whole world is. The Bard had it right.
Oh and the aliens want in on the theatre too.
Oh, and Amelia Bassano was the lead writer of the famous drama (the polyglot mistress of the Globe’s owner, not “Will Shake Spear” (who’s parents were illiterate country folk, who’s children were illiterate, and who knew neither French nor Italian). Read or research Joseph Atwill’s Shakespeare book, he makes a very thorough and convincing case that Amelia was Shakespeare’s “Dark Lady”, who he was constantly leaving the stage work to consult with.
I am sure they are well meme-ing.
seen on twitter: “Will all experts who predicted the demise of the dollar, hyperinflation, gold to $5000, sky-high interest rates, and peak oil please report to the Principal’s Office.”
mr pang, or may i call you doodoo? lol!
yes, i know what you mean about being confused or puzzled with all the cross currents re various currencies and commodities. i tried to make sense of it and trade according to my analysis and have lost money. presently, i try to trade with the trend and hope to make a few pips out of each and so far have been able to break even or make a slight profit. there are 2 trades thou that i want to be in when the time comes, short the equities market when it is ‘time’ (that is why i am here to read up on John’s analysis and what the rest of the folks here have to say) and short yen when/if boj loses control.
the volatile markets, i.e. ruble, turkish currency and even silver, i have learned (the hard way) to stay away as my account is not big enough to withstand the wild swings.
The markets will keep lofting higher if the yen continues falling. When the yen reverses, markets will decline. It’s not just a function of the carry trade, it’s a function of the algos keying on the carry trade for momo direction.
Confidence in CB control of stock markets is essentially 100%. Everybody “knows” CBs control the markets, and what everybody knows has no value. It seems valuable because it’s working, but that trade is beyond crowded. Crowded trades blow up. Oil is a good example. Everybody loved oil and used it for collateral, convinced it couldn’t fall much below $95/brl. The trade got crowded and as a pure function of that imbalance it blew up.
Sentiment. Many punters (incl. many on this board) are confident SPX will continue rising for months or even years. Sentiment is is at extremes (i.e. CBs control markets and will never let them fall). Sentiment is a function of what’s known, not what’s unknown. Confidence in CBs pushing markets higher essentially forever assumes all the critical dynamics are known. That is a big assumption.
Hi Charles ! Well, how can you fight central banks ? They have unlimited buying power and the printing press. As I said, if we get a 10% correction, the FED will initiate Q4 with trillions of $$, they will buy stocks, bonds, real estate, they can buy anything. So, there’s no risk in equities, they can only go up.
In the next recession when earnings crash you expect markets to go up? Your theory of markets never going down will be correct if the FED is prepared to own the entire stock market but something tells me that won’t happen.
first i want to say that i really appreciate John Hampson’s analysis and posts.
i’m also always glad to see Charles post here, i really like his site.
http://www.oftwominds.com/blog.html
i also like the work of the guy at: https://www.greedometer.com/blog/
His latest is entitled “I’m still short the SPX (and long safe havens)
is peak central banking in the air?
Nicolas, I understand there doesn’t appear to be any risks, but the entire idea of Black Swans is the big changes occur when things that are outside the control of central authorities happen despite being supposedly “low-risk”. I am all for being long all sorts of stuff–I have made money this past few months being long natty gas, gold miners, SPX/RUT, volatility–all sorts of stuff. (also made money being short some stuff, and lost money being short and long too early.) All I am saying is, it’s a good idea to keep one’s thumb on the sell trigger.
Well, we all know that if we get the slightest correction, central banks will start buying everything with trillions of $$, so why sell ?
This a report on risk from the Treasury Dept. Worth a read for those interested in why QE from ECB and BoJ is not the same as Fed QE:
Click to access OFR_AnnualReport2014_FINAL_12-1-2014.pdf
“During a protracted period of low interest rates and the Federal Reserve’s quantitative easing, investors may have taken low volatility for granted and underestimated the potential for a reversal. While quantitative easing policies are intended to encourage investors to buy risky assets, there is also a risk that the perceived reversal of such policies will lead investors to turn the other way, triggering market instability.
Similarly, investors may have become too sanguine about the availability of market liquidity — the ability to transact in size without having a significant impact on price — during both good times and bad.
Although the dislocation that peaked in mid-October was fleeting, we believe there is a risk of a repeat occurrence, given the increased prevalence of algorithmic trading, a shift in risk preferences by broker-dealers, and the persistent incentives for risk-taking.”
John, in the link below, where you introduced daily geomagnetism and cumulative trend geomagnetism, what is the measurement you used in your chart analysis as shown in the second link? Thank you.
https://solarcycles.net/medium-term-models/
http://www.swpc.noaa.gov/ftpdir/indices/DGD.txt
Charles…superb couple of posts.
Nicholas… I can tell you are not very experienced and the very fact that you state the markets cant fall shows your lack of experience.
uup
http://stockcharts.com/h-sc/ui?s=UUP&p=D&yr=1&mn=11&dy=2&id=p80332496719&a=370190465&r=1417742620174&cmd=print
indu— chart posted at start of year
both the dollar and dow are pushing to their upper lines hitting those lines simultaneously would be key moment for medianline traders
http://stockcharts.com/h-sc/ui?s=$INDU&p=M&st=1982-01-01&en=(today)&id=p17798172470&a=325848835&r=1417742880262&cmd=print
Slater9 please can you explain how you drew the upper black line? Thx
Slater9, sorry was looking at the graph on my iphone and hadn’t seen the black pitchfork.
Thanks for the insight.
another thought– in January I posted this chart saying it pointed to new highs in bonds… not the conventional wisdom back then.. I think it is worth considering… if dow and uup are turned down at upper lines and have large pullbacks…. bonds may be triggered to final all time high at upper line…
http://stockcharts.com/h-sc/ui?s=TLT&p=M&yr=17&mn=3&dy=0&id=p15340193779&a=333536382&r=1417784859489&cmd=print
Catherine Austin Fitts of Solari Report has an interesting view of current macro picture. It features a move to equities as the unit of exchange between countries instead of debt. This switch from debt to equities may result over decades all of the money in treasuries moving into equities. For equities to rise, either productivity must increase or cost must drop or sales must increase. Productivity and cost will certainly decrease as human workers are replaced by robots and AI. Sales to whom, if robots are doing all of the work. Maybe govts. will provide entitlement benefits to non employed peoples.
Important day today for da bears.
After re-testing firm support around 2 l-t Fibonacci’s at 105.30 and 105.61 in October $/Y blew past 4 other l-t Fibonacci’s over the last 7 weeks (111.64, 112.31, 113.77, 117.8). The last Fibonacci 117.8 was re-tested though. Today the next l-t Fibonacci 120.15 was tested and for the first time since the October lows it did not break. Also the daily formed a pretty big doji which is not a very common sight. Went back and found dojis precede bigger moves in the past (5/2010, 11/2009, 1/2009, 7/2007, 10/2006, 12/2005, 5/2004). So now need to see follow through to the down-side as FX seems to signal some roadblocks for the first time since October.
I just read this:
http://wolfstreet.com/2014/12/04/ok-i-get-it-the-japanese-government-bond-market-is-dead-and-the-yen/
and it provides a convincing argument for why the yen will continue to fall….A LOT.
So no reversion of the carry trade just yet if this thesis is correct.
It is never different this time,
however there are variations of theme each time.
This cycle theme is the power of CB’s providing
the ultimate put.
However the business cycle always reasserts itself,
neither earnings or equities stay elevated in a
permanent state.
Those who have seen a number of cycles will
remember the “new paradigm”, that phrase was
used constantly to justify valuations.
Recessions will continue to happen and
investors will not always be willing to pay
current earnings multiples.
The recent oil price provides another example
of this.
The peak oil theory that was used to justify
ever increasing crude prices, and now that
rational looks suddenly ridiculous.
What equity bears have underestimated is the
US earnings cycle.
More attention should have been paid
to when that cycle would turn.
In the context of ZIRP lower rates of earnings
growth are not enough to derail equities.
The perception needs to be that mean earnings
are about to roll over.
That is the key to unlocking the next bear market.
Is this a gigantic warning that the market is all but done? There is no disputing that AAPL is the flagship of the US stock market and price fell hard on Monday and has since formed a bearish flag. It has been a VERY long time since AAPL looked this bearish on the daily chart. Over 2 years in fact and the current picture may even be considered more bearish than then making it even longer.
Next few days are very important for AAPL
http://stockcharts.com/h-sc/ui?s=AAPL&p=D&b=5&g=0&id=p50701115520
I am reasonably buoyed by this chart. A significant weekly reversal is at hand so long as we hold up today that would at glance appear to be a failed attempt to drive gold to new lows, whilst the November low coincides with significant positive divergence.
Rampant bearishness continues and like so many bear market bottoms before I suspect gold will be many hundreds of dollars higher before most acknowledge the bottom is in.
http://stockcharts.com/h-sc/ui?s=$GOLD&p=W&b=5&g=0&id=p39521321549
I notice the divergence in gold as well but the lagging gold miners worry me a little. Although I think the current short term underperformance of gold miners may be a test of support. Lets see if we can see a more sustained rally in gold and miners.
Any weakness near term for AAPL is still irrelevant to the big picture. It rallied +26% from mid-Oct low to its high and even a normal 50% profit retracement puts it in the low $107’s and that also coincides with 50D-MA support. Lots of buyers will show up at that range if it goes there.
Allan, doubled under Tim Cook which few would
have predicted, helped by the NAS gains.
It is now given that $/Y will test its 2007 high of 124 very soon. If it breaks this resistance then Yen may crash. This may bring serious consequences
you wonder if there are any shorts left, they are either selling to lock in gains or want in.
good NFP numbers? USD wins everybody else loses AGAIN.
Great payrolls! Should see dow push to 18k today. I just bought at 17910 on the initial dip. Target 17990.
I think we put in some kind of top today. NFP days often see market turns. It’s possible the top is already in as futures were up earlier and now flat.
Just hit my stop at 17911 so didn’t work out. bet it will climb and hit that 18k but there’s always next time. And yes it could mark a short term top today hence the stoploss.
Krish, There is a good chance of DOW 18k today.
The jobless claims numbers underline my earlier
post.
I appreciate there are numerous posters
still looking for an imminent turn.
It looks the less likely option, in
terms of a decisive turn lower.
the turn I’m expecting today would be for a short term or even intermediate term pullback, but I think our final top is months away at least.
Is the lack lustre reaction to the GOOD NFP numbers because they imply higher interest rates earlier?
It should do but next week some other indicator will turn bad and expectations will be pushed out further. I wouldn’t be surprised to actually see no rate rises next year as the FED slowly realises the unstable monster it has created.
I suspect they already know about the monster, hence the paranoiac attention to the smallest down squiggle.
yes, I think that’s the concern. bond market is apparently thinking that way too.
well, I stand correct re bonds. they were down big earlier and now flat. so who knows!?
“stand corrected…”
Payroll fridays (or the following mondays) are notorious for reversals of all kinds
i’d sell the dollar
Hope you are right.
I have been a rip snorting table pounding bull on the $. 90 appears to be strong resistance, but we are at the beginning of a multi-year bull market. This early in a bull sharp corrections to the 200 day ma happen, but are tremendous buying opportunities.
the US economy is really booming, unemployment rate is low, job creation is red hot, corporate profits are strong, US dollar is surging, what’s not to like ?
Come on, join the party, it’s so easy to make money in this market.
LOL. Markets never top on bad news and they never bottom on good news. you will learn my friend.
Hi ! Well, I certainly know how to make money in the markets. Time for the bears to admit defeat and join the party, it’s not too late, in fact it’s just beginning.
I hope you sensed the sarcasm in my comment yesterday..
Perhaps the “efficient market” may have already discounted the good news?
I see the air pocket below the price curve being too large. Do you? A pause to refresh would be good for both longs and shorts.
At this point, a reaction of 5-10% would be needed to generate more sales for Wall Street.
NFP: Buy the rumor and sell the fact. I have been waiting for –after– the NFP which could be for a day or two after as well or ….today.
The last time I shorted DOW futures I dozed off and woke up with it over 100 points against me because some CBs had acted or spoke. Fool me once shame on you; fool me twice shame on me. I won’t short again until two trading days after this NFP on the presumption that early next week those CBs will act or spout off again. I will give a day or two for the full effect of this report to wear off and for those who feel compelled to act/speak to have time to do so. Enjoy the weekend and John’s new report to follow.
Wise words.
DOW JONES is near 18 000, congrats to all longs, well done ! My analysis was spot on again. It’s still not to late to participate in this bull market. As I said, there’s no risk in stocks right now, economy is booming and the FED is buying stocks.
This has been on the cards for the past 6 months or more. Global currencies have continues to sell off against the Dollar with Sterling, Euro and Yen leading the way. Yen will test 1.30 against the Dollar by September 2015. All three will sell off by at least another 10% against the Dollar fuelling this crazy stock market more and more. Euro will go to parity against the Dollar within 18 months and Sterling is still on course to be well and truly slammed. Kiwi, Aussie, Loonie, Rand, Ruble are all going the same way. Capital is now moving into key stock markets but I still expect the Dow to be the ultimate honeypot.
When the Dollar continues to rise like this, across the board, we have a US bull stock market underway.
Still short Sterling, Euro and long the Dow. Trading the clear trends. Why fight this?
Good work Nicolas. You are correct in your bias imo because we are entering the new era of government and pensions buying equity instead of debt and a tech innovation cycle with: artificial intel, robots, cheap/free fuels, materials improvements. Tho’ statistically market is down almost as many days as it is up. Any clue on how to market time so that you benefit from not being invested during the down days?
Set alerts and trade long every time price crosses the lower bollinger band on the 3 or 4 hour chart. Whichever suits you. It’s a great strategy for forex but the Dow tends to whipsaw a little too much. Regardless, it’s a simple, consistent, mechanical strategy. You sell when the price hits the upper but I’m holding my trades.
Thank you, Jonathan. Good advice.
Right on Nicholas! Probably an easy double in price from these levels! Isn’t it great when the Central Banks reward paper lovers? Party on in a world where free markets = free money, eh?
Nicolas
I suspect that you are a troll, but in any case it has been a very good week on the whole.
My suggestion to you is to discuss some specifics and actually contribute something instead of just spouting a generic bull case. So let’s have some worthwhile insight from you as there is no ignore button here that I am aware of.
Good weekend all.
J
Excellent post J!
Yep the US economy is booming. It is booming so much in fact that ZIRP continues unabated even though the Fed said back in 2012 that their targets for unemployment was 6.5% before they would raise rates. We’ve been sub 6 now for a qtr.
So what gives?…..
I will tell you what is wrong. Wages have gone nowhere. Velocity of money is slowing, factory orders are in decline and commodities are collapsing. The rest of the world is a basket case and the disallusioned of the world think the US can carry the weight of the world on its shoulders indefinitely.
The Emperor has no clothes!
The Fed will never raise rates in my life-time. That is not to say rates won’t rise, but they will never rise by the Fed’s hand,
I think this week’s ‘Most accurate forecaster’ goes to ….. (drum roll!!) Betafish:
I don’t know how to create a link to a comment so I’m going to post it again here:
======
Per Betafish:
IMO short term indicators leading to possible price acceleration upwards until Friday with outsized sell off next week. Opinion based upon Solunar chart on Time Cycles Research.com, declination to North on Friday, seasonals, and todays price action. Next week has weak seasonals first three days, full moon(weak until 4 day after) on Saturday, apogee(weak days prior) next Friday.
Today: Up, Wed: Up, Thur: Up, Fri: Up
Next Week: Down all week.
=========
On Thursday after Draghi didn’t offer immediate candy and the market swooned for a while I thought this forecast was going awry but it came back with a vengeance.
Well done Betafish!
Thank you Purvez, it is an honor to receive these accolades from a senior member of the Solarcycles forum. I really, really enjoy stock investing and any advantage: Lunar Edge, Declinations, Repeating Monthly Price Patterns (Seasonals), Tidal Action, Solunar Cycle (TimePriceResearch) are like gold to me. Thanks to Andre’ and Peggy who’s original work have added several useful concepts that so far work quite well.
Made a few % this week with my combo system. Selling IWM today. Buying back next Wednesday. First three days of second full week of each month are weak.
Moon is drifting from it’s northern max back to the south starting today (North strong, South weak). Apogee on the 12th (slight weakness up until then and beyond a few days). My trades:
Friday: Buy IWM
Monday to Wed: Sell DOG
Wed at close: Buy DIA
Hold DIA until 12/21, Buy IWM.
Of course, cancel these if price doesn’t confirm with whatever tech indicators
that make sense.
The continuing argument that the USD can rise alongside US stocks indefinitely and using the 1990’s analogy as an example is flawed.
The difference back then was that globally we were still in the midle of a massive global credit expansion and the world was awash in lquidity.
US companies were selling to the rest of the world hand over fist and the global consumers appetite was relentless.
The BIG difference this time is we are on the verge of a credit bust, or in other terms a deflationary debt collapse that is about to see global production grind to a halt. Let’s see what happens to company profits then huh?
Consumers are all but tapped out and are not borrowing. In fact quite the opposite is happening.
That is what has Central Bankers scared s#%tless amd has them stumbling over one another to entice consumers to borrow………….ain’t gonna happen.
Hi Allan ! Sorry to tell you that but you’re wrong, as usual. The job report today shows that income is increasing, unemployment is at 5.8% and dropping. Consumer spending is strong and it explains the high profitability of US businesses.
Are you a real person? Do you work for the Fed? Because anyone with a brain knows otherwise.
You did not understand much of what I said. US consumers WILL NOT save the rest world nor themselves for that matter.
We are entering a global debt collapse that will destroy every share market on the planet.
In response Central Bankers can run the presses 24/7 at full throttle but it will make zero difference because the pace of destruction it will not be possible to stem.
That is what Central Banks are scared of and know full well. Once it begins it will be like falling over a waterfall…….unstoppable.
Allan, if central banks sniff that something like that is coming, it’s not a problem. They will print trillions of $$$ and buy bonds, all the bad debts, stocks, real estate etc…to maintain their value. Since 2009, it is really different this time, as central banks want the markets to go up and they have unlimited buying power.
Global debt collapse, correct. Money printing, correct. Share market collapse, can’t agree. Stocks are the new gold; emerging markets share participation is fraction of US/Europe. Once these sleeping dragons awaken to the equities markets there will be buyers. What about the idea that CBs will buy equities with printed money causing share prices to increase? I view no debt collapse but a modified Japan style decade of increasing consumer inflation combined with modest buy steady uptrend in equities (subject of course to solar cycles).
unemployment rate is 5.8% given bij het government. Do you know the real %? Between 18% and 24% unemployment and that is good for the US because the US is booming! NOT!! Do you know the sales at black friday the day after thanksgiving? Also booming for you i assume! Keep dreaming!!
Nicholas – good point about US unemployment. The fact that it is still dropping is more evidence that solar activity is still around its maximum:
“…Over the last 64 years (from 1948), all 6 maximums of the solar activity were preceded by minimums of the US unemployment rate…”: http://ktwop.com/2013/04/02/does-the-solar-cycle-impact-the-global-economic-cycle/
So an upturn in US unemplyment, when it comes, should be a signal that solar activity is finally waning – that’ll be a double whammy for US stocks, but still some way off… In the meantime all those retail investors and bank account holders who are not partaking in the markets, and all that institutional money which has been leaving since around 2008, will probably be forced to buy in before they think its too late. That’s what epic bubbles are made of!
A useful chart from Mr Armstrong which shows how US unemployment usually dips into each solar max and then increases as the sun stabilises: http://i0.wp.com/armstrongeconomics.com/wp-content/uploads/2013/01/unemployment.jpg
Eg. 1947, 1958, 1968/70, 1980, 1990, 2000; and of course during the weak and prolonged SC16.
Think outside the box. There are a trillion robots approaching who work for free, don’t need to sleep, and can do every kind of human work efficiently than humans. The USA is a one of the main developers of the robots. Labor cost should fall dramatically. Where will all of people be, maintaining robots, inventing stuff, service jobs that are better done by humans.
for those who work at jobs for a living, we ought to consider a shorter work week. The work week has not changed for more than 100 years. I’d rather see 4 people working 30 hour weeks than 3 people working 40 hour weeks and 1 person on unemployment or living under the freeway bridge.
BlueStar,
you are correct in that bull markets
end in euphoria, as they start during despair.
However even allowing for these latest employment
numbers being a measure of past activity,
there remains momentum for at least another multi month
period in the US economy.
That is the view markets are currently buying in to.
Bonds and many commodities are pointing to what
will eventually happen, lower global growth and the
next recession.
For now equities are deaf to these concerns.
The warning drum beat is likely to become louder as 2015
progresses on my take.
Agree. Its just Nicholas is the type of person the market rapes over and over again.
Nicholas’ comment is OK since this is how a market is made. For now, there are more buyers than sellers so shorts are Nicholas’ victims.
Nicholas,
It’s just not true I’m afraid, if it was that
easy and CB’s were omnipotent 2008/9
would never have happened.
Bear markets and economic cycles would never
happen, but they do.
I would not fight this now, odds are stacked
against those short seasonally
A number of us cautioned that remaining short
from mid november was likely unwise,
and that odds favoured further gains in to
year end.
There are no bonus points for that view,
as this positioning was shared by so many.
They guys who deserved credit are those that
spotted this incredible bull market early and
those that are still long and will leave the party
before closing time – they are the type of calls
that deserve respect.
Phil White +5 for your comments to Nicolas.
Nicolas I wish you well with your success. Please don’t overstay as Phil suggests.
Better to leave some on the table than get caught up in the ‘flush down’.
Good Luck to all.
reading these posts you can generally tell who’s carrying battle scars and who’s not
i think those scars are helpful in the long run but perhaps not in the short term
it’s amazing to see all the different time frames everybody uses
for me, i’m studying Paul Volcker’s tenure as fed chair
not by reading some authorized authors words but old newspapers and charts.
Volckers years at the fed bear little resemblence to how he is remembered.
Specie, two of the things that have been hammered
home to me over the past near 30 years in markets,
are that bull markets always and I mean always last
longer than the majority of bears think,
and never last as long as some of the uber bulls think.
Have a good weekend everyone.
Quite clearly there are some that do not understand the implications of a global debt collapse.
There come a time when no amount of printing can restore consumer confidence nor investor appetite for stocks. It is as simple as that.
They can print ’til their hearts content, but if there is no desire it will matter didely squat.
Last thing I will say on the matter. An etimated $780 – 1.2k trillion global derivatives market. How much liability? How much exposure? How fast can all the Central Banks print if it takes even a 1% hit globally and how many would have a appetite for risk under those circumstances anyway?
I have no doubt in my mind that we are headed into massive collapse. And I want zero exposure when it begins because longs will get wiped out completely.
ALLAN yawn, u been wrong on so many calls last time u said short apple it went 3000!!!!!! pips higher oh and dax bearish mmmmm now 500 higher oh and I was crazy to short nasdaq at 3861 mmm now 4315!!
Rob,excuse me I never said to short anything. Get it right. I have said repeatedly that I would not short this market. Suggesting a market could be turning and actually shorting are completely different.
Im with u Allan, I have never shorted this market but ain’t uber bullish either.
DP, as if by fate ZH just posted the following article below. Longs really have the “bull by the horns” here. Yes pun intended.
The easy money was made between 2009-13. The last 12 months has seen risk increase exponentionally and with each passing week that risk increases. I see it as foolish to chase stocks higher or even hold at this point.
Each to his own.
Cheers
“Bottom line—you don’t HAVE to be invested in the market. Sometimes the best investment you make is the investment you don’t make.”
http://www.zerohedge.com/news/2014-12-05/heres-what-happens-when-you-buy-stocks-their-all-time-highs
“Each to his own”. Some will understandably not want to touch stocks with a bargepole. Others will understandably see things like this as a punt worth taking: http://www.seasonalcharts.com/zyklen_dekad_dowjones_100j.html
Mark,
I have updated my charting software with sunspot data from NASA from year 1900. I need your help in establishing relationship of sunspot (which smoothing to use etc) with Dow Jones. Can you please post your email ID?
Jigs – you can reach me at markko2002-fib@yahoo.co.uk
JOHNATHAN SCOTT, usd/jpy at 130 sept 2015 if it keeps going like it has been it could get there by next Friday!! don’t u love these crazy times
Betafish’s ‘Think outside the box’ comment above is very valid. Robotics is going to usher in the same kind of paradigm shift that industrialisation brought to farming and the horse carriage.
Some year’s back an Electronics Engineer/Author (based on failing memory here) wrote a couple of ebooks about how society could adapt to this new paradigm.
In his first book he outlined an ‘elite’ group that enjoyed the benefits of robotics and used the robotics to ‘control’ the masses into faceless, nameless housing prisons. In this book the ability of robots to ‘recognise by sight’ was key to their next stage of development. This book was believable and scary as hell!!
In his second book he took 2 characters from the first book scenario and planted them in a second scenario. This 2nd scenario revolved around Robotics having reached a higher state of evolution to the point that matter could be transformed ala 3D Printer type technology. However under the 2nd scenario a couple of philanthropic scientists who developed the technology provided unlimited benefits to all within their society. Since robots could take any material and change it to any other material there was never any shortage of anything. Humans were therefore finally free to do whatever they desired.
The TWIST in this ebook is the brilliant concept of a Vertebrain. To join the society you had to allow yourself to be implanted with a chip which effectively segregated your mind/imagination from the physical function of your body via a chip implanted into your vertebrae. i.e. You would believe (in your mind) that you were on the Golf Course, Beach wherever whilst your body continued it’s mundane tasks of brushing teeth and combing hair.
I am fairly certain that within the next 30-50 years we will be at or near that stage of technological development. The question is which path will us mere mortals take.
This may sound like it has nothing to do with investing but if as Betafish suggests ‘Think outside the box’ and then it has EVERYTHING to do with it.
The madness we currently live with will end in some way. Cast your votes on which it will be.
BTW a request. I have trawled Google to find these 2 ebooks again but I can’t. If anyone here knows their URLs then please may I request that you post them here.
Thanks and have a great week end.
Thought we might get a full reversal today… guess snot
pretty ugly candle though
we won’t know till Monday. Maybe it was too obvious, everyone knows the market often reverses on NFP days and often reverses on full moon or new moon days. Tomorrow is a full moon. But if everyone knows these things and everyone is expecting a reversal here, it just might not happen.
We have to remember that many of us are talking different timeframes. Traders (prop) that make a living from this did not buy in 2009 and held positions until now. We find opportunities all the time that we feel are tradeable and these can either be with or against the underlying trend in whatever market we are looking at. This should not be confused with longer term activities and what I term “investing”.
This week for example, I have entered and closed 37 trades. 26 of these were long trades, 8 out of which were stopped and the rest more or less hit target. In the case of the short trades, 4 were stopped and 7 more or less hit target. These were mainly equities positions as well as 3x commodities and 6 derivatives trades. I still have 8 positions relating to equities running, 7 of which are long positions.
On the investing front, I still hold 31% of my equities-related longs from late 2009 across the UK, US and European areas as well as 52% of my long positions focussed on China and the “emerging Asian” arena. I sold my final tranche of Japanese equities holdings in June this year.
The point I am trying to get across is that we need to bear in mind timframes. Phil (I think it was you?) is suggesting not to short the market until Q3 or whatever next year. That is a statement by someone who definitely does not make a living from trading, and his comments should be taken in that context by those that do. From an investing angle (or with my investment “hat” on) his comments make more sense to me whether I agree or not.
I guess to boil it all down to a sentence I would have to say that I don’t know any traders personally that are long or short only for any length of time. I know plenty of investors though who love the big blue numbers on their positions after holding for 3-6 years – and some of these guys will always sell when they panic after their holdings have fallen 40%+ from the peak when they realised that they had in fact made no money at all, it was just nice numbers on a screen. For a trader this would of course be wholly unacceptable.
J
Yes absolutely, Jegersmart. Time frames are different for different folks. Something that is easily lost in the discussion unless each person first outlines their timeframe.
Phil for instance has repeatedly said that he is not expecting a ‘depressionary’ cycle until Q3 1915. That is completely different to someone else looking to next week’s expected moves.
Thanks for the reminder.
I’m a little bit curious if John will change his mind or not in the next post. I guess he probably will not.
A traders dream or a traders nightmare!
How can anybody comfortably trade something like this for instance. God only knows where it goes on Monday,it’s just as likely to be down 250 pts as up 250.
That is the legacy that Central Bankers are providing.
http://stockcharts.com/h-sc/ui?s=$DAX&p=D&b=5&g=0&id=p81152891824
This weekend is a magnet. Picture this : October 16th heliocentric earth/mercury conjunction. Dec 8th geocentric sun/mercury conjunction. Close to the full moon. 4 objects in line; sun,moon,mercury,earth. With Thursday heliocentric Jupiter max North declination, Friday heliocentric Venus max South declination. And Jupiter turning retrograde (g.c.). Thursday Venus and the moon out of bounds. Monday mercury out of bounds.
Solar activity gave a high on thursday. Solunar force is creating a bottom (= market high), with reading 10 on the 18th, reading 18 on the 3rd and reading 14 on the 10th. The rest of the month will not see these values again.
So from every angle I look; everything points to a significant turn.
Solar activity peaks September 2015, as per my indicator and confirmed by the Neptune/Jupiter opposition in that same month.
Apo peri ends a multi year uptrend in December. So the next 8/9 should get interesting as gravity no longer supports the solunar force, as was the case from the low in 2009 until now. And my solunar force indicator suggests that the 17.07 year solar cycle (Svalgaard) that started in 1998 turns in 2015.
Longer term solar activity is in an up trend for several decades. But turns like this should create some years of turbulence before the uptrend resumes.
Cheers,
André
The Sept’15 time frame fits in with what Phil has been saying and also Martin Armstrong, although the latter’s posts are getting too weird to be taken seriously. His cycle work still seems relevant.
The real question now is what force is stronger. From 2009 on both solar activity and gravity where positive for the market. But that ends this month.
Not sure how this will turn out. New QE programs in January may kick the can some further down the road. But 2015 will start the bearmarket with a low in 2018 at least.
typo; next 8/9 months
Additional.
From the October 15 low it is exactly 3 time 17 days (51) to dec 5. 17 days ago we had earth opposite mercury, and solunar force creating the extreme low reading of 10. With a 17 year solar cycle, a 17 day cycle is feasible.
Just an observation….
Die Welt is reporting that Draghi has lost the majority needed to pass direct bond purhases.
ECB QE is dead in the water if that is the case and the European markets are not going to like it.
I wonder how much insider money has been offloaded on rhe DAX in recent weeks to “buy the dip” suckers?
It is unclear to me whether it is illegal for the ECB to start bond purchases. Different reports suggest that the legal side is the real hindrance, others report that the loss of majority mentioned is the real problem and then others reporting that actually Draghi doesn’t need a majority and there are no legal barriers…..
J
Maastricht treaty does no provide for member states to shoulder responsibility for sovereign debt of others. Sovereign bond buying by Draghi would need a change in Maastricht treaty. Weidman and Draghi epitomize this lack of contractual clarity with the former relying on what the law says and the latter trying to operate outside.
Pegasus, do you see a wedge forming on the US$ daily chart (from early Oct to present)? Looks like the 90 level may give it an over throw and reverse or breakout to the upside and really take off. Rsi is screaming for reversal but if it takes off to the top side then it may push the $/y above the 103-104 level and from what I have read, this is the level where the nikkei may disconnect from the $/y.
Interesting James. Thanks.
What I saw on Friday is wave 5 equal wave 3 in the up move since 2011 in $/y. Also parallel channel hit from that same move. Nikkei near 2007 highs. S&P at 162 pct of 2007. Lots of stuff coming together here. Like the charts kimble put together.
http://blog.kimblechartingsolutions.com/#sthash.yCMRGBQ5.dpbs
also Biotech NBI at 2x 2000 high
Pegasus, I see your waves. I think many people wants to see this, $/Y, to correct but I see the shorts, who have their stop losses right above recent highs, as part of reason this leg keep extending. Falling all over each other trying to get out of the way.
I am sure Government Sachs can help them break the necessary covenants. For a fee:)
J
Dollar jumps most in a year and Yen is expected to continue weakening:
http://www.businessweek.com/news/2014-12-06/dollar-jumps-most-in-year-as-job-gains-show-u-dot-s-dot-recovery
Should Yen keep weakening (Yen carry trade is alive and well) will US Stocks keep rising too?
Huge split inside the ECB:
http://uk.businessinsider.com/europes-central-bankers-are-now-brutally-divided-2014-12
European economic meltdown:
http://www.businessinsider.com/europe-and-deflation-2014-10#ixzz3KMHaFfTp
Somewhat lengthy analysis proposing that the game since mid-2012 has been long Nikkei/short gold:
http://www.zerohedge.com/news/2014-12-04/inside-look-shocking-role-gold-new-normal
Positive correlation between gold and yen also.
Interesting, Thanks.
Hidenberg Omen points towards disaster in stocks:
http://finance.yahoo.com/blogs/talking-numbers/this-rare-indicator-is-pointing-to-disaster-225834766.html
there have been dozens of these over the last several years. Obviously, most are false signals.
That gold in €uros chart delivered a buy signal this week:
http://scharts.co/1wJRNme
Similar story in Sterling: http://scharts.co/12vZs9X
Interesting analysis on that cancelled Russian gas pipeline: http://www.informationclearinghouse.info/article40381.htm
Monthly chart: http://stockcharts.com/h-sc/ui?s=$NATGAS&p=M&b=9&g=5&id=p48086527490&a=379400466&r=1417883967245&cmd=print
That Hidenburg Omen seems like a load of s**t to me….I mean who uses an indicator that only works occasionally? Sooner or later any indicator will be right, or our perecption of what the indicator is telling us will be right…..:)
As this market is purely sentiment driven I am more interested in seeing when this changes…
J
Just an update of what I’m seeing this past week…..
A little more erosion in Money-flow on the US stock indexes, and a little more erosion in the junk bond area… As the stock indexes trudge just a touch higher…
By my eye, nothing has changed, and in fact gotten a ~little~ worse for the outlook of stocks… Yet, here we are…
No bueno for me this week…. Not terrible, but not helpful….
On the other hand, I’m sure guys like Nicolas are just “killin’ it”….
Because it’s just “so easy” to make money in this market… 😉
Yes, Nicolas I suspect is just a troll. Nothing to see here…..
J
J, Barry I’m sure you guys don’t need to be playing in the same c33s pit that Nicolas is playing in. Let N be.
N’s time is nigh!! Lol.
Lets please just concentrate on the bigger Market issues and help each other with our collective ideas.
As 7442 Analytics explains it “the Spiral is a quantum computer -1 +1 -1 +1 .. etc. In other words .. we’re simply rotating an electric motor inversely charged at 45 degrees .. causing Upward or downward charge.” Yes, the direction is around through the quadrants in prograde and retrograde phases (+ and -). For this time period those phases are prograde 8:00 to next day 3:00 and retrograde 3:00 to 8:00. This is the basic pattern for this time period. However, there are events that create an opposite charge and the direction of the phase will reverse. This is only important if you are an intraday trader. In an effort to simplify the Spiral for swing traders, here’s a link to a color-coded chart of the Singularity and Expansion cits for the Spiral and the expected pattern. https://twitter.com/mjmateer
Peggy,
Interesting stuff on the spiral. I’ve been struggling to understand, but I have been following your posts and the 7442 Facebook page. Have you seen any other correlations with spiral (besides market), like tides or other markets? Was there anything that helped in your understanding? Do you have a view on why it works? Thanks for the insight,
SC
This series of youtube videos may help you understand what the Spiral is, how it works and how ubiquitous it is. https://www.youtube.com/watch?v=9EPlyiW-xGI&index=1&list=PL7bI0UKdqdZLZ3WwRNSvexzukUQ1tD2hy
Very much appreciated. Going start watching right now.
SC
As we enter bullish seasonality some predict that SPX will reach 2300 next year. If you arr short make sure you are prepared if this does reach its target.
http://www.marketwatch.com/story/stock-market-gurus-new-forecast-sp-500-at-2300-in-six-months-2014-12-05?mod=mw_share_twitter&n_play=5482558ce4b0c5a996a99ef9
7442: syndicates, carry, etc.
Correct my misunderstanding; but don’t they want money up front? So they require an investment based on faith? How does one do any due diligence based on past trading results?
7442 has posted plenty of free information – enough to trade successfully every year going forward.
Re the “Primer Fields” Youtube videos, the narrator guy lost me quite quickly:
1. When he compared the patterns on the balls used in the experiments to the architecture and pattersn found in several old (religious mostly) buildings around the world – and at one point making a leap that it is “a sign from God”.
2. When he spends 30 seconds making sure that we understand the various patents that apply to his magnetic field emitters.
I personally cannot trust or take seriously a person that has the naivety displayed in point 1 and the monetary motivation for his theory to succeed.
Shame. Perhaps there are better sources of information available?
J
It would also be very interesting to see whether 7442 have anything of value over time. I have worked with organisations that have billions of USD to spend on teams doing quanting and R&D to develop a system for trading, risk management and so on. So far, at least to my knowledge no system has been found that works in the longer term. They all blow up sooner or later, again to the best of my knowledge. Certainly if someone had found a system like that, they wouldn’t be sharing it with anyone – like 7442 are doing.
Somewhere in my mind I have accepted the likelihood that many things are just random, no matter how much we want to be able to analyse and predict them.
Lastly, “Peggy’s” last comment is starting to undermine his or her own credibility now in terms of 7442 – at least from my view I am sorry to say. This is because it is stated that “there is enough free information given to trade every year going forward”. To me that screams of either naivety, monetary motivation or having been fooled by randomness. Or maybe a combination.
No offence intended by the way, but there has to be some robust debate about these sorts of claims imho.
J
Let’s start with addressing incredulity about the Spiral (torus) with a recent news article. http://www.zmescience.com/space/earth-shield-killer-electrons-5423563453/
Next – addressing incredulity about trading using only 7442 Analytic’s Spiral Singularity and Expansion dates. https://twitter.com/mjmateer
Lastly, there is a difference between “robust debate” and ranting.
Using Vukcevic’s formula (http://www.vukcevic.talktalk.net/) and the solunar force indicator on time-price research I created two brand new indicators that show gravity and solar activity. Conceptually they are sound and give me a new insight in what is going on.More than ever, I found that two forces are at work at any given moment, and you need to analyze them both. I no longer use tides as I now understand the concept of gravity and realize that calculating gravity solves many problems.
Anyway, this week I’ll create a new forecast. I have seen already that Solar force is the dominant force. Last week the gravitational cycle was down, but the solar force was up. Thursday sol.act. peaked and turned down with gravity, what gave the strongest wave this week; especially in Europe. Most of the time the two indicators are out of sync as you would expect. After all, the forces are totally different.
Now synchronicity gets a new meaning. For next week I see gravity is up into dec 14 and solar activity up into dec 15, with a low on dec 9. Now they both give local extremes and are in sync. I expect this to be a significant top. Next synchronicity appears around the feb 21/22 weekend. That will be a significant low.
As stated earlier, solar activity points to sept 2015 as the peak. This month will also feature the lowest gravitational pull of the year. This confluence is remarkable.
So my forecast hasn’t changed that much. Only now I believe the ATH will come in 2015, with december 15 a significant high, february 19-23 a significant low and then september 2015 the high. After that down into 2018.
I’ll work hard on analyzing the new data so next week I’ll give the shorter cycles that are relevant for swing trading. Now down into Tuesday and then a strong wave up into 15.
Cheers.
That seems a lot better……
It IS a lot better 😉
Thanks
Andre’ you are dealing with electroastrology as the sole determinant. Equally important is seasonals which are the inevitable result of pragmatic considerations of economic timing of price moves as macro psychological motivators. From my observations every month seasonals can be described as: first week up(whether complete or partial week, ie last week was a five day first week); second week down first three days, up last two; third week, up; second to last full week down all week; last week up. Ergo, I postulate that Mon,Tue,Wed of this week will be seasonally down which may moderate your bullish electroastrological forecast.
Thanks, I’ll have a look at that.
André
GDXJ – still in the down channel after a preliminary bust-out mid-year, look at that volume, weekly retest variation buy setup (sig low, higher close(s), lower close(s) that don’t break SL, all within 5 periods…).
I will buy a break of last week’s high with an initial stop under the low, possibly see if I can get a tighter entry via the daily – http://scharts.co/1u2CJKk
I have been a bit puzzled by GDXJ’s underperfomrance relative to gold itself. But last week’s action seem to suggest a test of support on a lower volume. Maybe it will start a rally int eh coming week provided gold doesn’t fall hard.
7442: Trade the best and sell the rest? Peggy do you have a financial interest in this company? Inquiring research minds want to know! Jegersmart has articulated the position quite well.
No.
I think you lend new dimensions to the phrase; assumptionless research. (:-)
Thanks again for sharing your valued work.
Trading GOOGL daily with the same 2 Singularity dates year after year. https://twitter.com/mjmateer You’re welcome! 🙂
Lunatics, and gravo-electrolites:
Interesting factoids from connectable 19 year old tunnels to the past. After a strong run from 10/14/2014, the S&P reached 2080 on Friday at a Full Moon, max declination, maximum speed, and Apogee to follow on 12/12/2014. On 12/6/1995, after a strong run from 10/27/1995, the S&P topped at 621 (rose again to 623 on 12/13/1995 before declining), at Full Moon, Apogee on 12/9/1995, maximum declination. On 12/3/1976 the market bottomed, before advancing into 1977, just before a Full Moon and maximum declination, but at Apogee on the 12/3/1976. On November 30, 1957 the market peaked, at Apogee, 6 days later a Full Moon, and maximum declination. On 11/28/1938 the market bottomed, at Apogee, 4 days after minimum declination, between new and full moon. I haven’t checked to see what happened around Apogee in November 1919 and 1900. Note that after 19 years the Anomalistic Cycle is short of the Metonic Cycle by 4.15 days, and that after 7 such cycles it realigns, but with a shift = to one lunar month. We shall see,
SC
Are you saying we may top soon?
BlueStar,
Not really saying, but it is interesting that these tunnels connect to past at similar points in time there were definitely pivots (highs and lows), and we are certainly not at a low now. However, if this is a high, it doesn’t mean it is THE high. I believe that we are due for a correction, followed by an additional rally. Then a more significant top. In the summer, in one of Johns blogs, I had a post that essentially said I believed that John’s approach had already been validated. Problem most of the other markets around the world (equity, debt, commodity,…) were the weakest links and the first to break – which they clearly have. The US equity and Debt markets were in the best shape relatively speaking (healthiest horse in the glue factory), so as capital flees its point of origin, it will come to us equities/debt. This will keep them elevated, which it has. When does the market break? When the flow of capital to US decelerates. Don’t think yet (although it is beginning to feel a little like James Dean in Rebel without a Cause playing the ‘drag race game of chicken at the cliff’).
SC
Thanks! Elliot wave guys think the first week of December has market significant tops and bottoms. They think the Dow may have topped on Friday. Also here is great article on Hindenburg Omen with more rigor than most.
http://www.safehaven.com/article/36041/we-got-an-official-confirmed-hindenburg-omen-on-december-2nd-2014
Honestly, I have no idea how any of this 7442 / Gravity / Spiral / New Moon / Full Moon / Retrograde / Solar / etc. stuff works….
And I have a hard time believing it actually does work, to tell the truth…
On the other hand, I’m still holding a somewhat underwater position as well, so maybe my own technical analysis leaves something to be desired too….
That said, looking over a LOT of charts today – while I kindof watch football too, so not a complete waste of a day.. hahaha
Anyway, most of these are charts I haven’t looked at in months… Just scrolling through….. Maybe 5-10 seconds a chart, just to get a look-see….
I have to say, I am shocked to see how much damage there has ALREADY been done, to a LOT of stocks….
How we’re at record highs right now, is really surprising….
And I know I’m beginning to sound like a broken record, but the more I see, the more I think that when this thing breaks, this is going to be astounding……
And not in a bullish way…
Good luck, folks… Interesting times ahead..
Of that, I am sure…
Read Lunar Edge article on the home page of this website. It shows conclusively that Full Moon plus four days to New Moon plus four days gather in most of the gains for the whole year. This is electroastrologic 101 and if you accept it and verify it with charts you will be encouraged to find out more about this fascinating approach to trading.
Barry,
I understand. At first it is difficult to accept. And frankly, to accept requires a level of understanding, which requires an enormous amount of work with little guidance. I strongly believe that the very best at this business looked at cycles of time associated with the heavens, &/or the Law of Vibration. This includes those in the past, and currently. They have success rates north of 85%, many at close to 93%. They will help, but they do not spoon feed, obvious answers are never given. In that way I have learner so much, not just about the markets, but how life and the universe is put together. Like Einstein said, ‘God does not play with dice’. I would add, anything we think is random is simply a reflection of our inability to understand &/or lack of knowledge (e.g. see the discussion of black holes,…in the video that Peggy recently provided as a potential example).
SC
It does work but only because these are “fixed” cycles. Over a period of time there will be some statistical edges ofcourse but to suggest that geomagentism, the moon etc etc is what drives the market is way way wide of the mark. Unfortunately its human nature to find a reason for something, it is also human nature to over intellectualise to the point where that person convinces themselves of their work beyond reasonable doubt. I do not deny that there are smarter individuals than i however over intellectualising is a fantastic way to lead oneself down the wrong path. I have the key and it does not lie in the planets or an orbiting rock, it is much closer to home than that.
To argue that for example mercury retrogrades don’t matter contradicts Gann, Bayer etc. and printing a few years of any market and looking at price moves during retrogrades shows clearly more volatility and typically upward price moves during these retrogrades.
More reasons to be bullish. See article below. The contrarian trade is long im afraid. John has collated a lot of evidence to be bearish but when you see financials performing strongly Its like saying its different this time. I hope John is right but right now im siding with Steve T’s view that this market could still double.
http://ceo.ca/2014/12/07/j-c-parets-i-see-zero-evidence-that-interest-rates-are-heading-higher/
Last Friday’s rally in US stocks was tepid compared to the NFP. It should also be noted that last Friday the CFTC reported the greatest net longs US Dollar by Large Specs in history. That net long was for all the major currency futures and not just the US Dollar index futures. This points towards an intermediate swing top in for both US Stocks and Dollar this week. It doesn’t mean “the top” for stocks but then again it could. I expect profit taking for both to happen this week.
For Intermediate swing Traders: Historically, the November NFP is one of the best months if not the best month of any year that is followed by December being one of the worst months of the year. November’s NFP was a blowout number that did little to move the markets much further, especially the Euro compared to Thursday’s news/reversal. If markets are forward looking, with American Thanksgiving holiday sales being weak, points to December’s NFP being the worst of 2014 which means at least an Intermediate turn in the Dollar and stocks if not something bigger (Medium turn).
that is interesting. Looked back at very l-t charts and the $/Y is facing another falling trend line starting in 1979/80 or a major $ low. This line is within touching distance (1-2%). More s-t term the rising wedge is broken at 119.80 so price has some work to do here.
Also found the l-t analysis by the voodoo analyst very helpful which makes clear we are witnessing a bear market rally in the $ within a long term down-trend.
http://www.thevoodooanalyst.com/currencies/us-dollar/124-us-dollar-index-analysis-december-2014-w-m-y
http://fxtop.com/en/historical-exchange-rates-graph-zoom.php?C1=USD&C2=JPY&A=1&DD1=01&MM1=01&YYYY1=1953&DD2=07&MM2=12&YYYY2=2014&LARGE=2&LANG=en&VAR=0&MM1M=0&MM3M=0&MM1Y=1
With the blowout November NFP out of the way the markets are going to start focusing on what Americans really are doing with their gasoline savings –and– to the weekly New Claims. If Americans are not spending their gasoline savings on consumer goods then Inflation is going to fall more than expected and that means no interest rate rise which translates into a weaker US Dollar. A whipsaw could occur in the markets as November’s NFP is unusually strong to be followed by an unusually weak December NFP.
China 2015 GDP forecast might be leaked early (this week instead of March) and be a negative for US stocks:
http://www.cnbc.com/id/102242079#.
Smart investors are worried:
http://finance.yahoo.com/blogs/talking-numbers/here-s-why-some-smart-investors-are-worried-223442685.html
The NFP is an interesting one. UPS probably hired 80-90k workers alone for the Xmas period to deliver cope with the seasonal demand. 38.2% of the working age population in the US is either not working or looking for work and this has been fairly static for many years.
J
that should be *not* looking for work……
It should be noted that on daily charts the Euro is making a descending triangle. Ellioticians hold that descending/ascending triangles only occur at the end of much larger wave counts which means that they always point to major trend reversals. In current market conditions a major trend reversal in the Euro means a major trend reversal in the Dollar and US stocks.
Major BOJ policy change underway points to end of Yen weakening:
http://finance.yahoo.com/news/boj-increasingly-likely-cut-price-085858870.html
See it – 1.245 break with target 1.34.
On $/y break 1.20 with target 108
Pound and Yen are already reversing today as Euro attempts a “throw under” of a Descending Triangle. US Dollar index futures are at major resistance. Since I have started posting here several weeks ago I have consistently said that a major change in stocks will probably be led by a major change in the currencies. John has pointed out that Full/New Moons tend to change trends in US Stocks markets. Even though he shows that Full Moons tend to change stock market trends at lows sometimes Full Moons change trends at highs too.
Not only does it look like that the Pound and Yen are reversing but so are the New Zealand and Australian Dollars. As this is happening it looks like the Euro has found major support at 12250. Even though Full Moons tend to reverse US Stocks at lows it looks like the current Full Moon is reversing the currencies against the US Dollar at lows while US Stocks are reversing at highs.
Wild times dead ahead:
http://finance.yahoo.com/news/rate-rises-spark-massive-volatility-110428743.html
Richard,
Your outlook appears to rapidly cycle between
expectations of some parabolic bubble in stocks,
to large downside risk.
While I admire flexibility in outlook,
such rapid changes are difficult to take seriously imv.
My basic premise is that the “power” in markets at this time is in the currencies and that US stocks would “top” in January. With John’s research that US stocks tend to top at New Moons and bottom at Full Moons points to two possibilities. The first is that US stocks are going to accelerate higher from this Full Moon to the next New Moon and that my original expectations for “the top” in US stocks to be with a Full Moon in January. However, given that I think the “power” in markets is in the currencies, and not stocks, points toward what ever the “power” is that reverses markets at lowd with a Full Moon is in fact happening but in currencies instead of stocks. This means that expecting US Stocks to accelerate higher from now to the next New Moon is a losing position though it could be very scary for those holding short positions like John may still be doing. I expect there is anxiety of those holding short stock positions expecting a rally up to the next New Moon from here. But if I am correct that the “power” of a Full Moon is going to be reflected where I think the market “power” is then it means the normal turn higher at a Full Moon is under way but that means that Stocks will turn down at this Full Moon instead of rallying higher as the Full Moon turns currencies higher instead of stocks.
I am not saying this is “the top” in stocks but what I am saying is this is most likely an Intermediate to Medium turn lower in stocks with a potential major turn in currencies. This affords the opportunity for those short in stocks to make profits or cut their loses short before a rally to higher prices starts all over again.
Another one of my oops: I expect the top in stocks in January to be with a New Moon and not a Full Moon which holds with John’s research in this area.
Bipolar?
Crude and bond yields are the main areas to watch currently.
Crude selling off hard again this am, for bears who want/expect
significant short term equity downside there needs to be
a rapid loss in confidence in the 2015 global growth outlook.
The latest US pay role reports makes that a little more
difficult as it helps the bullish position, however as I have
remarked a number of times bond yields and commodities
are indicating significant lower growth at some point in 2015.
This could reverse, however it looks a clear sign currently.
Anyone who is short US stocks aught to be very concerned as John’s research of New Moons being highs in US stocks points to a rally for the next two weeks. But I am of the opinion that an “inversion” in the usual Full Moon/bottom is what has happened meaning that with this Full Moon US stocks are topping not bottoming. This is not the normal call and is against the odds as shown by his research but it is allowable. I think that this Full Moon will be a high and the next Full Moon will be the usual low. This means a four week decline in US Stocks with a two week rally to follow up to the New Moon in the middle of January. None-the-less I am expecting this Full Moon to turn something up from its lows and that is the currency/dollar pairs.
McDonalds just reported that is November same store sales is much less than its October same store sales. It also reported that its US same store sales fell much more than either its European same store sales or its international same store sales. This points toward the currencies rallying against the USD and for US stocks to decline which all fits with what I am expecting with this Full Moon.
Looks like you are right.
Very few people still short here.
Everyone is long $ and long stocks.
funny
MCD is more difficult to gauge as an accurate(US)
indicator than in the past, as that space has become
extra competitive – it’s always been a highly competitive
area but there are multiple new competitors entering the space.
Having said that I do watch MCD and highlighted their
last statement here, along with ULVR and STAN,
they point to global growth slowing.
Could it be that with Hedge Funds betting that the lows in Crude are in that many more Hedge Funds are going to bet that the highs for the Dollar are also in:
http://finance.yahoo.com/news/hedge-funds-betting-opec-led-045053264.html
Could it be that this Full Moon is going to make major turns higher in Currencies and Crude along with a major turn lower in USD while making a rare inverted turn in US Stocks that is only an intermediate/medium turn lower in stocks to be reversed with higher highs to come after next month’s usual Full Moon stock low? The CFTC’s Crude and Currency positions report this past Friday point to this happening with this particular Full Moon.
Richard i think you might be onto to something here because oil, AUD, EUR, YEN are all oversold to degrees that one might not have seen in ages. It does look like things might start turning here, even if it’s just temporary.
my gut feel is that it may be temporary, but could be a nasty temporary.
This past Friday’s aggregate net shorts of the major currency futures by Large Specs, as reported by the CFTC, is at an all time high pointing towards no more selling to push the currencies lower, but, rather, unprecedented profit taking that sends the currencies strongly higher. This “fits” with the historical resistance of the US Dollar index futures at current levels, the descending triangle pattern on daily charts of the Euro as per EW major reversal patterns, and the Full Moon turning markets.
expect a test of wedge at 120 shortly. Unless it holds bull case not safe.
Biotech in tulip mania stage.
looks like the $/Y is fighting to make a bottom here. is this a begining of leg 4 in your reading?, if so, what level do you see leg 4 ends?
Hi all ! Another good day for QQQ and IBB. Where’s John ? Is he bankrupt ?
Nicolas there is a LOT we’ll take of your crap BUT if you start bad mouthing our HOST then you should be afraid be VERY AFRAID.
+13bps QQQ?
It’s nice to: —Play nicely in the home of your host..
don’t feed the troll……I already told you….
J
You are right J. I’ll keep my digital ink dry.
Pegasus,
the 2014 bear case has been lost, I think we can safely
say that now.
Thank you Phil. You may have blessed us.
Is there a point/price in the decline of Crude that would stop helping the US economy and starting hurting the US economy –while– greatly helping the European and Japanese economies? Should Crude not turn back with the current Full Moon but accelerate its decline with the Full Moon –and– on down to the next New Moon (in two weeks) might that help the currencies to rally with the current Full Moon even more than expected? With the Large Spec net aggregate shorts of the major currencies at an all time extreme points to the best short covering rally of all time in the currencies against the USD especially if Crude somehow and unexpectedly helps it.
Note: This could also be a factor in US stocks topping and turning down with the current Full Moon instead of rallying up higher.
Richard,
Check out this analysis: http://ibankcoin.com/bluestar/2014/12/08/oil-the-dollar-and-equities-a-curious-correlation/
Oil crashes eventually hurt equities over time.
Interesting, John and everyone needs to read it and see the chart. I think that the Dollar will fall and not only US Stocks.
hurtful if crude price is so low that debts can’t be repaid and we see massive defaults…and cause collateral damages.
I plan to buy the bottom of the oil giants. Nothing new under the (Wall Street’s) sun. Pain needs more pain for it to go away when participants would change their way. Oil consolidation is good.
I still own SPX 1,450 and STOXX 50 at 2,500 from 2012. I see no bear case to get out yet.
Has there been any research to see if New/Full Moons don’t turn markets but accelerate markets in their ongoing trends?
We need to think outside of the box concerning New/Full Moons and what they can do. If they can accelerate markets instead of turning them then that may be what is going to happen to Crude.
Yes with Crude it certainly looks like acceleration, although whether that is due to Full Moon is beyond my meagre analytical capabilities in that sphere.
Should the Hedge Funds that have been reported trying to call a low in Crude are wrong then when they panic sell their long positions, at growing loses, they will accelerate Crude lower and faster then what it would have done with out their premature buying. Those Hedge Funds may have targeted this Full Moon to stop the price decline intentionally or they may have acted subconsciously with no intent but the results are the same: Crude accelerates lower with this Full Moon.
Thinking outside the box: Crude accelerates its decline with the current Full Moon while US stocks do a rare inversion and top out and turn down with the current Full Moon. Both trend down to the Full Moon of January wherein both turn up in a major way; meanwhile, the currencies rally strongly as most of those economies benefit from further falling Crude while the US economy goes from benefiting from falling Crude to being hurt by further falling Crude prices.
As a student of market lunology, I have observed the primary full/new effect is not volatility. Full moon three days before and three days after price has negative bias and typically trades about flat (some big downs, a few bigs ups, and many flats). New moon three and three have a positive bias with the same ratio of big ups and downs, but instead of many flats there are many upsloping 7 days periods. Last evening I looked for volatility patterns and found none that could be discerned.
blow off in biotech started in 2011 – backtest at around 1000 currently. As we have seen with silver in 2011 expect a backtest over the next 2-3 years. Same dynamics different asset class.
http://www.investing.com/indices/nasdaq-biotechnology-advanced-chart
bear attack
Bears always attack from above… This may be the end of big sucker rally that began at SPX 1075 on Oct 4th, 2011 (1004 points).
It might even be the end of A-B-C move that started in March 2009 and formed D-wave of the triangle that started in 2000. We know the consequences – dramatic E wave decline. I hope what we get is only major bankruptcies and economic decline but I fear even more dire events lay in near future.
Question: Have US stocks been “priced to perfection” on the assumption that Crude would not decline anymore? Should Crude keep declining could it be that US stocks will no longer benefit from falling gasoline prices and its presumed consumer buying but US stocks will suffer as the American energy sector suffers.
It may be the opposite of European and Japanese stocks as continued falling Crude benefits both their consumers –and– their energy sectors. In other words, falling Crude only benefits the American economy to a point wherein it starts hurting the American economy via its type of energy sector but falling Crude continues to benefit the European and Japanese economies due to their different types of energy sectors. Has the point been reached in the American economy were continued falling Crude hurts instead of helps?
BlueStar
Oil is tanking, so may be some of your
prayers will be answered.
I think it’s too late for 2014,
2015 should be far more interesting.
Time will tell.
In 2009 when SPX was 666, my friends were looking for a yield of 6% to match the stock value in the 1970s. Well. They did not buy.
Now, people are calling oil to go down to the 50s, 30s….I bet when the bottom comes, only a few people will be buying.
Low oil price is sowing the seed for oil to go sky high sometime in the future when the consumer will cry again. I know my time frame.
I agree. But price and time. We have not had enough time yet.
WTI is nearly 4% off atm, unless I am seeing things.
Does anyone know what caused the big spike down at 12:10 Eastern? My own view is nothing moves without a ‘reason’ (however nebulous). Yet I can’t find any ‘reason’ for the sudden down draft. Anyone able to shine a light here? With grateful thanks.
It could be that the same Hedge Funds that have been trying to support the Crude market are also positioned long in stocks, therefor, as they run into margin calls in Crude they are raising money by selling out their longs in stocks. It could be the beginning of SHTF time for those Hedge Funds which means more US stock and Crude selling to come.
New thought: Money rotates out of US stocks and into European and Japanese stocks. As this money rotates it will take on a life of its own given the support that those CBs are giving or expected to give to those economies/stock markets. The trigger for this is the Full Moon and its inflexion on Crude. This means US stocks due a rare inversion of a Full Moon but European and Japanese stocks due not do a rare inversion with this Full Moon but accelerate up off this Full Moon to the New Moon in two weeks etc.
I am fully short until Wed. close: 1. apogee friday, apogee weak 4 days before.
2. first three days of second weeks are down
3. full moon plus four not yet
4. declination to south started 3 days ago, should be 13 days of weakness
5. and most importantly, price took out Fridays close-must use technicals imo
to make consistent profits.
Blue,
I read your article, may I ask at what
levels you may find XOM/Shell or BP
attractive?.
It all depends on oil. We must stabilize here. Be careful of the margin calls in the energy space. I would need to see a base form first.
I can speak of XOM…..it is running on a free cash-flow of 16 billion/yr. Jim Puplava called XOM ” the most efficient, technologically advanced, and disciplined company”
XOM will pick up a lot of cheap assets in this consolidation.
Nice Long Term Oil Chart from Ron Rosen at Gold-Eagle
Nice chart. The lower the better.
Hope i didn’t screw up your screen width
Here’s the one on gold
Good Charts!
Right before the most recent sharp drop in gold I said bad news for gold bugs. Rosen, Prechter, and Flannagan have all turned bullish.
A Black Swan event is starting to unfold in American markets but not necessarily European or Japanese markets. The timing of this event is the Full Moon.
Harvest moon of a different kind.
Thanks for the reply.
haven’t looked at gold for a while but man the daily chart sure shows a nice head/shoulders pattern and in the process of back testing the neckline…also a nice potential bull flag forming.
The Swing Trend Indicator is now on Full Sell.
$NYDEC (13 EMA) break-out. 1,600+ looks like a correction based on a fear of energy bonds default is underway.
Care to post a chart?
NFP Fridays and the following Mondays sure make for nice reversals
Spiral expects a low 12/10
you can be confident that gold has bottomed
the chief economist of one of the biggest banks
has just likened gold to “pet rocks”
Click to access gold2.pdf
Specie, you seem to have missed the point. He is saying 20% allocation in gold is too much for a Central bank.
I agree.
Gold could go to 500$, gold could go to 5000$. With such volatility you would be pretty stupid to have 20-30-50% of your net in such volatile asset.
I say 10% MAX and bury it in the ground if it makes you sleep better!
Funny
No, funny is when you hold a bag for 40 years.
I mean funny that somebody thinks I missed the point. This is an economist from the heart of the banksters. Of course he will do anything, everything anytime in anyway to denigrate gold, or anything else that might slow the printing and spending of fiat.
You get it, Specie. The big boys are doing everything they can to demonize gold for a reason: to keep the masses from doing the one thing that will protect them financially (buying physical gold and taking possession of it). Like many others, Big Tuna doesn’t understand gold at all. Gold isn’t “volatile”. It just sits there. Its volatility is a byproduct of the fraudulent paper futures markets and the endless printing of counterfeit, unbacked paper money.
Gold can’t go to $500 today for reasons that are obvious to those of us who understand the gold market and have traded it for a long time. The fractals and all related math show June of 2013’s $1179.40 as the critical level in gold, which is why the banksters can’t keep the gold price below that level for any length of time. (This price level is directly related to the shocking number of new currency units that are being created on a daily basis.)
Gold is money, and things like dollars, euros, yen and pounds are not. The latter four examples are frauds. They are money we’ve been forced to use at, essentially, the barrel of a gun. They do not have intrinsic value, one of the five characteristics a good money must have. (Aristotle was the first to describe these five characteristics.) Dollars, euros, yen, pounds, etc. will be exposed as frauds, most likely starting quite soon. Indeed, people the world over are already waking up to the fraud.
The Buiter piece is a hit piece. He well knows what gold is, and what it isn’t.
“Gold is money. Everything else is credit (debt).” — J.P. Morgan, while testifying in front of Congress in 1912.
“Paper money always reaches its intrinsic value — zero.” — Voltaire, in 1729
D.J. – very well said, i wish i had your talent for putting thoughts into words.
DJ,
Money has always been credit, I suggest you read the first section of David Graeber’s book coveting the subject.
Man has generally always abused his money, mostly for political purposes. The period when gold or silver were money was no different, the money was still abused via credit expansion.
Bernanke was correct: gold is just an asset, but a very special asset, worth holding for trouble times.
The removal of money from the political process is the solution to many of our troubles, and thankfully that’s what the Euro project is all about.
Time will show that the Euro is a Great Leap Forward for our species.
Ten reasons that there will be another Black Swan event some day (maybe soon):
http://www.forbes.com/sites/robertlenzner/2014/12/08/the-ten-reasons-why-there-will-be-another-systemic-financial-crisis/?partner=yahootix
A warning that lower gasoline prices is not helping consumers consume more:
http://finance.yahoo.com/tumblr/blog-are-investors-beginning-to-shun-social-media-193524827.html
Are US consumers imploding regardless of falling gasoline prices?
A very powerful reason why US consumers are in trouble and why lower gasoline prices aren’t helping consumers consume more:
http://finance.yahoo.com/news/6-reasons-your-phone-bill-keeps-rising-163915865.html
The popping of the Dot.com bubble brought on the collapse in 2000. Is the Social Media bubble popping going to bring on the collapse of 2015?
http://finance.yahoo.com/news/lendingclub-leads-end-of-year-push-for-tech-ipos-193743358.html
Here is a new and scary thought: Americans are so addicted to Social Media that they are doing as all Addicts do and that is that they are starving themselves to feed their addiction. This could be the “why” that McDonalds American same store sales fell so hard in November even though gasoline prices are falling. Stop and think outside the box: Would drug addicts take their savings from falling gasoline prices and buy consumer junk or would they take their savings from falling gasoline prices to buy more drugs for their addiction?
This is a must read for all who want to know why Chinese stocks are rallying so much of late:
http://qz.com/308153/the-shadowy-trading-behind-chinas-stock-market-boom/
A chart showing how far up Chinese stocks could go:
http://finance.yahoo.com/news/morgan-stanley-chinese-stocks-could-233047274.html
The Bubble in Chinese stocks has only just begun.
+ Asians are well know to like gambling. This could be the ultimate big stakes casino for them. I would not be surprised to see a moon shot like that.
Exactly, and the same could happen to Americans IF their stock buying leverage is increased to 10:1 like it was in the 1920s. Besides, it is different this time…..
Why are the Chinese and Japanese stock markets going up? What is the most favorable conditions for stocks? When the central bank is pumping money into a weak economy – read China and Japan. The excess money is forced into stocks and bonds. Think what QEing has done into our weak economy. It is very powerful.Tight money in a strong ecomomy is bad for stocks. The world wide ez money seems bullish and is unless the deflationary forces of debt collapse destroys more money than is being created.
good day for da bears.
$/Y was stopped in its tracks by the 6th out of 7 l-t fibonaccis I track (127.7, 122.29, 120.15, 117.8, 113.77, 112.31, 111.64). This blow off top was quite astounding and does not happen often (assuming this move is capped here). The move off the top looked impulsive so am looking for follow through into a retest of the 117.5 area. Also it could break back into a megaphone around current levels and a wedge break is near-by. Both target 108 which would bring unseasonal weakness in stocks.
The energy moves are ferocious and should help the bear case. I look at it from a simple gold oil arbitrage with both assets favorite among hoarders. While Gold reached is bear market bottom 1 year ago oil took a little longer. Also when looking at the 2000 low prices for both *(250, 12) then Gold approx. trades 5x its low currently which would imply 60 for oil (5x 12). So on an asset arbitrage basis among the 2 most favorite hoarding assets the recent move in oil makes sense.
big move down w/ the yuan, the $/Y just made an aggressive move down also, any idea if these are related?
if my wave count is correct then we have seen wave 1 down to 120.19, wave 2 up to 121 and are now starting wave 3 down – target 118.34. Not sure if the Yuan move is related.
looks impulsive – so would be characteristic of a wave 3
http://www.forexlive.com
bounced off wedge on the daily – at least know where rising support is now around 120.30
Pegasus, crazy stuff going on, the eur/yen is moving even faster than the $/yen, i believe around 147.60 is the support for another wedge in the eur/yen
another 200bps down and the 2x top is valid – short financials which have been very strong here should work well under that scenario. $/Y testing important daily uptrend – if it breaks 108 ultimate support – lots of airspace
just broke
just broke, do you mean 120.19? looks like it just did it the second time, will add some short positions on this when that level is ‘done’ for good.
bear raise
also this is the 62% retracement from 1998 to 2011 I believe – will be first natural support
Gentleman. I believe it has begun.
Any bets on a statement by super Mario today? Something along the lines of “I will do everything in my power to stop the stock markets from declining”
Does he have the power to increase European leverage to buy European stocks like was recently done in China?
Blue,
That’s a very big call to make.
Commodities are not my area,
however I mentioned oil many times recently
as thought a rapid decline may lead to some
beginning to question the 2015 global growth outlook.
That really is the crux of any immediate prospect
of significant equity declines – there has to be a loss
of confidence.
Markets would need to continue to sell off in to
Thursday/Friday imv, before you could even begin
to speculate that this may be something more significant.
Some recent and very relevant words from Richard Russell:
“It’s late 1957. The bull market had started up in June 1949. Suddenly a recession starts in late 1957. Sentiment among the crowd turns black bearish. The market sinks into a severe correction. I don’t believe that the bull market is over. People call me an idiot, but I am convinced that the bull market has a lot further to run. The reason is that the bull market never produced a third speculative phase. I write an article published in Barron’s to the effect that I expect a third highly speculative phase to appear ahead. People remain stubbornly bearish. They tell me I’m out of my mind. But I know that the market normally has a severe correction following the second phase of a bull market and just preceding the third speculative and final phase”
Late 1957 was the exact SC19 solar max (as measured by both SSN and ISN): http://www.solen.info/solar/cycl19.html
The Dow chart in 1956 and 1957 showed a very “obvious” topping pattern which was very similar to the present, and it did in fact quickly lose 20% into the late 1957 solar max.
But then, immediately following the solar max, the Dow increased by 61.8% over the next two years into late 1959.
If the similarity between then and now continues, that would put the Dow at 23300 by late 2016, but after a quick drop to 14400 which could start anytime soon.
In the past three weeks Chinese stocks have rallied 30%. If the DOW had rallied 30% in the past three weeks then it would have gone up over 5,100 points. In 2006 the Chinese stock leverage was 1:1. Now, the Chinese stock leverage is 10:1 just like the American stock leverage was in the 1920s. Why shouldn’t the American stock leverage be raised to 10:1 just like the Chinese stock leverage is and the American’s was in the 1920s. Don’t you know, this time is different.
After this current Black Swan event, localized to the Energy Sector, plays out, the FED will probably start a mild QE4 (the Yellen Put) while US stock leverage is increased. Thus, a hyper parabolic rally in Chinese and American stocks, together, to Fall, 2015, to be followed by the collapse to 2030 of the next mini-Ice Age. What is a 15 year decline from 2015 to 2030 when compared to the Japanese 25 year decline of 1989 to 2014?
$VIX hops above BB upper boundary. Correction got started just like Sept. 23rd? Today’s oil stock rally soften the drop.
$NYHL True Strength Index’s zero-line crossover agrees with VIX.
The last correction was a fat finger from a breadth’s standpoint. More volatility ahead.
Nice.
From KimbleChart:

I hope John updates soon, if possible.
Would be very careful about getting to pulled
in to the.. this is it outlook.
Let’s see where we are by Friday.
Phil I said last week to watch AAPL. Up until now it had been the mainstay. During the October decline it held up and only dropped in the later stages of the market sell-off.
This time it is leading the sell-off. This is extremely significant
News out of China leading the fall here this a.m in U.S Equities and “global appetite for risk” in general.
PBOC was now eager to pop the equity bubble following the PBOC simultaneously fixing the CNY significantly stronger (implicit tightening) and enforced considerably stricter collateral rules on short-term loans/repos – a move which according to estimates from Shenyin Wanguo Securities, would disqualify some 1.25 trillion yuan in corporate bonds as repo collateral, or 60% of all outstanding corporate bonds listed on China’s two stock exchanges
FK, I was actually extremely surprised that the Chinese politburo allowed the PBOC to fuel the SSEC to the extent it has. The move is absolutely suicidal
http://stockcharts.com/h-sc/ui?s=$SSEC&p=D&b=5&g=0&id=p67135092085
It may be that the rally was not only feed by the change in Leverage that the Chinese Public can buy stocks with but also that the Solar Max has not topped out yet but will top out in late 2015.
Japanese float a “trial balloon” for more deficit spending that will probably be shot down because the truth is that any further fall in the Yen is hurting more that it is helping:
http://www.bloomberg.com/news/2014-12-09/japan-weighs-up-to-3-trillion-yen-extra-budget-to-boost-economy.html
Shanghai Index in the nose bleed area for sure but still far too soon to tell what “lasting implications” this PBOC move will have but…..it looks like the Chinese are smart enough to see a bubble / address a bubble – unlike the boys out of Washington.
Should make for some fireworks here this week at the very least.
Exactly Richard…..the weak Yen is now indeed hurting more than it’s helping.
I expect to see it bottom right here alongside the USD top and the move towards a generally “risk off” enviroment to follow.
I continue to believe that Japan will be the trigger for global collapse and the starting point for a bond collapse contagion that will engulf the world.
How the BoJ could possibly think that increasing QE to the extent that they did would benefit the economy given that it had failed repeatedly in the past, so let’s do it some more, is beyond me.
They are destroying their currency on top of already destroying their bond market. Who in their right mind would entertain buying Japanese bonds?
It is now only a question of time before their folly comes back to haunt them and the rest of the world too.
FK you got your big red candle on y
The most fundamental problem of this Blog may be that the SC has not topped out as is presumed. The “evidence” of this is the stellar rally in Chinese stocks since July. Even though the leverage of the Chinese People to buy their stocks has increased and even though their media has been beating the war drums to buy stocks does not mean the Public would have done so IF the SC had not topped out and won’t top out until 2015. Given that some researchers are predicting that the SC has not topped out combined with the recent stellar rally in Chinese stocks does point to the top in the SC this year as being incorrect.
I agree. We’re nearing the top of wave 3 or just had it. This still requires a 4 and 5 probably topping somewhere near 2400 on SP-500.
Who are these researchers? I find it hard to believe that the SC has not topped out because of the polar field shifts.
AAPL to 108, looking good
DJIA to 17,600 by end of week, I’ll call this a loss since it’s 2 days late
Weakness began Thursday, somewhat. Sideways action is weakness.
i won’t be convinced of a stock “market” top til the biotech bubble bursts
yesterday’s ugly candle combined with a gap down today might just leave an ugly island at the top of the world of biowrecks
May I point out that from my research, WTI oil prices have hit a 1 x 1 Gann angle support today drawn from the 2008 low. Also, oil is the most oversold on a weekly or monthly basis since the 1980s. I think oil should have a rally from here.
Oil most oversold since the 1980’s. Remember, that was early in a 20 year bear mkt. In a bear mkt, oversold is bearish. It will usually go even lower after a buy signal (extremely oversold) and then it gets a descent rally. We are in that position now – due for a rally after a failed buy signal ie stopped out just before the rally. Gold and gold stocks in a similar position. The major drop in oil came while a oversold buy signal on a trendline totally failed.
Last July, large speculators had reached 5X their normally max long on commitment of traders. They are still 2.5X more than than their normal max. That is a lot of overhead resistance and underwater that wants out before more margin calls.
Allan,
yes I read your comments.
AAPL is up 40% in 12 months so
it’s no surprise that some of these gains
are being locked in – particularly when you look
at the 2 year % increase.
If markets continue to sell off in to Friday,
then the odds of this being more significant increase.
My guesstimate is this is a 2-4% move.
that $/Y looks like a short term capitulation? never seen it this volatile in a long time.
end of wave 3 – wave 4 up to 119.34 next
i was thinking the same thing, went long for a few minutes and got out,lol!
117.8-9 Fibonacci support
megaphone on $/Y comes in at 119.50 – could see a retest
thanks Pegasus, was going to ask you about retracement.
4th looks complete at 38%. Targets for 5th either 117.47 or 116.48 if it extends. Both make sense.
ES back in megaphone – need Biotech to break rising wedge and we have momentum in the bear case
next natural support for $/Y 116.35 at a rising trend line on daily which also forms as wedge – bulls might take a stance there.
You can’t make this stuff up….
Buiter, the citigroup econ chief who put out the hit piece on gold i posted
has now joined the Council on Foreign Relations
was the hit piece the price of admission?
or just that all the boys in the club think alike and they want one of their own to join?
island reversal biotech plus on the verge of wedge break – target 2610
http://www.investing.com/indices/nasdaq-biotechnology-advanced-chart
USD/JPY should be trading 115.65 the week of December 22.
see same – greek stocks down 13% today
OK, IBB and QQQ up now. Back to normal now with new record highs in sight. This correction is over.
just BTFD
$/Y megaphone line retest just now. Would expect next bear raid to start here.
50% retrace as wave 4 fits the rules – would look for an implulse 5th to ignite which brings us down in the 116. This will get rid of complacency by the bulls.
with geno if wave 5 extends (2.62) the target for $/Y is 115.27 for the 5th – or the next area of l-t support after 119/120 – would make sense for a bounce there
if we follow the script from the 1998 high in $/Y then next stop will be 108.5 (that will throw a lot of trading strategies into disarray).
Pegasus – This is the Swing Trend Indicator buy/sell dates on the daily SP-500 Chart. We got a new FULL SELL Yesterday
http://unbiasedswingtrades.blogspot.com/2014/12/swing-trend-full-sell-dates-from-2014.html
geno am I understanding your chart correctly? It seems to imply that we are about to break UP in a iii wave and yet your comment to Pegasus says ‘FULL SELL’. Please can you clarify my misunderstanding. Thanks.
The Swing Trend Indicator is on full sell, which will generally lead to larger downside than we’ve had so far. The wave ii is just on the chart because I think that’s the wave we’re in, the placement means nothing as of yet.
Right now, the Swing Trend Indicator is acting like 7/7-7/24 where we saw a large dip, like this one, followed by a new high then a sell-off.
Thx very much for your explanation.
In short, I will only be a buyer if the Swing Trend Indicator goes back to FULL BUY.
May help to put a ? next to the last count that you are not sure of. Then you won’t get questions like mine hopefully.
A person can’t ignore what is happening with RUT with what could be a triangle completion this morning!
Yes geno I see what you mean with the RUT. The problem I have is that on the DOW or the S&P500 the correction didn’t even come to the 23.6% fib decline. So my guess is that we do see some further decline.
Also my experience of triangles is that they are RARE and this one although technically correct doesn’t have a good ‘look’ to it.
Let’s see what transpires but you are right that we need to be cautious.
The RUT put in a similar triangle TOP (larger) this year from March-September
In 2011 The SP-500 put in a similar larger triangle TOP from February to July
What do you mean? Is it a bearish Pattern.?
Blue Star – It has been bearish the last few times it has shown up on the daily charts, but I haven’t researched the odds/stats of the pattern. IMO it could break up or down, no edge by what’s happening.
All of the daily indicators on the indices are currently bearish and the Swing Trend Indicator it currently bearish, so I’m currently bearish.
Reason to BTFD:
http://finance.yahoo.com/news/u-employers-posting-lot-more-155933931.html
If today is all the downside is going to be and stocks rally up to new all time highs then I am going to conclude that the SC top did not come in earlier this year but will come in next year, 2015 (Fall).
I think he’s got it !
By George he’s got it !!
Purvez – Here’s the chart showing the similarities of the 7/7-7/24 period
http://unbiasedswingtrades.blogspot.com/2014/12/swing-trend-similar-to-77-72414.html
Thx geno
These are fractional moves to the downside atm.
Would not get too excited that this is
the start of something more significant at this point.
I totally agree Phil. I have not shifted my view whatsoever. If anything, I tend to think even more we will get a surge north and blast through 18,000 and beyond on the Dow. What amazes me is how quickly events are happening around the world now. Japan looks to be a basket case, Europe is now starting to tear from the inside and I still insist this will be the trigger to mayhem next year. Not Japan. Nor China. But for now, this will be controlled whilst the smart money heads more and more towards the US. We still have very, very low retail investor participation in North American stocks. I suggest no one will take any notice of the stock market until we see 19,000-20,000 or beyond. On the daily, we tested a 7 month trend line to the downside this afternoon….. former resistance come support – this was in the 17,680 area. I think this will hold and we will see 18,300 by the new year.
Please, “BFTD” means buy the ……… ?
it’s actually BTFD and translates to Buy the Freaking Dip in polite company.
megaphone line $/Y keeps holding around 119.6 – dividing line between a bullish and bearish market. When the facts change I change my mind. For now the facts point down. That may change (20bps away).
went short at 119.70 again, will give it the 50% retracement as stop (around 119.85, see how it goes but the last 24 hrs have not been boring.
poked above but line seems to be important
will be interesting to see what the mrs watanabes gonna do with this pair in a few hours.
Euro Yen looks like a wedge also I agree with back-test today. Target 136. With Euro steady to slightly up Y needs to rise by 12 big figures min. So targets 107/108 not out of reach.
based on the n.american equity indices, asia may push the $/Y higher but the hourly $/Y showing a possibility of reversing. do you know where one can get a live feed of the nikkei? thks.
http://www.investing.com/indices/japan-ni225
would think Nikkei has catch up to do towards current $/Y
http://www.investing.com/indices/japan-ni225-advanced-chart
did another wave count – have us complete wave 1 down today at 117.93 with wave 2 at 119.77. That would open the door to a break through 115 in wave 3 to 113.47 with a wave 4 to backtest 115 before wave 5 down into 111 or my favorite 108.7. Would make for a nice xmas. Don’t think bubbles care much about seasonals. Also not aware Japanese celebrate x-mss.
thanks for the link. i think the currency pair follows the nikkei futures when it is not trading in japan, so the currency pair will probably react to how it trades/open relative to the futures i believe.
mrs watanable did see the line!
btfd – buy the fu**ing dip 😀
The trials of my dyslexia! Thanx.
I agree fractional moves but also fictional. The US market has engrossley decoupled from everything else. Has anyone look at comparisons. It’s almost the last island left before the the tide floods.
IMHO 50/50 chance Santa is going to arrive this year.
” When Santa fails to call bears will come to Broad and Wall”
Blue Star – Link to the triangles I’m referring to
http://unbiasedswingtrades.blogspot.com/2014/12/triangle-tops.html
Thank you so much. All my indicators point bearish.
No problem. Wish there was a way to upload pics to the thread, would be much easier.
Big snap back on the RUT,
NAS positive.
SPX about even, DOW off fractionally.
That does not look bearish.
:). These kind of moves indicate a big move coming up or down. I am betting down. You are betting up. This should be resolved soon.
bear markets are climbing a wall of worry
There are no bears left. This has been a 69 month advance. How is this a bear market?
NYSE – Advance decline issues are at new highs and rolling over. Well above 50/200DMA which are pointing up.
Put call ratio is neutral.
Blue, I nearly bought some BP today.
They would be a longer term buy and hold.
Phil I hear you for the LT. I would wait for oil to settle personally.
RUT has been a good leading indicator of late,
direction may be clearer tomorrow.
I wathc Hy spreads. Bond guys always lead. Plus RUT is a hedgie roach motel via IWM. Hard to know what it means any more as a canary in the mine.
Markets should resume downtrend soon. ES future retraced almost 61.8% before reverting. I think tomorrow has a chance to be down big way.
Look at weekly of SPX and see that it has just peaked yet again following a dip of relative significance. The worst follow up is the megaphone. The probable is an average dip (that could be it) into yet another consolidation.
Although I would prefer the former resolution (to help to propel the bull into its Primary V wave conclusion with strength) the bull is a bull (on this index) and not an ABC bear market correction. That, at least, is not being debated. Thereby we must see 5 Primary waves, of which this is the 4th by consensus. Enough said. Let it be what it is. Which is what it will be.
I have a long term trend signal that flipped bearish today. It is also “heavily diverged” from price.
Accordingly, Tentatively Long Term Bearish.
Would not take much to switch it back, but until it does it is bearish.
Peace, Om,
SoulJester
Hi SoulJester
Wondered what had happened to your blog.
Are you bearish just on NYSE or does this apply to other major US indices?
Thanks
All major indicies. Using NYSE because of chart structure.
Thanks SJ. seems like a good call today.
Just looked over all my charts and indicators, and after all was said and done, and after a pretty impressive move in the RUT, I have to say….. “No change”…
Still very bearish, and the move in the RUT meant basically nothing from a chart perspective, to me..
Certainly a nice save today, price-wise, but my actual trading signals went even more negative today…
Without going into details, it goes back and forth between +160 and -160 at the extreme limits… It went from -125 to -145 today…
Not saying we can’t still go higher, but if you’re asking me, anybody who thinks there’s nothing but clear sailing ahead……is nuts….
Looks like BTFD works flawlessly again…. it used to take days or weeks to buy dips, now its an intraday activities. May I suggest just BTFD on SPX and use some profit to buy puts, then you can’t lose.
586 bps 48 h trading range $/Y – if that is not volatility don’t know what is.
50% retrace wave 2 and 1998 61.8% Fibo retest at 119.90. Lean towards starting wave 3 lower for $/Y here. 113.47 target. Nikkei catching up to where the FX is leading.
Nikkei could find channel support around 16000 – plenty of headroom down
looks like we just broke below 119.17 (below 119 also), do you think we are on our way with the 3rd leg? if this stays in this level or lower i wonder how the n.american markets will react to it.
looks impulsive so yes – 3rd wave could be under way
bull flag targest 118.25 min
should read bear flag
can’t see the bear flag, what time frame are you using (time interval)?
ok, i see what you mean.
Big day for those short.
I agree. Make or break.
Why, please?
I have a set up that needs to be confirmed. If we went to a new high my set up would evaporate.
It just adds to the excitement by saying stuff like that. Some people like the drama I guess.
J
Seriously folks, could they(and by “they” I mean Central Banks) have made it anymore obvious yesterday?
After yesterday’s disasters in Asia and then Europe and finally a flow through to the US they obviously decided that desperate action was needed to stem an unfolding global disaster.with nothing more than a vain attempt to restore confidence in global markets by pumping up US indices after the horrendous open.
Look at the FTSE chart below fr example and you can plainly see why they took the action they did.
The FTSE chart is beginning to look like the CAC, AllOrds, Hang Seng and many other global indices which for want of a better word is……. UGLY!….and I mean UGLY!
Anyone want to know why crude is declining?……Deflation, with a capital “D”
http://stockcharts.com/h-sc/ui?s=$FTSE&p=D&b=5&g=0&id=p17442466169
These are UGLY charts simply because in combination they show how the global markets are teetering on a major decline. If it were only one or two tthen maybe some doubt would be appropriate but it is the same picture emerging across the globe
http://stockcharts.com/h-sc/ui?s=$HSI&p=D&b=5&g=0&id=p27193795426
http://stockcharts.com/h-sc/ui?s=$AORD&p=D&b=5&g=0&id=p38015233729
Allan, it is what it is,
it’s adapt, die or stay out I suppose.
Crude selling off again,
however we may be close to an interim
trough here, sentiment levels are utterly dire.
So we had a huge bear market in 2014,
it just was not in stocks.
It will not take much to get the RUT above 1200
from here, within touching distance of a new ATH.
watching a declining triangle on $/Y base 118.70 and target 117.3. Should set the tone for equities.
Reading comments here is almost as much fun as watching the stock “market” go lower and gold higher
grexit taking forever
….and translated in English?
grexit is the exit of greece from the euro
Aaah my vocabulary increases by the hour here. Ta.
Anyone know where to get the daily sunspot data now. The NOAA site has changed and I can’t find it. Thanks
At an interesting point,
can bears take this down,
still very mild moves to the downside.
Don’t you expect too much? Bulls are always taking small steps 🙂
Wait for it.
I don’t expect much damage unless the biotech indexes close friday below last fridays close
If this reverses around yesterday’s lows then it will be LIKE the Oct15/16 action at a smaller scale.
Let’s hope it doesn’t.
Sorry I should have said I was referring to the DJIA and not the S&P which is the most common one that people refer to.
$/y pointing to low 117
The DJIA is nearly at yesterday’s low but the S&P is holding up. That doesn’t bode well for the bears here at the moment.
On the flip side the DJIA leading down doesn’t bode well for the rest of the market.
Phil, on your observation of the Russel i agree. Looks like a high base on the weekly. Looking to vault passed 1200. This could be a powerful move as it has been lagging and may out perform other indices if there is an xmas rally.
Not if negative divergence has the last say it won’t.
Allan, i saw the neg divergence. Hasnt meant a whole lot for years. Plus i suspect nasdaq 5000 for xmas / new year would make the headlines. Just my opinion.
The RUT is better equipped to handle a stronger dollar. Many of the smaller companies that make up the RUT don’t have international sales, so a stronger dollar won’t hurt their sales. Many large cap companies (DJIA/SP-500) have large international sales, and a stronger dollar definitely hurts those.
Has anyone heard from John? I hope he is OK and hasn’t had another health concern.
I have the same concern. I hope he is well.
same here. Lately he’s been putting up a new post every 2 or 3 days. This post came out on December 2, so it’s been more than a week now. John, we hope all is well with you and you’re just taking a well deserved breather.
So far the pullback is very similar to mid-Sept, where lows bounced off daily bollinger bands. As Sept, this is also the week before FOMC and triple witch opt exp. A spike into Friday next week on high volume could lead to a strong reversal as in Sept. If we do not make it over SPX 2085, this would be a triple top as outlined above. Over 2090 and rally should continue into Jan.
Note the mid-Oct lows showed panic selling via greater volume than Sept spike.
MaxCherry notes that next week is positive 80% of the time #seasonality.
Not buying in to the .. this is it view,
this looks to be setting up for the year end
rally on my take.
The dips are far too mild to point to
anything significant.
Somebody please kick me in the head. I’m contemplating picking up some UCO here.
You know what they say about catching falling knives!
My parents were in the circus. Probably best to wait for oil to hit 52
I suggest DBE instead. Your time-frame is the key.
Just a couple of weeks to pull a quick 15-20%
Depending on your pain tolerance it does look like a terminal ‘thrust’ out of a triangle and therefore an ending wave. Where it ends is a slightly different question though.
Usually oil peaks after the stock market peaks, but crb before. Will the market play catchup soon?
margin calls in the energy complex (15% of the broad market?) should work itself into broader market weakness. That would be common sense. A lot of pain among investment managers who were long energy and retirees having believed in risk free MLPs. $/Y paints a clear picture here having broken rising wedge with overthrow and now can fall to 108 as min target from this pattern. Everything else is noise. Plus add Abe could potentially lose on Sunday. That would bring us to 108 on Monday and black swan the rest. Not a juncture to dapple long in anything much here.
there is some lateral s-t support here in $/Y (117.8-118.4) which is why the market is not free falling. Once that area of support is worked through could see acceleration.
Ended up picking up UCO @ 13.44 and COP @ 63.24
Wish you well with those positions geno.
Are you just bottom fishing or has your trend indicator turned as well?
Bottom fishing – Swing Trend Indicator still on FULL SELL. I like the yield and PE on COP here and am willing to hold. UCO looking for 15-20% gain in a couple weeks, or days the way these things are moving lately!
I don’t have a handle on COP but certainly UCO seems viable. GLuck.
how secure is dividend pay-out for COP?
The payout ratio is 37% so the dividend is 37% of their earnings. They have $5B in cash and $20B in total debt. The dividend is solid.
Ref John’s article on Price Anomaly. What is the difference between a head and shoulders and a triple top? Height of each peak, but it is the same basic formation. Lindsay of 3peaks and a domed house fame, said pt 23 should be the top, but 22, 24 and even 27 could be the top. My point is that Oct could be the break of the 200 day ma and this spectacular rally is the rally back to the 200 day or neckline but the super optimism and highly liquid economy caused quiet an aberration rally to a new high. It looks like we should be finding out soon. The deflationary collapse in oil and commodities pt to that possibility.
triple tops are rare. they do happen, but they’re not common. which means that when you see one, it’s likely to disappear before long. What makes it disappear is new highs. Then it will be seen as just a consolidation before another move higher.
Double tops/bottoms are much more common, so much so that some traders have a rule to ALWAYS short a double top, always buy a double bottom, with stop in place of course.
A triple top is like the exact opposite of Gann’s Rule of 4. On the 4th attempt the market usually breaks the high or the low.
Pima and geno, you are correct. My pt was that despite the look of this top, we are in position of a death cross as the market falls away from the 200 day ma. Even though we are above the 200 day ma. Ie along the lines of what John said about price anomoly, an anomolous head and shoulder.
Pegasus,
On margin calls, WTI is off 4% and the SPX
about 0.7%, so price is not confirming atm.
Phil
XOP -5.28%
OSX -3.89%
ANJ -3.92%
This market is going to new all time highs soon. It would not surprise me if we close green today. Don’t forget to add to your QQQ, IBB and AAPL today. They are still very cheap and should continue their bull market. With the market down today, central banks will probably start buying before the close.
didn’t happen today, maybe tomorrow. How do you protect yourself from the possibility of a 10 percent correction? Or a 20 percent or 50 percent?
Pegasus
I hope the system he tested their emergency brakes, because is Abe does loose Sunday you will se a big drop very fast.
He is favourite to win but so was last years Grand national horse, he lost falling off the first few fences.
I admire your courage Nicolas
If this leaked report is true who cares if Abe wins or not.
http://www.zerohedge.com/news/2014-12-10/european-qe-postponed-indefinitely-leaked-eu-draft-shows-lack-political-cover-draghi
this is so much fun
there are some pretty witty remarks made here
and then there are some that aren’t designed to be funny
but make me smile nonetheless.
🙂
the real shame is that in ’99 and ’07 a lot of investors had bond investments that mitigated some of the damage.
by ’07 a lot of it was hi yield so it did a lot of damage still
but this time, nobody has exposure to long term treasuries or really high quality stuff.
all their bond exposure is hi yield, floating rate, convertible and junk posing as medium grade
it will act like equity when they least expect it
Just out of curiosity, Nicolas, is there a price level where you might say to yourself, “Oops, I guess the CB’s are ~not~ going to step in here…. My bad….”, or are you just going to let it all ride??
Barry I think you ‘knew’ the answer to ‘THAT’ question before you even asked it.
When the Swing Trend Indicator is on full sell, I don’t mess with long trades (except UCO and COP in this instance)
Well, I think I know the answer, but I’m hoping that at least Nicolas has thought about it himself….
Because one path leaves you injured, but at least with enough to start again, and hopefully with a better plan….
The other path…..well…..that leaves you quite screwed…….for a long time….
I’m sure most of us have been there, to some degree, at some point in our lives…. I certainly have…
So I just want Nicolas to think about what his plan is…
Because depending on CB’ers to bail out your investments is just no way to go through life…
Hi Barry ! Well, if you look at the CB of Japan they officailly buy ETFs and a good portion of their bond market to support their market. The FED also buys secretely stocks, after having bought trillions of $$ of mortgage bonds. So, I am certain that the CB will not let the market go down much. If we have a good correciton, the FED will get scared and they will buy everything.
Alrighty….. We have a plan… *big sigh*
in other words, no stops, no plan, other than keep buying on the way down. sheesh!
52.29 is the 2.618 extension for oil…….that obviously wouldn’t be good for UCO or COP
The US is craziness again. Most of my neighbors put 5% down on their houses this year. I just read a headline the other day that Fannie Mae and Freddie Mac are DROPPING the down payment from 5% to 3%. Welcome back to the mid-2000’s. Credit is now available to anyone, anywhere once again.
gotta blow that bubble up again.
Today’s action in the DJIA has been interesting because it is testing the upper line of the ‘megaphone’ that it broke out of. My own view i that it will hit the middle of the megaphone (red line) and then bounce to a higher high for the ‘santa rally’.
Let’s see what ‘really’ happens.
https://www.tradingview.com/x/d3eidAfj/
Just to be clear. This is NOT a straight down to the red line. I’m expecting some resistance right around here for the top of the megaphone.
IF that doesn’t happen then that is MEGA bearish.
Ok the slice through the megaphone top is NOT very good for the bulls. However the ‘good news’ is that it is reaching the 23.6% Fib retracement from the 15th Oct low so hopefully it will bounce there and test the underside of the megaphone.
If the underside holds then that is a VERY LOW RISK entry point to further downside.
Let’s take advantage of this slide. G’Luck to all.
Like I said to somebody recently….beware the day that debt deflation takes hold because Central Bankers won’t stand a chance in hell of printing anywhere near fast enough.
Yes, they will Allan. They’ll do what they do every time, and revalue gold.
Here was me thinking debt deflation had been around since 2000.
NOW! WCCG!
easy peasy
starting to see a break in biotech as well – that would really help downside momentum
another 90 min till close or a whole soccer match….
We should bounce from the 2027-2023 area back up to the 2060’s
For wave C, should start later today or tomorrow.
first bounce possibility I see around 115 $/Y – not much before
Buying some SPY Dec 20 206’s to hedge my shorts going into tomorrow.
http://unbiasedswingtrades.blogspot.com/2014/12/sp-500-watch-out-for-running-or.html
Nice chart geno. Hadn’t noticed the triangle in the middle of that ‘b’ wave. Would be good to have yet another bite from a higher level.
Doesn’t look like Christmas will be great for stocks but I guess a similar thing happened last year before a decent rally! Oil needs to bottom or things will get messy for the market.
Some half decent downside finally.
As I said Yesterday, gentleman It quite possibly has begun.
http://stockcharts.com/h-sc/ui?s=$NAHL:$NATOT&p=D&st=2014-07-14&en=today&id=t72100348278&a=377038763&r=1418236951809&cmd=print
NOW! WCCG!
easy peasy
Welcome back; nice chart.
WCCG?
BBE!! Assumed Banned By Elvis got Banned by John! Welcome back!
Missed your WCCG AND your charts… 🙂
don’t stay away so long next time
looking at past major peaks in $/Y (and assuming this was a major peak and we do not go on to new highs) the following swing lows are possible given historic analogs (swing lows to be followed by 4-5% bounces): 1990 (113.69), 1998 (108.51), 2002 (114.90), 2007 (111.58). All those 4 levels make sense based on Fibonaccis. So would expect volatility around ABE re-election uncertainty (before or after sunday) that one of those levels will get hit and launch a rebound. But we are not there yet.
well mrs watanabe, the ball is not in your side of the court…let’s see what you can do with it.
Typo – ‘now’ instead of ‘not’
start to get interesting
according to the wave structure so far could very well be in the beginning of wave 3 which will see us through 113.47 on Monday perhaps when Abe will have a weakened mandate from the populace? The price action in FX looks like he will lose considerable power. Not an expert on Japanese politics at all.
Looks like in wave 3 or even a leg c, no? Word is that Abe win big, as big as before? Will know by Sunday, big enough for another leg up?
there is some lateral support around 117.20 which could lend support.
FX markets smarter than political forecasters?
I may liten up around the low 117s and step back and see where we are fundamentally and technically.
Nikkei looks exactly like the US Biotech index – clear break from top here targeting October lows. That was 105 in $/Y.
Pegasus, I know you have been short the $/y for a while, do you get in and out of the position or been short all the way?
under water – so need to get the big moves right. Will try to play the bounce which will come. 115, 113.7, 111.5, 108.5 are all very possible points for that bounce (4-5%). The pattern of coming off the the top is a broadening one (megaphone) which is quite bearish. Political risk is large as well. Lower support of that broadening pattern is currently around 115.30 which fits the first big bounce point. My hunch is on 111.50 which is the 50% and 61.8% correction from 101 and 105 to 121.8. Also there is a gap from the Kuroda announcement on QE. Would be a natural point to revisit. Would also fit Nikkei finding support at 16000 for a bounce.
just a heads up, i am looking at the hourly chart and from yesterday to present there may be a potential wedge forming (a bullish one), of course if it continues to drop like the last 48 hrs then it is not a problem. will keep track of tose bounce levels. thks.
could be wave 4 of 3 complete at 118.30 – mrs watanabe wanted to sell short
Eur/Yen another 100bps lower and the we have a confirmed double top. Flood gates should open for Financials which are correlated to E/Y.
James L are you seeing an expanding wedge or a contracting one? I thought I saw an expanding 5 wave count down to the Dec 9 low and was therefore expecting Dec 10 high to go a bit higher.
The up wave towards the end of trading on Dec 9 and then Dec 10th’s down are therefore wave ‘a’ & ‘b’ of an expanded flat as geno has mentioned above. So yes in a way the ‘c’ will be the bullish part but I’m not expecting it to go above the ATH.
I was going to try and post a chart showing this but Trading View don’t provide hourly data on the ‘free’ version and I already have my own charting facilities provided via my FXCM and IG accounts. However that means I’m not in a position to post a chart here.
$/Y clearer wave count overnight. 2 of 3 complete at 118.86 with 3/3 underway now which should bring us into support around 115 (114.84). 4/3 to 115.8 and 5/3 to 113.32.
sorry for taking so long to get back to you, these markets wears me out sometimes. it was a contracting wedge and most prominent in the hourly and 4hr chart, pointing down…broke out of it around the 118.40 level, since back tested. its the equity indices will dictate where it goes from here now.
Uh whoops James L. You were talking $/Y and I was talking DJIA. Ones a fruit the other ones a mineral for comparison purposes. Lol.
one problem with that bulltard bounce from 10/15/14
there is virtually no support all the way down to 1820
maybe a wee bit around 2020
gaps are at 2000 and 1910
Watch out for the bounce tomorry.
I agree. I add on the bounce to shorts what say you?
For sure.
I bought COP at the close. Thanks. Joe Sixpack cried in 2008 when oil was at $150. He will cry again. Don’t know when but I can wait.
And while you wait, you’ll collect a nice 4.5% dividend yield.
Uh Oh!! Already TOO much bearishness…..and I’ve been a ‘bear’ since 2011. I’ve been hurting but surviving.
Every time I see too much bearishness now, I get worried about how far UP it will go.
Don’t worry. No one is positioned for a bear market. talk is cheap.
Betafish,
Did you go long today as you planned.
Bill
I am in cash. Friday’s apogee and moon moving towards south has me less than excited about longs. Seasonally second week of month is good from Thursday but I am trading long or short only when trade day price exceeds previous days high (long) or crosses below previous days low (short). I figure combining technicals with lunar and seasonals will reduce false signals.
I’m 92% cash at the close today,
so nicely positioned for a bear market!.
However it’s way too early to even begin
considering more significant falls.
This looks a 2-4% move atm,
which I expected 3/4 weeks ago.
Around SPX 1975-85, then it begins to
get more interesting.
I would be very careful adding shorts unless
you are convinced of short term downside.
See what tomorrow brings.
Betafish,
Nicely called on Monday-Wednesday
price action which you flagged in advance.
Phil, you are not expecting any bear market until Q3 2105, why “92%” cash?
Everyone is changing their minds like their underpants. Nothing wrong with that, but amusing when you consider the certainty with which statements are made:)
Good luck all.
J
Jegersmart, I have to agree. Not a slam at anyone in particular, it’s just everyone seems to speak with such certainty, when the reality is we’re all making educated (hopefully) guesses. This is why I so appreciate John’s approach – he’s just stubborn enough not to change his mind on what he views as transitory market action (rightly or wrongly) but also makes a sincere effort to understand and illuminate the opposing case to his argument.
I reckon all US market losses will be recovered by end of next week. The FTSE will most likely not but getting to 6600 would be reasonable. I think January will be the bad month which may mark a short term top with the absolute top coming mid 2015. o
I haven’t changed my view. And I wasn’t guessing.
jegersmart,
I will only hold/ buy where risk/reward
looks favourable.
A second half ’15 top is my best estimate as mentioned.
On previous cycles I have been out well before
the peak, however this results in capital preservation.
I mentioned a number of times recently that
bonds, crude and other commodities are signalling
the end game to this bull market, the US earnings cycle
needs to turn, then it’s game over.
Gary,
There are no certainties in precise market timing,
there are only probabilities.
There has never been a magic formula nor will there
ever be, we are all guessing/estimating.
The only difference is that some of us are aware of this.
In terms of my own positioning I have mentioned
being in cash repeatedly, made that very clear.
Long term no one knows. Short term no one knows. Price is all there is. Thing is price tends to move in similar patterns, up days lead to more up days-greed, down days lead to more down days-fear. Patterns also are formed by electroastro forces. Go to the local coffee shop on a full moon, parking lot empty; go on new moon parking lot full. All I want is to learn how to read price to capitalize on fear and greed on daily, weekly time frames and to understand electroastro forces to understand what effects those have.
Things that work on multiple time frames:
1. Full moon leads to price weakness setting up buying opportunity
2. New moon leads to price strength setting up selling.
3. Low tide usually marks high price of the day
4. High tide is usually followed by 2 hours of price falling.
5. When moon crosses equator N to S, and S to N there is a price
spike usually way up. When moon approached far S position each month there
tends to be a sell off almost each month.
6. Each month price follows following pattern:
A. Week one up
B. Week two first three days down, then up
C. Week three up
D. Week four down, all five days
E. Week five up
These are all verifiable by printing charts and simply looking at the data.
Item 6. is the most useful cause it tends to happen every month and is related to
calendar based buying by large investors and the desire to have market up during month transitions. Moreover, large sells off are mostly on Mondays, to give five news cycles to parse out the factors that went into the sell off; and during August Sept Oct so there are a few months before end of year to similarly digest the market gyration before the end of year holidays.
Thanks; seems to work! Great additional confirmation.
Cheers,
André
Thank you, Andre’. It is nice to have your ideas.
Thanks Betafish. I’m printing this up LARGE and sticking it on my wall. I was going to do that with your earlier smaller list but this one is much more comprehensive.
I also like your idea of only taking positions in the direction that the astro for the period says, provided price is moving in the same direction. I think that combo in the long term could provide a big advantage.
Thanks for sharing all this.
Your are welcome. That is why I like this web blog so much because astro trading is found interesting.
Thank you for thr holiday gift post; I will save it. HAPPY hOLIDAYS.
Great man you are to educate us .. Thank you
TRIN at 3.47 the one single indicator that says shorts should take profits today. But medium-term trend has clearly changed with SPX breaking back below megaphone. Going to expect a bounce to 2040-2045 in SPX before reloading on shorts.
https://davinny.wordpress.com/2014/12/11/12102014-time-for-profit-taking/
2 megaphones active now in ES. Lower support for one at 1760 and the other (from beginning of the year which also capped recent rally) at 1540. Both levels are important Fibonacci levels as well.
yep and today it rejected the megaphone on this bounce. and sold off orderly on a unelevated TRIN and put call. bear market material.
Paging John Hampson–your next post is needed on the floor… excessive cash and bullish bias needs medical assistance…
Phil
I can’t be bothered to go back and check, but your statement above does not seem to match what my impression of your posting over the last month or two has been. Perhaps I mistake you for someone else in which case apologies.
Not putting money where one’s mouth is potentially damaging to this board, it means that idle speculation by people who have nothing to lose can influence those who have. There doesn’t need to be specifics, but I suggest that if you or anyone else has a “certain-sounding view” that you also declare whether you are positioned accordingly or whether you are just blowing your own internet horn. That even includes this “Nicolas” who is trolling these boards, even though I doubt that there will be anything useful there.
In any case, I hope that John is OK.
J
Agree wholeheartedly J – without accountability much of the board commentary just becomes mush, and with John’s readership rising, more difficult and less interesting to navigate.
I hope John is ok.
Betafish, yes never any guarantees.
My best estimate is that this is late cycle price action,
the longevity of this bull run alone indicates this.
Ratios such as CAPE underscore this view.
jegersmart,
My posts make it crystal clear what
my position is.
Just skip them if you are unable to follow,
simple.
Ah, the true character comes out. “Unable”, indeed.
Always worth discovering.
imho
J
BLT hitting fresh new lows this am.
Alan has made the point on Aus being
a leading indicator for a Chinese slowdown
and mining stocks appear to be underscoring this atm.
My working assumption is that all necessary has been said already and our host is letting the markets have their turn.
http://stockcharts.com/h-sc/ui?s=$NYAD:$NYTOT&p=120&b=5&g=1&id=p91335515800&a=372282610&r=1418295592048&cmd=print
Ten year Notes making a double top point to a near term bottom in Crude and a BTFD for stocks.
Should Crude find support at $60 and T-notes make a double top then stocks will most likely rally. Today could be another BTFD for US stocks.
It is not necessary for Crude to rally but only for Crude to stop falling for stocks to be BTFD. Ten year treasuries make a daily double top point to that being what is going to happen.
Well of course it’s BTFD. Retail sales miraculously beat again in November even though wages are all but stagnant and retailers have been closing stores and laying off staff. It’s another Xmas miracle!
Don’t see it. Both t bonds and yen look constructive to me.
Stocks topping with a Full Moon is not normal. Stocks top with New Moons and bottom with Full Moons. The Full Moon acceleration of Crude lower may have run its course as Crude finds support at $60 with Ten year Notes making a daily double top. This points to what is usually in that stocks top with New Moons which means that stocks are going to bottom with a BTFD and rally back up to new ATH with the New Moon late next week.
I was looking for stocks to bottom with January’s Full Moon but that was conditional with Crude breaking down much more and causing a Black Swan event in America’s energy sector but not the entire economy like in 2007/2009.
Solar activity has been low for several days (stocks sell off) but one sun spot is expected to become active today (stocks rally).
Crude is in a firm support zone between 55-65 which I expect to hold. Would see crude to sell off more to increase the pain trade for leveraged energy players in the short term perhaps testing 55. This will cause markets to accelerate lower.
Richard, I do value your fundamental insights very much.
On energy high commodity prices have induced a lot of mal investment. Similar to the housing market. When prices break lower ( house prices) in 2007 the proverbial tide goes out and you see who is swimming naked. Both sectors are about 10-15pct of the economy so comparisons are valid. Market is currently in fact finding mode who has been swimming naked in the energy complex. This can easily morph into something bigger. On top high aggregate leverage in the economy ( margin debt, corporate debt, sovereign debt) increases the risk of black swans.
Richard you might be right about treasuries
but that appears to be another universal consensus
i’ll take the opposite side and continue to look for 1% on the 10yr
How about 0.85pct or a falling trend line
And HY is down (slightly) today??
Richard, I could not disagree more with your BTFD call right here…….
OK, so as I said yesterday new highs on the way. It looks like we will recoup all losses today and tomorrow. It’s so easy, it shouldn’t be legal.
It should be typical bear market day today. Ridiculous short covering and dumb money buying at the open and then slow steady drift down.. Obviously, breaking SPX 2060 would mean there is more life in this bull but I think it has low probability for now.
See the same Brunell
despite today’s rally
that friday/monday action in the dollar looks like a top that will last a long time
good buying by central banks today. I told you that they would not let the market fall that much.
The recent low activity of the sun may be responsible for the rare inverted top in stocks at a Full Moon. Given that stocks tend to top at New Moons and that solar activity may be picking up again points to a rally in stocks to the next New Moon which is due the following weekend. Especially if Crude stops declining so that a Black Swan event of the energy sector is abated.
Crude dropping is not a black swan event. It is perhaps somewhat unexpected but that is not anywhere close to the definition you are using with such certainty. The cycles/system you follow do not work all the time, just like any other system. To excuse the failure of your indicators on an event you call a black swan is disingenuous especially when you don’t even use the correct definition of the term. I don’t mean to sound harsh but you need to accept that making excuses does not improve your system/process or your trading.
I am sorry if my comments prove offensive to you, but people really need to be careful what they write.
A black swan event is a scenario or event that has not been seen before so that we are not aware of its possible existence. Now I do accept that we do need some flexibility with the definition otherwise it is not possible to debate it, but I would say that a black swan event now would be if there was a massive earthquake that resulted in 80% of California sliding into the ocean, a terrorist organisation detonating a tactical nuke in London or perhaps the news that Greece has already confirmed that they will leave the EU, and when the news hits the public the stock index goes to 10 or similar…..
imho
J
What are you looking at swan?
Prices falling far enough in Crude would result in a crack up of the debts of energy companies and that is what I am referring to as a Black Swan event to the American energy sector. The stock crash of 2007/2009 is thought to have been caused by a crack up of the repo (debt) market and is referred to as a Black Swan event. By looking for a crack up in the debt market of the American energy sector, only, and not the entire US economy, takes away one important factor that could cause another significant crash in US stocks at this time. The 2007/2009 stock sell off was caused by both a housing market crash and a crack up in the debt markets. Without illiquidity in the entire US debt market a crash at this time is not likely. Illiquidity in the US debt market for the energy sector does not mean it would spread to the entire debt market; thus, no threat of a broad stock market crash but only a crash in energy stocks. Understanding these fundamentals means that a crash or significant decline in stocks as is expected by John is not very likely at this time. Instead of a crash is the potential for the resumption of the bull market trend: BTFD.
Please see the definition of a “Black Swan” above, these are not such events. The media idiots refer now to anything that is unexpected as Black Swan events, I am just trying to help you not fall into that category. I am actually amused that communicating with you is a very difficult thing. It is almost as if me taking part in the conversation is irrelevant. Do you always just pretend that no one said anything regarding your narrative? Is that how a debate develops?
I do agree though that there is not much of a sign that any major declines are imminent currently.
imho
J
As was in August 2008
Tick not buying it – looking more STFR than BTFD to these jaded eyes
http://stockcharts.com/h-sc/ui?s=$TICK:$NYTOT&p=120&yr=0&mn=4&dy=0&id=t65781781470&a=371828752&r=1418316334814&cmd=print
Hi folks,
I trust John is observing events unfold, and hope he is well, while we all try to make sense of developments.
I shorted the FTSE a few days ago on a clear MACD sell signal, it’s trading very well despite the wild girations of the US and some European Equity markets today. Incidentally the US indices have given MACD ‘sells’ but due to their volatility and constant whipsawing I will steer clear of US positions (for now).
There is no shortage of opinion here, and I wont fuel the speculation, it is all interesting, intelligent & convincing though. I am no genius but I still favour John’s analysis. I would like to know is anyone else short FTSE like me…your views would be welcome.
thanks
Al
Al, whilst I don’t trade the FTSE I do monitor it most days. Today it has been diverging even faster from the US equities than the recent past.
Although this is partly explained by the larger Energy weighting it has in its constituents I often think that the FTSE acts as a ‘leading indicator’ of where the rest of the world Stock Markets will be going during the weeks/months ahead.
Don’t know whether any of this rambling helps.
Nice gains on my SPY calls today. The fib support zone yesterday worked perfectly.
I’ll probably add to my shorts tomorrow near 2062
Betafish, very good short term call.
Humbly accept your compliment, hope this streak continues.
RE FTSE, went long earlier at 6455 saw a 25 point profit or so but got stopped at BE. FTSE looks a bit overdone to me to the downside, but will see tomorrow I think.
J
Jegersmart, I think your response highlights what you said a day or so back about what each person’s timescale is. Clearly you were looking for a day trade given the somewhat oversold conditions.
However I suspect Al was talking about a swing trade of at least a few days and probably longer.
It just highlights how answers need to be placed in the context of timescales for them to be understood correctly.
Just thought I’d highlight this as an excellent example of how things can get misinterpreted due to differing timescales unless they are expressly included in the discussion.
My lone contribution to TA is publicly showing the 886algo for the last 8 years.
Here at John’s site I have described it twice in detail.Once again, it set up at yesterday’s low…. you do not have to trade it;but, it is worth knowing when it is in place
chart
http://stockcharts.com/h-sc/ui?s=SPY&p=5&yr=0&mn=0&dy=3&id=p20657950185&a=326440910&r=1418320794794&cmd=print
Could you explain it for those of us who were not previously on the blog?
A gap open on a 5-min chart (watch the ETFs…)
f/b
An 88.6% retrace that intersects the parallel of a reversal-oriented median line set
boom
Echo of geno’s request please. Thx.
Lone contribution? You are not counting this one then?
http://stockcharts.com/h-sc/ui?s=UUP&p=D&yr=1&mn=11&dy=2&id=p80332496719&a=370190465&r=1417742620174&cmd=print
nice reversal on treasuries
junk says stocks will reverse too
maybe not today
anybody looking for a black swan pay attention
bullishness on the dollar is near universal
in 2010 the IMF passed reforms that would reduce dollar holdings
it gave the u.s. until 12/31/14 to pass legislation
congress is leaving and said they won’t even vote on it
thus IMF will eliminate u.s. veto power and drastically cut dollar holdings
big gain for the brics especially the yuan
and nobody on wall street is paying attention
I reviewed the past four “megaphone” patterns in SPX that occurred dating back approx one year starting Nov 2013. The present one that started around Nov 20-21, 2014 would be the fifth iteration. The action in each one are very similar but not exactly the same. In some cases it does not always touch the lower part of the megaphone on the second or third thrust down and vice versa.
There is both good and bad news depending on how you look at it.
In all four examples after the second touch downwards of the lower bottom of megaphone, there was always an upper rally/thrust that extends to the upper part making new ATH and it typically occurs within one week. In 3 out of 4 cases a bearish reversal occurred after doing this which resulted in a third downwards thrust to the bottom of the megaphone over two weeks duration that implies a price lower than the second thrust down.
In the one different case it took two weeks to complete the third thrust (still establishing new ATH), but it bounced off the megaphone top and consolidated sideways for three weeks before declining hard during the fourth week. In other words twice as long to go up and twice as long to go back down but the third thrust down did not make a lower low.
So if all goes according to the pattern then tomorrow Fri should be a big up day and it can potentially top by Tue/Wed Dec16/17 (or maybe end of week too). The second thrust down in 3 of 4 prior patterns occurred in 11-14TDs after the surge into the start of the megaphone and in this present pattern yesterday’s decline marked the second thrust down into the megaphone bottom (13TDs after initiating the pattern).
Now the market is somewhat unpredictable in the path that it takes to get from point A to B, so something weird could also happen such as tomorrow it instead declines low early on to even lower levels (and still touching megaphone bottom) before reversing and then surging to new ATH next week. If so then tomorrow would mark it as 15TDs for the second thrust down to complete.
Steve T as usual your detailed analysis is very clear and is very welcome.
Along with Betafish’s call for the latter half of this week to be ‘UP’….we can’t possibly lose!! 🙂
Thx again for posting this detailed explanation. I particularly like your ability to provide an alternative which would still fall within the megaphone pattern.
geno have you seen the hourly chart of the S&P? There is the very real possibility that we have an Inverted H&S which would suggest higher highs tomorrow. Possibly even ATH’s.
My attention to this was drawn by Steve T’s and Betafish’s analysis further up.
Although I’m willing to accept that no system is fool proof 100% of the time can someone please find a way of knowing WHEN they ARE!! lol.
Looking at what’s happening right now (Dec 11 19:50 GMT) it would appear that geno’s call for a ‘running flat’ is the one that’s going to win.
Hope you took profits geno. I knew you wanted to short at 2060ish but I do hope you took profits today.
Purvez – I took profit on all my call options today, but I did NOT add to my shorts. That is a nasty looking IHS that I noticed along with you. The Swing Trend Indicator doesn’t care about new highs or not, as long as it stays on sell I will remain short. Usually I’ll add short on new highs while the STI is on sell because it gives me a nice entry for more shorts, and if it doesn’t pan out I have to switch to long, so that’s cool with me. I posted before that MaxCherry posted the seasonal analysis of next week which is up 80% of the time, so something to watch out for.
Hopemy posts help peeps make money, that’s all this is about!
good piece by Erik Schwarts addressing a lot of points raised on this board. The footprint by commodities and the $ so far in 2014 is approx. 1/2 the 2008 foot-print. This would leave stocks to perform a 25% drop (50% in 2008) as completion to the picture. FX, Tbonds, precious metals, oil all to align but stocks have still to do the trick.
Shorter term Yen just starting next impulse lower into a likely Abe election low around 115.5. So upside looks to be capped out.
http://www.safehaven.com/article/36059/following-a-deflated-2008-redux-in-commodities
looking closer at 2008 the yen bottomed first in Aug 2008 just before stocks went into a tail spin. The Euro bottomed in October and the $ topped out in November. What this means is that the next 2-3 months could be utterly confusing to the casual observer as both $ and Y rally together and commodities and stocks falling together with the former finding support once the $ peaks.
The yen path following Aug 2008 translated to today would 98 next stop followed by 105.8 and 90.50. Certainly very few expect that.
ES megaphone retest today – nothing more
Biotech broken wedge re-test – remains broken so bearish
crude oil is forcing the players who play bluff to show their cards
Hi all! Had no internet for a few days – will get a new post up tomorrow.
great news!!
Great to here you’re OK John. Many of us were beginning to worry.
Lol my spelling and grammar aren’t great but, here instead of hear………that’s a shocker.
Good news, your posts are the best!
How do you do it? Short positions and no internet? I don’t think I could.
Glad that you are well!
The market is getting a bit too heavy to lift off.
Glad you’re back. Happy Holidays.
great to see you back and about time for a new post. i usually read from a blackberry, can you imagine how much scrolling to get to the bottom, lol!
great to hear from you and glad you’re okay! I suspect the internet went out because you needed a break. Hope it was a good one.
Welcome back John! Great to hear that you are safe and well!
come on now
you cant BTFATH and the dip at the same time!
WCCG time it is and the flourishing of inferior men is over
Unbelievable. It took a research firm and this long to realise what myself and many here have been banging on the table about for months.
Namely that Fed bubble blowing would lead to junk bond implosions amongst other problems that will ultimately end in collapse as the debt bubble implodes.
http://finance.yahoo.com/news/fed-helped-cause-550-billion-143354747.html
2033.50 is the erogenous zone for the bulls and bears!
wccg!
“good buying by central banks today. I told you that they would not let the market fall that much.”
Oops, who held their nerve and increased shorts?
I did. the resistance line was very clear.
The very fact that there are so much talk about BTFD adds to my convinction 🙂
If you are bull today was a very scary day. A reversal like that could be ominous. I did not add to my shorts because I thought we were going higher. I feel dumb.
Wow, what a day and major after hrs moves.
Looking at ES and NQ futures sliding even further after close I consider quite high possibility of significant market “dislocation” tomorrow
Pegasus, what is your latest e-wave count on the $/Y so far? just got a bearish signal, i.e. broke the trend line from the most resent up move. thks.
Just saw your comments above, just skip my question above. Thks.
have it in 3rd of 3rd wave lower – wave 2 high at 119.5 did not exceed wave 2 high at higher degree which fits the rule book. Wave 3 of 3 should bring us to 113.5-114 . Believe Abe can move the FX to this target come Monday. Bought front row seats. Probably the most important political event of the year this Sunday. Not sure if a loss in purchasing power of 20% is welcomed by a majority of Japanese. We will find out.
i see your waves, looking at a potential bear flag (1 hr chart), need it to be below 118.85 to confirm but both the bulls and bears are quite stubborn so far.
see it.
Cannot believe the Nikkei shed 1000 points in 3 days. Must be one of the fastest rates of declines. Watching Nikkei for completion of wave 2 (currently 48% so looks almost complete). Wave 3 down to 16000 to come. That would give $/Y room to fall to 113 or thereabouts.
also upside action in $/Y looks corrective. Waiting for the next implies lower. Should come on break of 118.85 and when Nikkei keels over.
S&P 500 has retraced almost 60% already while Nikkei at 48%. Probably won’t do much more than that as S&P weak.
good piece on the Nikkei
http://elliottwave5pointzeroreboot.blogspot.com
James, looked at very l-t chart and saw recent price action jolted Y back above trend line coming from 1980 (another hit at the 1998 low). So bear case on Y is lost in my view regardless of Sunday’s outcome.
http://fxtop.com/en/historical-exchange-rates-comparison-graph-zoom.php?C1a=JPY&C1b=USD&C2a=CHF&C2b=USD&C3a=&C3b=&C4a=&C4b=&C5a=&C5b=&C6a=&C6b=&C7a=&C7b=&C8a=&C8b=&C9a=&C9b=&C10a=&C10b=&DD1=01&MM1=01&YYYY1=1980&DD2=11&MM2=12&YYYY2=2014&LARGE=1&M=1&LANG=en
i see the chart, the short term side ways pattern just broke downn also…still a lot of room to go either way, looks like by Sunday night when trading starts will clear out a few things.
who needs a stinking internet connection when you can plug directly into the noosphere via WCCG!
Hunter S. Thompson has entered the room!
http://thefelderreport.com/2014/12/11/everything-but-the-us-stock-market-has-peaked/
Gary – glad you posted, i was going to, Felder has been right on
nice sharp re-rejection in megaphone in SPX. VIX wants that gap fill in 23-24% area:
https://davinny.wordpress.com/2014/12/12/20141211-bear-market-material/
Global indices beginning to fall into line in terms of the bearishness that was terminated a few weeks ago when CB’s stepped up.
There is a definite feel about this developing move that signals much lower levels coming.
Long SPX 2018. No one messes with Santa. Ho Ho Ho we are near the low 🙂
Bulls need to defend 2014 or the September high. Biotech looking top heavy. Maybe the market has a crack at support today.
Allan,
One of the biggest worries apart from
Failure of ECB to get majority support for QE
Japan loosing elections this weekend
Asia economy
Embola
Russia
World debt
Bankers committing hari-kari etc…
Is now the real possibility Greece will exit the Euro zone next week after elections.
Not a great Christmas as most of the above will effect us all.
17 dec is the day for greek parliament vote.
watch out for the chinese selling more and more oil which they use as credit collateral to meet margin calls after 50% price drop. This will not bode well for their credit system. OPEC today reports precipitous drop in demand for oil, i cant help but wander if this is related to the China situation. If so, batten down the hatches as Chinese implosion will bring us all down hard.
Deflation……..pure and simple. Copper looks ready to plunge as well. All that QE has done nothing but encourage risk taking to extremes when everyone should have been doing the opposite following the GFC.
Certainly thete would have been a more prolonged global slow down but where are we now?
Excesses are at alltime extremes along with debt and the bang we got for the buck ie. organic growth has been more subdued than any post recession recovery in history.
All we did post GFC was paper over the cracks and make underlying problems worse.
Now this is fascinating. i would dearly love to know the answer but the question is not why they implemented new rules but WHY they even felt the NEED to implement rule changes?
http://www.zerohedge.com/news/2014-12-11/what-do-they-know-cme-implements-gold-precious-metals-circuit-breakers-400-wide
I’m fascinated by this rule change as well, Allan. Here’s another article that discusses the new rules and possible reasons for their implementation:
http://www.tfmetalsreport.com/print/6443
Allan – this is going to be fun – for those of us prepared
Quite odd. I liken it to introducing a new rule into football to curb an behaviour that has ocurred on one previous ocassion.
The only reason you would even consider introducing a new rule would be if you thought said/previous behaviour was likely to become more prevalent.
What are they expecting?
limit up days on end?
I think they’re expecting to no longer be able to keep precious metals prices suppressed, so they’re doing their best to make sure they rise in a controlled fashion and not all at once.
This Zerohedge piece from November 25th may well have been describing a test of the new circuit breaker level:
http://www.zerohedge.com/news/2014-11-25/something-appears-be-going-gold
From the 18 minute mark on for Ray’s views on the market:
http://www.marketwatch.com/story/ray-dalios-no-brainer-stock-may-dip-when-monetary-impact-weakens-2014-12-11?dist=beforebell
ST trading:
http://quantifiableedges.com/after-vix-rises-strongly-on-a-day-spy-also-rises/
James, just noted a pennant on the 5h on $/Y. Usually a mid way pattern. Break is 118.10 and target 113.7. Strengthens down-side here in risk for the next couple of days in my view.
http://thepatternsite.com/pennants.html
interesting, looks like a bunch of confirmations and non-confirmations are all gonna show up in the next 24 trading hours, i wonder why 🙂
If I were a bull why would I want to be long Abe and Samarans. Clarity by Wed afternoon. Will set the tone for the next couple of weeks. Y can explode on both.
perfect hit on the upper side of the pennant. Now comes a test of the underside. If it breaks might see an afternoon sell off.
would expect ES and $/Y to break critical levels at the same time if they break
Gdow looks quite ugly, may be post second chance. If it wasn’t for the election the $/y would be down much bigger, but the day is not over yet.
on the topic of pennants – not a technical analyst by training – looked at the pennant on the monthly chart which formed between May 2013 and Oct 2013. The move into the pennant was from 77.6 to 103 or 25.4. The break out of the pennant was at 98. Assuming the pennant is the mid-way point of this up wove then 123.4 would the terminal point. We did 121.82. Maybe good enough maybe not. Will find out.
Jon,
Congratulations on a fine blog. The originality of your perspective has only been exceeded by your stalwart stance in defense of your theory. My intuitive sense was that you were truly on to something remarkable. Although the timing of the precise top has been elusive I do not think we can dismiss SolarCycles as having failed and in fact with recent panics in energy I’d say that your work has gained merit. Meanwhile, the story is not finished being told. Best of luck finishing out the year and good health to you in the year ahead…
All the best,
HVA
Off topic…
London air space has just closed
http://www.bbc.co.uk/news/uk-30454240
Here are some of my current musings on the VIX. http://ibankcoin.com/bluestar/2014/12/12/speed-kills-the-vix-is-warning-that-someone-big-is-offsides/
Some are just now realizing how much has been invested in the shale revolution, which may not pan out as expected. Here’s your problem: http://www.zerohedge.com/news/2014-12-12/we-have-just-escaped-earths-gravity-and-are-now-space-orbit
bluestar – i knew that i had seen that handle before just forgot where
anybody here ever at capital stool back in the day?
I am not sure what capital stool is so no.
http://stockcharts.com/h-sc/ui?s=$INDU&p=D&yr=1&mn=0&dy=0&id=p20252936397&a=380154473&r=1418403168107&cmd=print
downtrend confirmed – crash confirm awaitin’
XRT and RTH are goofy! rallying today of all days on support
http://stockcharts.com/h-sc/ui?s=XRT&p=D&yr=0&mn=5&dy=0&id=t88548301482&a=370502282&r=1418405289150&cmd=print
http://stockcharts.com/h-sc/ui?s=$NAHL:$NATOT&p=D&st=2014-07-14&en=2014-12-12&id=p76745940098&a=377038763&r=1418405756526&cmd=print
5 outta 6
Christmas CRASH!
if retail will fade anyway…it will if I stop buying
WCCG!
http://stockcharts.com/h-sc/ui?s=$TYX&p=W&st=2010-02-25&en=today&id=p58064360342&a=367751244&r=1418406680727&cmd=print
Folks, well done to those who have capitalised on
this down move, holding short positions in the face
of recent market price action take both guts and courage.
How you guys can mentally deal with being short in
the face of markets that just refused to budge day after
day is beyond me, no way do I possess that level
of mental resilience.
Short term dip or something more significant? I suppose
we find out next week.
The cynic in me says it’s the big boys knocking out both
weak and margined longs to load up before year end,
soon see if this is the case.
Phil, those who would short this bounce were already short before october and lost their shirts unless they booked gains on oct 15th.
The majority who were short are bleeding badly and this dip so far only partially compensated the big losses from earlier.
oh poo and silly poo – hedged with TLT and rydex 1.2 gov so making money while waiting for the shorts to kick in. That’s why my missing the buy signal on Oct 27th wasnt a big deal as people like you tried to make out.
There are sane and effective ways to short.
I added shorts on Wednesday because of all the sell signals that lined up…
poo and silly poo I SAY! more WCCG!!!!!!!!!!!!!!!!!!!!!!!!!!!!!!!!!!!!
so basically you are happy that you did not make any money. great! i mean it.
now you know what to do, right? cut your looser short and let your winners run! or are you going to do the opposite? heh.
No me, I only short when the signal is clearly a reversal. I’ve been sticking with my posiiton, no change. I bought the October dip, go out at 2030 (all futures prices), made a premature short and got stopped out. I pointed out several times the voliat
Phil W, one way to ‘face’ the challenge is to wait…and then Wait….and then WAIT till the rubber band cannot go any further (all indicators are off the charts/cant go much higher). THEN you hold your nose and dive in.
Yeah it’s difficult but after a while you realise the market (and therefore you) WILL come up for air.
What I find REALLY difficult is what John did which is start early in the cycle and then held on. Kudos to our host.
Oh ….. and when you do come up for air don’t hang about. i.e. don’t swing for the fence but grab a handful and RUN!! Lol.
hormonal market
Hi Phil;
I’ll take it!! Anyway, To answer your question, there’s nothing indicator-wise that I use in my swing trading system, that would make me want to take any shorts off here…
That said, all morning I’ve been feeling in my gut that we should get some kind of a bounce soon…. And we’re seeing some sort of a bounce right here, but I didn’t take it…..
But that said, the very short term things I watch during the day are not indicating any type of a bottom here, so I’m still holding (too many, actually) shorts…
Maybe ask that question again Monday and I might have a different “quick-bounce from here” answer….
Because yes, there’s certainly been some stop-running going on, on both sides, these past few weeks…. And weak longs need to be knocked out too, sometimes… God knows the shorts have been beaten up enough…
I have a feeling your last sentence has some legs to it……but as of this moment, I’ve got nothing solid that would support it…
GL…
also for the doubters – this is what the start of a bear looks like:
http://stockcharts.com/h-sc/ui?s=$NYA&p=W&yr=2&mn=0&dy=0&id=p98743992394&a=370927705&r=1418412658579&cmd=print
http://stockcharts.com/h-sc/ui?s=$NYA&p=D&yr=1&mn=0&dy=0&id=p31146551191&a=371629276&r=1418412620945&cmd=print
so even if there is intervention of some sort it looks like we at least hit where the 40 month ma will intersect the monthly trendline – that’s a fur piece down…
http://stockcharts.com/h-sc/ui?s=$SPX&p=M&yr=20&mn=0&dy=0&id=t57325791834&a=380291379&r=1418413494335&cmd=print
With the DJIA at 17390, hands up how many people believe it will hit 17750 BEFORE it gets to to 17000?
I’ve got BOTH my hands up here. This downward stretch from ATH in the DJIA looks like a 5 wave expanding diagonal.
Fair warning / FULL DISCLOSURE. The last time I called the downstretch, an expanding diagonal, from ATH in the DJIA to the low was when it bottomed on Oct’15 2014. Look what happened to THAT call!!
Also full disclosure, and I’ll probably regret saying this, but I’m not expecting THIS one to shoot ABOVE the ATH BEFORE it gets to 17000.
Thx for reading my late night diatribe.
this will have to change quickly if you are to be right…
http://stockcharts.com/h-sc/ui?s=!NEWLONYC&p=W&st=2012-12-06&en=today&id=p84886088623&a=380295352&r=1418414517380&cmd=print
http://stockcharts.com/h-sc/ui?s=!NEWLONYC&p=D&st=2012-12-06&en=today&id=t40403434637&r=1418414649757&cmd=print
BBE, difficult to argue against THAT weight of evidence. However I’ve come to the conclusion when the market is at extremes it can LIFT some very heavy weights.
GLuck to all here, whatever their trade.
I dont see extremes yet except in positive sentiment and employment fictions
Just to clarify. Jegersmart suggested we should clarify our own positions in the market.
I have a ‘half position’ long at the 17390 DJIA level as of this writing.
also if VIX pops above 21.37 panic will rush in where dippers have been trippin
Yes BBE I hear you, but each to his own. That’s the bit I have always like about you. You point out the flaws but then don’t insist we take heed.
thats because of how often I trip
🙂 LURRRVE your answer.
this should drive the VIX higher
Sorry can’t see what it is because I can’t blow it up to ‘life size’. Lol.
Any way the market has just broken LOWER here (20:36 GMT) so I guess you are on the winning side….for the moment.
Quick update before the clse…
Trading system still 100% short..
I just took off a few shorts for my own personal trading…
Now down to 134% net short….
we are going into the high 1700’s before a significant bounce I think – will work on the numbers over the weekend if I can stop inhaling!
I look forward to your analysis, bbe, especially since high 1700’s before the next major bounce is what my technical work is pointing to as well.
elvis – great work – your charts are outstanding
Quantifiable Edges CBI likely to reach 5 today…could easily reach high levels in next 1-2 days. http://stks.co/t18oj
You might get a bounce Sunday IF Abe win election, but by weds when anti Euro goverment takes over Greece it will be utter carnage.
I do not like how the technical chart is morphing. What started as a rising megaphone pattern is now morphing into a downward megaphone … eerily similar to the Sep 19 top which is analogous now to the Black Friday Nov 28 top.
What might potentially happen now is a bit of a mini crash and capitulation on Monday Dec 15 to form a very short term bottom and then it will top out likely mid-week possibly Wed Dec 17. If the price stalls and reverses around SPX 2050-2060 (max 2070) at that top and fails to make a new ATH then the potential is there for a massive sell-off for the last half of Dec that could resemble the first half of Oct.
I am stuck in some long positions in AAPL and will look to shed it next week on anything resembling a bit of a rally.
I could not understand why UVXY was rising as much as it did earlier this week despite the rather “mild” correction prior to mid-week. Now I believe it is the early warning flag signalling a pending massive correction.
Believe me, I was caught with my pants down becoming too complacent while staring at the standard megaphone pattern ….
Steve T, you have been too bullish and perhaps that over confidence cost you the trade. If you’ve been listening, there are plenty of reasons put forth to be cautious. Now, about your AAPL, we have a good bounce next week so don’t sell on panic, which will be again a mistake. But when the bounce is over, expect a much bigger downswing and make use of it.
I agree and think the odds are good that there will be a bigger downswing after a mini rally. But do not get me wrong about being “too bullish”. There will be new 52-week highs in 2015 and that is what my analysis is pointing too. The price swings/cycles that have been occurring for the last while going back 18 months now are merely repeating patterns but only escalating at increasingly higher prices. The downside is that the magnitude of the swings and volatility also increase accordingly and that makes it tougher to stomach too.
Steve, I admire your transparency and willingness to tell it like it is. Well done, and I hope others take note. No one is ever right 100% of the time.
Yes positions are important to declare – however unless they are realtime less so ofc….:)
GLA
J
I am 100% cash, waiting for short term technical buy signal on Monday.
You are a wise man, J 😃
Lunar weather report:
Apogee clouds clearing Monday or Tuesday.
Perigee sunshine taking over and maxing on 22nd.
Declination equatorial tornado Tuesday to Thursday (tornados push and pull price rapid).
Lunar Edge in all its glory all next week.
Planet weather report:
Venus superior opposition behind us and it’s positive tones are leaving.
Merc retrograde mid cycle malaise setting in.
Saturn (the cosmic mute button) opposition over and the Friendly Planet Jupiter is approaching, and Jupiter improves the neighborhood.
Seasonal weather report:
Sunny skies until Xmas
Short term price report:
Setting up nicely with mild down draft waiting for a strong day to indicate
short term trend change.
This weather report is brought to by Humble Pie baking company offering baked goods totally free of the gluten of fear and greed. (Well a little greed).
Betafish,
That was good! Let us know when you start to see storm clouds reappear!
SC
It looks like my first scenario may be playing out where Nov 2014 top equals Oct 2007 top. Too bad my indicators did not give a sell signal but only a warning (6-7% decline possible) since bears did not capitulate.
Follow through on analog is 6% decline in two weeks (SPX 1950-60) followed by Xmas rally 62% retracement 2020-40. If I see too much bearishness, I will expect the result to be like the Oct reversal.
below 1964 SPX it gets very interesting imho, although I suspect we won’t see that yet.
good weekend all.
J
And, out of the mouths of babes….. Said Thursday morning…..
“It looks like we will recoup all losses today and tomorrow.
It’s so easy, it shouldn’t be legal.”
Nicolas was absolutely right about recouping all losses!!
I did!! And more! 🙂
Yes NIcholas gave me very strong conviction to STFT Short the f******* top!) Thanks Nicholas!
Yes, I saw your comment at the time, and was thinking the same thing…. 🙂
Poor Nicholas. He gets no respect.
I have talked to a few large players. Whispers of a mini crash on Monday given the action we say today. Gentleman… as I said a few days ago. I think it has begun.
Well, just went through quite a few charts, and if you’re long, I got nuthin’ for you…
Didn’t see much (as in nothing) that would make me want to be long the stock market right now…
Other than inverse ETF’s, very sorry charts…
I’m already regretting covering some shorts late today… Oh well….
IWM looks ready for a big drop:
Some other notes: http://goo.gl/YkTyp0
great site! HYG room to fall to 78-82?
Thanks! Credit spread still quite low. It is quite possible that HYG drops to <80.
Bob Hoye
http://www.safehaven.com/article/36102/heightened-the-joys-of-intimacy
Nothing surprised me in Fridays action. Global Indices along with internals have been signalling for weeks that something was afoot.
Deflation is taking hold. Forget all the theories surrounding crude such as attempts to hurt Russia and OPEC trying to destroy the US oil industry. It is declining purely and simply due to deflation and that folks will sed FEAR into Central Bankers next week.
Expect action very soon from CB’s because I suspect markets are going down hard.
The result will send gold soaring.
In regards to AAPL I warned the other week that there had been a “sea change”. The fact that it had a significant down day on no news on broader market strength was a clear signal that things were changing. Yes AAPL share price has seen substantial appreciation in recent years but there is reason to view this as a major top and as such approach with caution.
All the bullish rhetoric in the US media about US strength and the US outperforming the rest of the world, despite the weakness emerging globally, are among many things arrogant to think that the US was going to be a stand alone safe haven.
Notice that “bullish news” this week was sold into. That has not happened for a very very longtime.
Finally, I expect the likelihood of a huge plunge in the Hang Seng on Monday. I copped some ridicule the other week for my bearish calls but globally indices have been teetering on large declines that just seemed to get constantly thwarted.
That will nt go on indefinitely as eventually the cracks will become too wide. Crude being one such crack.
A huge plunge in the Hang Seng from here will commence the break down of it’s larger trend and remember where the 87 crash began?
It began in Hong Kong on the Monday.
Be prepared!
http://stockcharts.com/h-sc/ui?s=$HSI&p=W&b=5&g=0&id=p62466011636
I think there may be some shakeout early next week…..and lets not forget that no major technical damage has been done yet – damage yes, but not major….
imho
J
New post finally out. Thanks to all.