

The 2 days either side of Thanksgiving are typically bullish so there are reasonable odds November ends as an up month, which would negate the October monthly hanging man candle. However, the last 3 daily candles, two black and one red, suggest a brewing reversal. Seasonality doesn’t always work, so let’s see how today and Friday play out.

Source: Stockcharts
Apple made a notable intraday reversal and closed down yesterday, so I am now looking for follow through from this leader. Meanwhile, bonds and miners had strong up days yesterday, adding to the likelihood painted by other indicators of a turn in equities being close at hand.
All year I have pointed out the outperformance of the defensive sectors normally associated with market tops. Below are highlighted previous years where defensive sectors made the top two rankings like 2014.

Source: Charlie Bilello
1990 finished the year down -6.56%, with a 20% drop within the year. 2000 ended down -10.14% and 2008 down -38.47%. 2011 finished exactly flat, but experienced an 18% drop within it. Yet 2014 is so far up +11.83%. How can we reconcile this?
One way is for 2014 to yet end much lower, with a steep down December. The other way is somehow ‘this time is different’.
Here is the updated comparison of the topping processes of 2000 and 2014, using the Dow Jones World index. The timeline runs similar due to the solar maximum occurring at a similar time of year. In both cases the topping process began in January with divergences from that point in breadth and defensives. The solar maximum itself provided a second peak, followed by a double top in July/Sept to complete the topping process. The notable difference in 2014 is that the double top was higher than the previous two peaks and the subsequent rally back up in price stronger too.
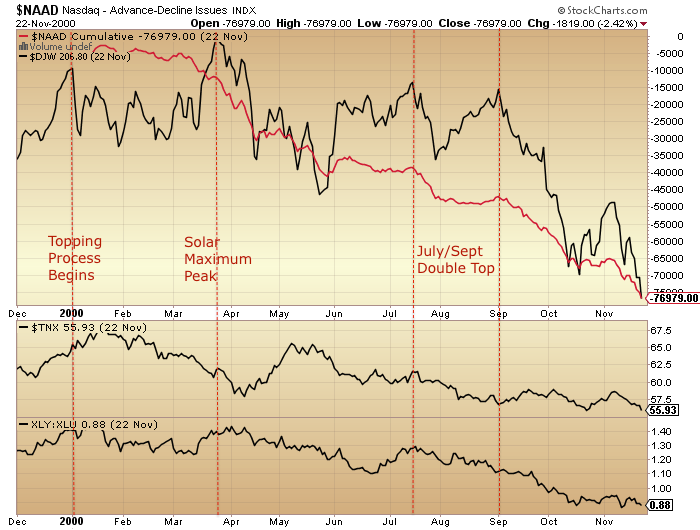
This fits with the picture painted by the defensive years shown further up, namely that the anomaly is in price action. Again, this could be resolved with a sharp crash late in 2014, with price belatedly converging with indicators. Or, option 2 again: somehow it’s different this time.
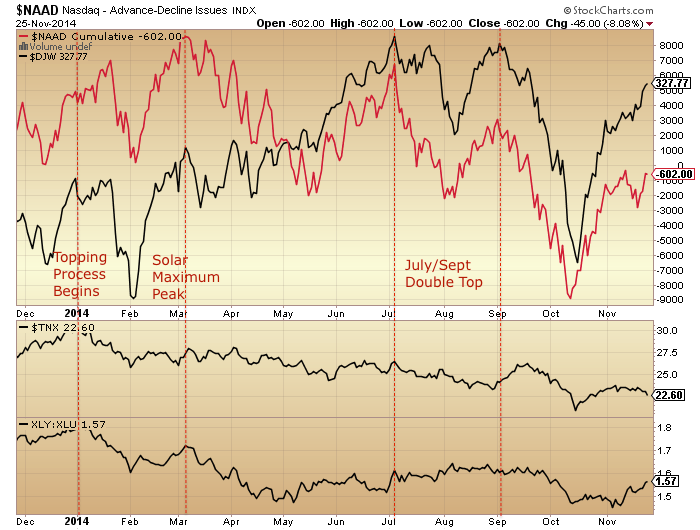
Another version of the 2000/2014 comparison is shown below, using the Wilshire 5000. In 2000 we saw notable divergences in sentiment/allocations (mania), volatility and breadth as of around July. Price then followed down. In 2014 we see similar divergences from a similar point, but price has so far gone the other way.


I suggest the same two options: a sharp crash is coming to rectify the anomaly, or this time is different.
One way this time could be different is if these divergences are repaired, resetting the topping process. But with froth this extreme, is that realistic?:
Margin debt was released for October. A decline from September, keeping the peak-to-date still as February.
 Source: DShort
Net investor credit also declined, with its peak-to-date being August. Clearly the progression in margin debt looks a little different from the 2000 and 2007 peaks, but this again fits with the strong action in price. Nonetheless, the current peaks in both leverage measures fall either side of the expected smoothed solar maximum of April, which fits with the mania peaking around then, putting stocks on borrowed time.
Historically, manias saw (and needed) leverage rise into the peaks. With leveraged loans as well as margin debt having apparently peaked out, it suggests stocks really ought to snap or have snapped, which takes us back to the conundrum of price action, as US stocks are at all time highs here in November.
In the comments yesterday I shared the below comparison of final price thrusts into major peaks, with the rally since October in 2014 being similar in size and duration, although arguably with a little room for more of both:
 All the evidence I have shared in recent posts points to this indeed being a final rally, the last peak in the topping process. If so, then we need to be aware of the way these rallies peaked in the past: sometimes with an inverted hammer candle (a strong intraday reversal), sometimes with a topping range whilst momentum diverged.
In other words, if the last 3 sessions have been markers of a change in trend and an end to this 14% rally completing around the new moon then we could see either a strong reversal and no revisit of the highs or we could see a sideways range lasting a couple of weeks as momentum diverges. That both options are possible doesn’t make it easy, so we will just have to take it day by day.

Thanks John. Especially for the last part final thrust before major peak. We are really close for that. The longer the sideways that may bring a sharp drop is more likely.
John, I sincerely hope you are right as much as odds are stacked against the bears into Thanksgiving and Black Friday. We need the decline now, particularly in the IWM, which has a tri-star doji on the weekly and if prices hold here, it would setup a huge squeeze into the ATH highs.
Thank you John.
I know we are close a correction of some kind, I have a strong feeling the Bulls want to round this week up with ultra bullish headlines showing a trader wearing a cap with
Dow 18k+
It’s the kind headline that go down well into the long weekend.
Let’s see what happens,
Thanks John
The issue i have with a bear market is that US gdp came in very strong yesterday. Im not saying a bear market cannot happen without a recession but the odds are stacked against imo.
It comes down to what leads what. Contrary to popular belief, the stats actually show the economy is dependent on the stock market. In Q2 2000, GDP growth came in at 7.8%, but you know what happened next.
Official GDP numbers are fabricated, Duncan, just as official inflation numbers are fabricated. They are fantasy numbers created for public consumption, nothing more.
“There are three kinds of lies: lies, damned lies, and statistics.” –Mark Twain
Just to elaborate a bit on DJ’s comment, please keep in mind that for every percentage point the Gov UNDER-estimates reported inflation, doing that ADDS a percentage point to reported GDP…
For example, if the Government reports inflation at 1%, and it’s really 4%, you just added 3% to reported GDP, that is just fiction…
And there is a LOT of motivation to understate inflation numbers….
SSI adjustments every January is just one…
I’m not sure what the real numbers are – maybe Shadowstats is a better source – but just saying that using ~reported~ GDP numbers to do anything other than chuckle at is probably non-good…..
My thoughts, anyway…
But, to be sure, WTHDIK….
I’m still underwater on some shorts from earlier in November…
Well said, Barry. You make excellent, salient points about why the government would want to report less than truthful numbers.
That´s it John.
My alternative scenario for the Industrials was marginal highs in nov´14 in comparision to 2007 top structure, thus what I´m expecting next is at least -10% decline, to rebound and finally the plunge, in one ot two impulses through 2015-begining 2016.
Best Regards
@apanalis
Thank you John Hampson
I think you are right about that AAPL reversal.
Is this the 2nd worst time in history to own stocks? This guy thinks so. He’s pretty good.
http://thefelderreport.com/2014/11/25/this-is-probably-the-second-worst-time-in-history-to-own-stocks/
keep up the good work and let’s hope there continues to be some great comments and shared ideas
Thanks
There are the index charts i am watching. They are not my work but the author does a nice job.
sorry, I thought i was just posting links, i didn’t realize the charts would post and screw up everybodys screen width
Short SPX 2067 …. swing trade
Looks good to me Specie. Very interesting read.
Thanks John, as always, for the most comprehensive analysis available anywhere. Truly superb stuff. Notice on Doug Short’s charts that stockmarket peaks occur as margin debt starts to reverse (2000, 2007, and now it would appear in 2014).
Appreciated
Bad news for goldbugs. I am a little afraid to stay bearish on gold after the last 3 years but Rosen of Delta, Prechter of Elliott Wave, and Flannagan of Gannglobal have turned bullish. Even they can be right but I am standing aside.
Hi Kent
Did you see the spike last night over $1,450
I wonder what that was all about? Fat finger? Hint?
http://www.sharelynx.com/newsblog/index.php?post/2014/11/26/INO-Gold-Price
No , I hadn’t. My thoughts are never put a large market order into an illiquid market.
“Flannagan of Gannglobal have turned bullish”
These folks have had pretty bad calls on the metals specifically, if you look at last 1-2 years worth of their forecasts. They are not traders, simply newsletter sellers/providers. Big difference.
Thank you John. Your chart showing the thrust into the 2007 top shows price for the SPY in the 1300’s. However, price was in the 1500’s. Is that a mistake or is it just my “old eyes”?
Have rechecked and it was 130s
DOW 18k would make a great festive headline,
so a reversal right now would surprise me.
GDP measures what has already been,
however there looks to be momentum left in the US.
The global growth outlooks appears to be darkening,
my own take is this is an advance glimpse
of the next recession and this trend accelerates in to 2015.
Best to stay openminded as data changes quickly, 18 months
ago many were convinced that US QE would end in huge inflation
with the yield 10 Year heading for 4% +, it now looks as if it
will soon trade sub 2%.
Data is largely irrelevant, it is how the data is received.
imho
J
agreed. Same goes for news in general. It’s not the news that matters, it’s how the market reacts to the news. Lately, most news events have been used as an excuse to buy.
There seems to be a component of the price action of miners that trades in step with other equities in the general market. If equities take a quick dive, I think miners could follow down, at least at first.
Spiral reached max expansion last night and is contracting until 12/7. Forecast path for today is down with velocity 12:00 to 2:00 est. https://twitter.com/mjmateer
Thanks Peggy, your posts are really appreciated.
To a degree only, as sentiment is always a factor.
Longer term fundamentals are key.
whole bunch of US data came out this morning, i don’t think there was one that beat expectations… s&p is up. i don’t think data matters any more.
Hi all ! So, how are your short positions doing ? I told to buy AAPL, the QQQ and IBB.
Who cares about the data ? Central banks are buying stocks hand over fist and they have unlimited buying power, so this market cannot go down.
This is by far the easiest market i’ve ever seen.
Interestingly, you said pretty much the same exact thing on Sept. 24th…
And you’re probably just as right here too….
Central banks WILL be buying much more, hand over fist….
I’m just guessing from much lower levels…
So……for me…… Ding! Ding! Ding! Ding!
Nicholas, the last post of your’s I read you
had gone short.
You read his posts???
Dr. Copper is warning ever more strongly:
http://www.bloomberg.com/news/2014-11-26/copper-falls-to-three-week-low-before-u-s-goods-report.html
I think that all the ducks are lined up in a row (American cultural term) and that it now depends on the Yen to rally which will set off US stock selling as the Carry Trade reverses due to a world wide downturn and no where else to invest all that borrowed Yen so it will be paid back regardless of BOJ interest rate policies. (I went long Yen yesterday).
More news pointing towards declining GDP in the Quarters to come. Are stocks still forward looking?
http://finance.yahoo.com/news/u-core-capital-goods-orders-fall-second-straight-133303577–business.html
American heavy industry in decline; recession in 2015?
http://www.bloomberg.com/news/2014-11-26/deere-misses-profit-estimates-as-tractor-sales-drop.html
The Mercenary Trader has a great article on Seekingalpha:
http://seekingalpha.com/article/2656235-the-dollar-is-a-lawnmower-the-world-is-grass-and-emerging-markets-and-u-s-multinationals-are-next
It says a rising $ is monetary tightening. Secondly, 50% of S&P earnings are from overseas. A higher $ will nail them.
A problem with the bear case is that the US credit cycle has not turned. The strong $ could be causing that without anybody realizing what is happening. Of course we are no longer QEing which is relative tightening as well.
There is the possibility that a major trend change is underway for the Yen and world markets due to the Yen Carry Trade. Not only is their turmoil among Japanese politicians but there is turmoil at the BOJ.
And there’s this: If it’s true that a rising dollar = monetary tightening, will the Fed allow that to go on for very long? They don’t want tightening, at least not right now. So if the dollar continues rising, will the Fed step in again?
Have they ever been forward looking? That’s the hype, but I think they are reactive rather than forward looking. Their prices are determined by human emotion and the herd instinct.
Copper looks terminal chartwise. The yen does,too. The article below from Mercenary trade says the yen will continue to fall as the emerging markets race them to the bottom.
I read what most have to say.
I usually look for views which challenge my
own bias, more interesting for me to read
someone with a different take – Nicholas
does not fit that category – however if he is
long and strong then good for him,
but only he knows what his real position is.
Interesting that VIX/VXX have been pushed down to levels that have marked tops. The trade as I understand it is to sell volatility as a hedge. The net result is volatility is as distorted as the rest of the market, but the hedges will have to be unwound should volatility jump. Is the whole system of central banks pumping QE into stocks really risk-free? The answer for the past 6 weeks is “yes” but even a cursory glance at ant chart of volatility suggests this risk-free confidence is not a permanent state.
How is selling volatility a hedge?
For those who are nervous about their shorts I recommend the story of Livermore when he first became a millionaire by shorting railroad stock after the San Francisco earthquake.
US stocks may not react hard until next week which not only fits with his story but with the monthly MACD finally giving a signal too for a crash next month.
I do think we will get a top today or Friday and then a pullback in December. But I would be very surprised if the market drops more than a few percent.
According to the pattern, the SP is still in wave 5 and v:5 has not yet completed. Until v:5 is complete, the SPX “can”, and usually does, make a new high. But when this current leg is complete, it should be the last leg of the rally from 1820spx low. SP seems to be in ultra slow motion. Probably due to the low volume and holiday.
There is still room for upside trading in v:5, but the amount of advance is very limited at this point.
Golden Nugget please would you be able to post a chart of your count since 1820? I thought I was on top of it until it started to move sideways from 31st Oct. Thanks in advance.
I don’t know how to post my charts on this page but I can easily tell you were the waves are. The wave count is fairly easy until we get to the end of wave 3. It gets sloppy there because the wave 4 was a running complex correction. Because of the “good news” the wave 4 ran sideways instead of pulling back as most waves 4 do. It is the running wave 4 that was tricky. Print a SPX chart and label as I have.
1876.14 = wave 1, 1856.71 spx = wave 2, 2041.27 high on 11/11/14 is wave 3,( and I can break that down if you need it.) Now for wave 4, it is an abcxabc pattern that ends at 2034.48 on 11/17/14. You should be able to see the sideways up and down 3 leggers. I can break it down if the abcxabc pattern isn’t visable. Then we start up in wave 5. 2056.o4 high is wave i:5 up on 11/18. This leg can be argued as a 5 lgger or a 3 legger. If it is a 3 legger, then this wave 5 will be a dia. tri. pattern.
wave ii:5 = 2039.68, wave 3 of 5 if the open on Fri. at 2077ish. Again, I can say for sure if that leg to 2077 was a 3 legger or a 5 legger, big gap erases the information. If it is a 3 legger, then the dia. tri. possibility still exist. Then down to 2056.81 is wave 4 ( or a:4). If 2056.81 completed iv:5, then we are in the final v:5 now. If this is a dia. tri. 5th wave, it could end on the trend line off the 2056 high and 2077 high. That would be in the 2090’s today. But if it is a normal 5th wave, it could end much lower. It could even unfold as a 5th failure making Fri ( iii:5 high) the actual price high. If I knew if it was a dia. tri. or a normal 5th wave, I could be much more precise regarding the final target. A dia. tri target is much higher than the normal wave 5 target would be. If it is a dia. tri., it started at 2034.48, and a thrust back down to that level will be seen when the final v:5 is complete.
Golden Nugget, thanks very much for your detailed answer. I’ll have a go at labelling the waves as you’ve noted them. One question: What’s the time frame of your chart please?
thanks! I like your count. I would also mention that even if the 5th wave is a diagonal triangle, they can end without the last wave of the diagonal triangle (wave “v” or “e” depending on how you label it) tagging the TL, although what is more common in 5th wave diagonal triangles is for the last wave up to actually break the TL to the upside slightly.
As you mentioned, if this 5th wave does turn out to be a diagonal triangle, once it completes we should get a very fast move down to the start of the diagonal triangle which is SPX 2034.
If you use a 2 hour chart you might see the waves easier than a 4 hour chart etc.
Purvez and GN,
Perhaps the blue tracking counts in the 210pm entry resonates.
http://market-timing-update.blogspot.com/2014/11/market-timing-update-112614.html
In addition, it’s possible the pending high is wave A of wave (E) of a larger expanding ending diagonal triangle (a megaphone-like structure), especially taking the duration of the waves into consideration. That scenario suggests a wave B pullback and wave C to new highs, perhaps around Mar/Apr 2015 to finish this run.
For the larger structure, see Chart 2 here:
http://market-timing-update.blogspot.com/2014/11/mtu-weekend-ed-gaps-and-triangles.html
Hi MTU,
I can send my chart from 1820 low if you have an email. I’m not sure how to post a photo on a blog.
I have the wave 3 high at 2041.27spx and the complex running 4 ending in an abcxabc at 2034.48 spx. I was temped in the beginning to make the last abc of the wave 4 part of a dia. tri wave 1 up, but it wasn’t a good fit. The best fit is 2034.48 low to 2056.04 high as i:5. The question is, ” is that Fib. 21 point leg a 3 legger or a 5 legger” ??? If it is a 3 legger, then this v:5 is a dia. tri. that will likely end near the upper channel line.
Since this “could” be a dia. tri. pattern we must use the wave ii:5 low (or the wave 4 low at 2034.48spx) as the “sell signal” support. The wave i:5 in a dia tri pattern can not be viewed as support because the iv:5 can dip below i:5 and still be in an uptrend.
On the bigger picture from 666 low, I have it as an abcxabc and in the final v:5:c now. This leg up from 666 has the power of an impulse leg, but it doesn’t break down well as an impulse. Maybe an irreg. B or in the case of the DOW, maybe it is the “D” of an expanding abcde pattern. Sometimes called a megaphone. This pattern would be extremely bearish. That could throw the “E” down to 440 spx area, which is the birth of acceleration.
MTU your Chart 2’s Expanding Ending Diagonal is what I’ve been tracking on the Dow. I concur with you that the current wave is an ‘a’ of the final E. I was really trying to make some sense of the pattern in the Dow since the 31st Oct high which is where I see the sub wave iii ending in the Dow. Since then as you rightly say ‘triangles and gaps’ galore!!….but no easy count. Thanks for your comments.
GN I do see where you are coming from. I need to now overlay your comments on to the Dow as that’s the one I track and trade. Many thanks for taking the time for such detailed comments.
I particularly like your comments about 444 being where the acceleration started. I hadn’t looked at it from that perspective. Wow that would be ‘SOME’ correction. Lol.
“Price Anomaly”
There is no such thing as “Price Anomaly”.
It is considered anomaly simply because it does not fit into one’s agenda. Whats anomaly for one trader – is a price target for another trader.
“Mr. Yen” sees decline in Japanese Yen as over:
http://www.bloomberg.com/news/2014-11-26/mr-yen-sees-drop-he-forecast-nearing-end-on-economy-currencies.html?cmpid=yhoo
HAPPY THANKSGIVING
John,
I think we all have been hoping against the most logical outcome on this holiday weekend, its just plain wrong to hope there would be decline during holiday. My other question is how do you deal with this kind of short trade mentality, where you have to hope for some catastrophe to help your trade. It pretty grueling.
Bill
It should be fairly clear that I have aggregated a wide and deep case for why stocks are a short. I am no permabear hoping for a catastrophe. Rather there is abundant evidence for why this is a mania and why this is a topping process. Mania + topping process historically produce ‘catastrophe’.
John, at the same time one will get wiped out trying to short mania type of rally at the wrong time.
You can be correct in the long run but still lose the trade. Happens all the time. Money management rules over everything!
———————-
John Hampson
November 27, 2014
It should be fairly clear that I have aggregated a wide and deep case for why stocks are a short. I am no permabear hoping for a catastrophe. Rather there is abundant evidence for why this is a mania and why this is a topping process. Mania + topping process historically produce ‘catastrophe’.
Reply
Three important charts:
http://www.businessinsider.com/second-worst-time-to-own-stocks-2014-11
Where can I find update on gold miner percent bull?
stockcharts.com and enter symbol $BPGDM
http://www.zerohedge.com/news/2014-11-26/global-gold-demand-will-overwhelm-manipulators
I know what you’re talking about but I can’t find it now.
I can present this for your consideration.
==================================
“Two weeks before gold’s September 2011 peak, the 5-day Daily Sentiment Index (trade-futures.com) rose to 96% gold bulls, a record optimistic extreme that dates back to April 1987, when the data start. Last week, on November 5, the 5-day DSI fell to just 5%, a record pessimistic extreme.”
Quote from Prechter
Just another 29-day run above the 5-day MA… oops, there’s never been an equivalent run, according to this: http://www.zerohedge.com/news/2014-11-26/madness
We’re supposed to believe this can continue essentially forever as long as CBs are buying equities and pumping in QE liquidity anywhere on the planet. Reminds me of Chuck prince’s quip about dancing as long as the music is playing.
Today’s market activity is merely a repeating pattern of what occurred previously in Apr-Jul 2014 which itself is another repeat of Sep-Dec 2013. The only difference is that in certain stages there are variations as to how it gets to some specific point, such as it could be a choppy grinding slow rise or a very strong rapidly rising uptrend.
But two aspects stand out from what I conclude to be the three fractals outlined below. The initial V-recovery from the extreme market bottom had a big surge within the initial two weeks. It formed a consolidation level that continued until about 24-25 TDs from the extreme bottom. It then accelerated to the upside from this consolidation level for another strong rise that lasted over 30TDs.
Looking at SPX:
Sep 18-2013 top (1730)
Oct 8/9 bottom (1645)
Oct 29 initial V-recovery top (~1775)
– about two weeks of consolidation
Nov 12 bottom (1760) 24TDs from Oct 9 bottom
Nov 13 blastoff
Nov 29 minor interim top/reversal (1815)
– about two weeks of consolidation
Dec 12/13 bottom (1770)
Dec 16 blastoff
Dec 31, 2013 top (1850) 33TDs from Nov 12 consolidation “low”
Apr 4-2014 top (1898)
Apr 11/14 bottom (1815)
May 13 top (1905)
May 15/20 bottom (1870) 25TDs from Apr 14 bottom
May 21 blastoff
Jun 9 interim top (1955)
Jun 12 low (1925)
Jul 3, 2014 top (1985) 31TDs from May 20 consolidation “low”
Sep 19-2014 top (2020)
Oct 8 top (1970)
Oct 15/16 bottom (1820)
Nov 10 top (2025)
– 1.5 weeks of (“slightly rising”) consolidation
Nov 19 bottom (2040) 24TD from Oct 16 bottom
Nov 20, 2014 blastoff
– 31 to 33 TDs from Nov 19 consolidation “low” implies second week Jan 2015 for a potential interim top
What makes this current fractal such a beast is that the trend when it dropped from Oct 8 top occurred swiftly without any counter trends and vice versa for the rise out of the Oct 16 bottom. In fact, post-Oct 16, all equivalent periods of “weakness” that had occurred in previous fractals only resulted in consolidation that held price to maintain high levels. In other words, the anticipated dips that should have occurred at specific dates such as Nov 15/17 never occurred and it only temporarily stopped rising. However, the anticipated dates derived from counting TDs from critical market junctures were still extremely accurate for predicting when the next big move occurs.
From the consolidation “lows” of prior fractals Nov12, 2013 and May20, 2014, SPX rose 90 points (+5%) and 115 points (+6%). So assuming Nov 19 is the new consolidation “low” at about 2040 then expect it to project to possibly 2150 by mid-Jan 2015.
Another angle of looking at it is in 2013 fractal it rose 110 points to arrive at 1760 consolidation low and then rose 90 more points from there and in spring 2014 fractal it rose 55 points to arrive at 1870 consolidation low and rose 115 more points from there. Today it rose 220 points to arrive at 2040 consolidation low. Using the 2013 ratio that would imply rise of 180 points to 2220 or using spring 2014 ratio it implies either 2155 (+115 hard number) or possibly 2500 (i.e. double the 220 point rise).
What ever projection method one decides to use, if it indeed is simply another repeating fractal pattern, then it hits 2150 minimum in the near term. You definitely do NOT want to be short in such a crazy bullish market. The potential magnitude of the upside completely dwarfs any temporary minor weakness at this point. Do not try to be a hero and attempt to catch the “market top” and go short because it is either financial suicide or just your vain ego talking.
Wow! Excellent post Steve. Many thanks!
And Happy Thanksgiving to all who celebrate this holiday tomorrow.
Way to go Steve! Perfectly in sync with my thoughts.SnP likely to TOP around 2150 sometime between end Dec to early Jan and then PLUNGE 15-20%.
Interesting day. Stocks up but credit keeps on pointing to opposite direction. I do not see a reason why things should be different this time. This price anomaly must correct, probably soon.
John, I have the utmost respect for your analysis. There is really nothing else like it.
My question to all is: why are we not down huge?
I’m an ex-currency guy trading futures and my thing is monitoring ticks and 6J. Here’s my humble contribution to this ongoing discussion. Here is what I see. When dark pools come in as sellers, algos buy and sell VXX, supporting the market… when algos become sellers and drive the price down, dark pools become buyers, supporting the market… and so on and so forth. It’s fascinating how algos and dark pools have learned to work together over the years. Thanks to these dark pools/algos dynamics we are “stuck” so to speak with a market that refuses to “break” – substantial pullbacks are not allowed.
Today dark pools have been buying all day, while algos have been buyers for the first part of the day (and taking full advantage of the light volume) and sellers during the second part of the day. VXX has been trending down since the open.
Maybe I should post live updates to share what I see re: dark pool and algo activity in the futures.
Thank you. Updates on that would be useful.
John (the algos/dark pools John) please as a pre-cursor to your live comments would you explain how you determine where the trade is coming from? i.e. what defines dark pools vs algos. I’ve no idea where to start getting that sort of info. Thanks in advance.
Happy Thanksgiving everyone. Odds simply weren’t in bears’ favor this week, it is what it is. Thankfully, there is always next month as long as you remain in the game.
Thanks to our moderator and the many traders who post on this blog. Happy Thanksgiving Day to all who celebrate it.
Cheers
STEVE T as you wrote before starting tomorrow bags to 10 dec?
polder, if I interpret your question I think you refer to a previous comment where I initially thought what was a simple Nov 20 to Dec 9/10 straight up rise might actually become more like Nov 20 to Nov 28 rise then either a reversal or consolidation for a bottom into Dec 9/10 before a continuation uptrend into Jan 2015. It had something to do with Black Friday last year 2013 having an interim top and reversal.
There are two issues I have with this now. One, in the 2013 fractal the bottom occurred on Oct 8/9 or exactly one week earlier than Oct 15/16 in 2014. Thus, Nov 29, 2013 equivalent date in 2014 measured in TDs from the bottom is more like Dec 5 or 8. Secondly, as demonstrated so far, equivalent periods of weakness in prior fractals does not necessarily translate to lower lows this time around since it could simply mean it stops rising (but does not fall) or the acceleration of the rise merely slows down temporarily (but it keeps making incrementally higher highs).
And then the spring 2014 fractal essentially rocketed upwards nearly every TD for 13 TDs after the consolidation low ended.
So regardless, if it is a non-stop rise or one that might stall temporarily, in both prior fractals in the worst case you only had to fade at most about 30 SPX points for just several days before the uptrend resumed. So I do not think it is worth it to attempt shorting it or getting fancy by trying to trade in and out to catch every wiggle because you might miss the big overnight moves such as the ones that have been occurring recently. The strategy is quite simple at this point … stay long until at the very least end of 2014.
DAX nearing 10k
Steve T, interesting as always to read your take
on markets, 2150 was my best guess on the
year end SPX as previously mentioned.
If markets continue higher next week it looks
like more short will finally capitulate.
The only real glimmer of hope (short term)
is the marked slowdown in the
velocity of the price increases over the last week.
I think this needs to be viewed in the context of
very thin trading levels in the run up to Thanksgiving,
coupled with the incredible melt up over the past month.
However if short that is what I would cling to
but that could be invalidated by next Monday.
On the DAX, I thought weakness in the Euro area
would be too pronounced for it to trade much above 10k
for more than a few weeks (if it does reach this level again).
It will be interesting to see how this develops
and my DAX view may prove too cautious.
Might a situation be arising that with energy prices in free fall that a rising Yen would benefit the Japanese economy more than a continued falling Yen at this juncture in time? Has a point been reached where a rising Yen would cause greater good to the Japanese economy than a falling Yen would AT THIS TIME? The largest import to Japan is energy and with energy falling, with a rising Yen, would greatly lower that cost of production of Japanese goods to foreign markets while a rising Yen would do little to lower foreign competitiveness AT THIS TIME. If so, then the Yen may rally and the lows might be in for an extend period, or longer, should Japanese policies also change with collapsing energy costs. I am long the Yen.
I highly recommend that all who are short US stocks do as I have done and hedge their bets by being long Yen. I now think that the odds are growing of a hyper parabolic blow off top in US stocks that won’t top until January so now I am looking to reverse to long US stocks with a slight pull back early next week.
If US Stocks are rising in a “wedge” or “diagonal triangle” (as some have posted today with charts) then your evidence may be doing nothing more but pointing to an impending “throw over” of an “ending diagonal triangle” as Ellioticians would put it.
Your charts show that “if”, and I do mean IF, Americans turn from hyper-optimistic to pessimistic that the decline in stocks would be historical. But the problem is “if” and “when” THEY TURN. The somber reality is that the Ferguson Riots, nationwide, did not TURN the American public from extremely optimistic to pessimistic. So… it could be said that the nationwide Riots constitute –evidence– that the “turn” is no where in sight. If so, then any dip should be bought.
once again a negative news event becomes an excuse to buy. until the market starts selling on news, the bull train chugs higher.
Here is another way to look at it: The FED supplied the power to the multi-year –ascending diagonal triangle–; and, the BOJ and ECB will supply the power to the –throw over– of that –ascending diagonal triangle–.
The nationwide riots are a “blessing in disguise” that the “top” is nowhere in sight.
Take a long term look at the SOX index from 1995.
eclectic, please would you elaborate on what significance you are deciphering from this chart? Thx.
Richard,
as I posted earlier some remaining shorts
may capitulate next week.
I notice you appear to have altered your outlook
on US equities(short term) – January unlikely to be the
the top either, second half 2015 may fit nicely.
Perhaps a couple of days pullback next week,
however I thought that 2 weeks ago.
Recently, John posted a chart showing commercials were heavily net short as has never happened before at major tops. They may have taken their cue from the FED ending its QEs but now they may cover their shorts because they did not factor in the ECB and BOJ starting up their own QEs. As they cover their shorts a hyper parabolic rally may unfold that shows up as a “throw over” of an “ascending diagonal triangle”. Yes, I am looking for any short term pull back to exist shorts and go long.
Those who are holding substantial loses on shorts I think that they should consider any near term set back to “cut their loses short” and “reverse and double up”.
The big commercials who are short this market, as has never been done before, at major historical tops, are going to buy their way out of an historical “short squeeze” caused by the actions of the ECB and BOJ. Who is bigger and badder? The ECB and BOJ or the commercials who are short? In other words, the ECB and BOJ are going to cause an historical “commercial capitulation”.
I think the only thing different about this guy is that even the sophisticated investors will be surprised by how high this thing goes before it collapses. I’ve reached that conclusion after seeing this market continue blowing through projected Fib resistance levels like nothing, amongst other observations. Therefore I think most short positions right now are ill advised. Why not wait for confirmation of a strong candle down, and wait for the first minor retracement to get back in with a tighter stoploss? I think ultimately that is safer than trying to capture the entirety of the downward swing.
Agreed. SP500 is tentatively pushing up through major Fib resistance around 2065 – if it breaks cleanly through, we will have the priviledge of witnessing one of the biggest bubbles ever (SP500 would need to reach above 3300 to match some previous bubbles like the Tulip bulb mania). I still give that an 80% chance.
There are still many bears about, and they are still very obstinate that they are right. When the US stocks bubble is about to burst, everyone will be laughing at the suggestion of going short.
And there has been a large surge in sunspot numbers recently – there have been plenty of comments when sunspots are on the wane, but silence when they are on the increase.
80 percent chance. That’s very high odds! I’m start to lean in your direction, I’m position long, with small hedge (VIX calls), but need to increase long positions.
Happy Thanksgiving to all.
Please provide the data.
http://cfbw.com/sunspotcount.htm
That is a wise approach to trading. Very small short positions until 2034spx support is breached. Or some sign of an impulse down.
My analysis on tidal force and solar activity indicates this weekend is critical. I expect weakness into dec 15-17 for the next significant date.
I think we have a catalyst… OPEC output unchanged. Monitoring…
Is that bearish? – Brent off over 3%.
Falling costs of production, higher disposable incomes.
Oil embargo of 1973 sowed the seed for OPEC to losing control of its market share. A low price will bring on instability (a wild card) in the Middle East and (economically) destroy OPEC. American (fracking) technology has won and its energy sector will take a step back to consolidate for the next push toward independence and perhaps ready for its own oil card.
A student asks the Zen master “why do I feel pain?”. The Zen master answers “You feel pain because it was not painful enough…for you would have changed your behavior that caused pain”…….
Lower oil price ahead will cure the low price situation. . and another seemingly unsolvable problem playing out. An investment of the decade is unfolding.Buy the strong players. Patience.
Besides oil supply and demand, watch the currency war.
Purvez, I saw this at the link; below. Cheers.
http://goldtadise.com/?attachment_id=342841
Thx that was interesting.
Crude is crashing. Now below 70, down nearly 6 percent. This will likely hurt SPX due to oil and support companies being included in that index. Not sure of overall impact. Low oil prices are good for consumers, so retail should benefit. But on the other hand, if oil market looks like it’s crashing, maybe that fear and uncertainty will spill over into the general stock market.
From Seeking Alpha and one man’s opinion:
Now I wonder if oil might be telling us something. The 2008 top at $141 was in July, well before Lehman, Fannie and Freddie crashed. Oil may have a better economics credential than Dr. Copper. And copper ain’t doing too well either at now under $3. Canadian $$ is also dropping like a rock, another strong deflation / recession signal.
It does not take too much imagination to see how the Central Bank driven / colluded currency war is behind all of the commodity price calamity. Because most commodities are priced in USD, especially key currency commodities like Oil and Gold, the crushing of the value of Yen and Euro, the second and third most important currencies, is bound to impact commodity prices. Devaluing CBs will chase the price of commodities down by further cutting relative value. This will knock down currency prices further in USD terms creating a deflationary spiral.
Knocking down non-Reserve currencies by QE will have the affect of creating a global depression, exactly opposite the desired effect. This will happen as the dollar gains strength in comparison to the weakening currencies (they must weaken against something, and that is the $USD). USD Treasurys hold a premium position to the non-Reserve currency sovereign debt due to increasing exchange value AND higher relative interest rates. This causes US Treasuries to hoover up all the foreign currencies that are being sold to create devaluation. It creates an unvirtuous circle down into Hades.
As countries lose currency to the USD sovereign debt it turns into capital flight. Capital flight will create balance of trade and debt service problems and will cause recession first in the EM countries. As the USD strengthens, imports to USD linked markets will increase and export strength will decrease. Eventually all USD linked economies (most of Asia-ex Japan and the US) will follow the energy export EMs into the tank.
Bottom line: Cheap oil is only good for the short term. Longer term, 6-12 months, it will be a global disaster
Europe’s reaction to OPEC news seems positive. DAX and other Euro indexes are up. FTSE is the only one that’s down, and only very slightly (more oil producers in FTSE than other Euro indexes?)
Big moves in currencies and oil. Looking forward to see how Energy bonds will react.
Oil – bought a single digit RSI here for a trade. USDCAD fading it too… BTW 6J made a higher low, bid tone to it today.
6J found resistance at is 9 day exp and support at its 100 hr. With its daily MACD (12, 26, 9) have given a buy signal I expect the 100 hr to hold and a rally above its 9 day exp.
Collapsing energy prices could be the trigger that turns Japan “conservative” like the US recent elections and that would rally the Yen to incredible heights as its largest costly import would collapse in price making Japanese industry much more profitable all other factors remaining the same (exports to the US of A).
At this time it might be better to think of Japan as Japan INC. With the largest import cost of production being energies then if exports remain the same, or increase (to booming US of A), then radically falling energy costs will greatly increase profits.
The recent BOJ QE policy may be abruptly ended or even reversed. Why? Because radically falling energy costs will increase profits (sales remaining the same) which will cause equity valuations to increase so that support by the BOJ is not needed or wanted. With elections looming, and Americans having gone conservative (Japanese are naturally very conservative), the BOJ might reverse its policies and sell stocks at a profit and reduce liquidity instead of increasing liquidity. Such would send the Yen skyward.
Your thinking on the BOJ reversing course due to lower oil import prices ignores their desire to see inflation, not deflation.
Let’s see how energy bonds react to this but we’ll have to wait Monday as Bonds are closed tomorrow aren’t they?
BP. BG. RDSB CNA BLT – all energy related in the UKX.
That’s ignoring the general miners and other utilities.
6% plus falls now on WTI and Brent.
Is there anyone who would be willing to help me with a project?
I would like to see if the concept of gravity and geomagnetism can be applied to predicting LONG TERM moves in commodities; specifically the precious metals?
I have isolated seven (7) specific dates for research; to see if the historical data can provide any clues to forecasting market direction?
In the first instance; are these tools applicable for anything other than short term trading? If not; then no need to proceed further. And what time period should be analyzed prior to those turning points? Say, one month?
If anyone is interested, who understands this arena, I’ll offer to pay for your services.
Thank you.
Can we discuss over email? My email address is ljohn8868@gmail.com.
my email is ss999@live.ca
Hi ! Yes, I can help you but I charged quite a bit for my proprietary research. Let me know if you are interested
email ss999@live.ca
Eclectic,
I have a few thoughts on construction of a model for analysis. It is a little involved for this post, but if you post email, I will send to you my thoughts.
SC
Things are pretty lively for a holiday. Still holding that single digit RSI buy from a few minutes ago.
Oil rallied on OPEC statement some days ago that indicated they may cut production. Now they have decided against it so the market is selling off.
I think someone big out there was “removed” from oil… certainly feels that way.
Removed for how long? that is the billion dollars question.
@ Newt: indeed!
Somebody wrote that some might be hoping for a crash at Thanksgiving. It is not that we are hoping for a crash at Thanksgiving as much as we are hoping our trading tools are giving us proper guidance. If there is to be a crash, we are “hoping” to be prepared for it.
I also hope our government stops this massive land grab in accordance with Agenda 21, and stops pushing the small arms treaty to take our guns, and stops trying to push a law that makes it a crime to posses water on our land (more Agenda 21). But if all of this is to happen, I “hope” I am prepared for what is to follow.
10 Bubble Rules Bubbles
You’re Going to Want to Know
Dear Trader,
There’s a golden thread that weaves its way through all that’s happened to us and will happen to us. It boils down to one word: bubbles. Yet one economist and analyst after the next are announcing that there is NO bubble… or at least not yet. And they give their reasons (none of which make any sense). Even Janet Yellen, the Fed chairman, is of the opinion that we’re not in any kind of bubble.
Here’s the thing… That is exactly what happens when bubbles form. People from all backgrounds — the smart and dumb, the educated and the educators — deny the existence of that bubble. I can understand why they do it. Most of them benefit from the free ride they’re enjoying as a result of the bubble, they don’t want it to end. What they fail to realize, in their delusional states, is that bubbles don’t correct. They burst. And the aftermath is brutally painful. The fact that so many people are defending the Fed’s policies and arguing why we’re not in a bubble is the best sign that it is in fact a bubble.
By just stepping back and being objective, this fact is obvious. The trajectory of the market, especially in the last year, has been classically bubble-like in its pattern. The S&P 500 has seen a larger point gain than in the dramatic late-1994 to early-2000 bubble. It is up 177% in a little less than five years, and there has only been one bull market since the early 1950s that has lasted longer than that without at least a 20% bear market pull back. The last bubble that burst saw the S&P 500 rise 100% in five years, then crash to 58%!
The Fed is creating one bubble after the next by its policy of pushing down short-term and long-term interest rates, which leads to massive speculation and returns chasing. The consequence of unprecedented quantitative easing and money printing has not been inflation in consumer prices (as I’ve said for years it wouldn’t be), but inflation in financial assets.
Here’s the thing, from decades of studying all the bubbles in modern history, I’ve identified 10 rules that such phenomena follow. Knowing them helps you to identify bubbles when no one else can, and it helps you know what the aftermath will most likely look like when the manure hits the fan.
The 10 rules that bubbles follow are:
Rule #1: All growth, progress and evolution is exponential, not linear.
Rule #2: All growth is cyclical, not incremental.
Rule #3: Bubbles always burst; there are no exceptions.
Rule #4: The greater the bubble, the greater the burst.
Rule #5: Bubbles tend to go back to where they started or a bit lower.
Rule #6: Financial bubbles tend to get more extreme over time as credit availability expands along with our incomes and wealth.
Rule #7: Bubbles become so attractive that they eventually suck in even the skeptics, like a succubus ensnaring unwary men.
Rule #8: No one wants the “high” and easy gains of the bubble to end, so everyone goes into denial, especially in the latter stages.
Rule #9: Major bubbles occur only about once in a human lifetime, so it is easy to forget the lessons from the last one. The last bubble of this magnitude that burst was from 1922 to 1929: the Great Depression.
Rule #10: Bubbles may seem fruitless and destructive when they burst, but they actually serve a very essential function in the process of innovation and human progress (more on that another day.)
So next time someone tells you we’re not in a bubble right now, slap them and then show them this article.
Janet Yellen is merely a stooge for the Central Banks – an incompetent stooge at that. She would never, and let me say this again, never, admit that there is a Bubble in the Markets.
You are right. She is an employee of the bankers. Some might say the same is true of most of our presidents from Woodrow Wilson until now.
The problem is really with the definition of what a Bubble actually is. No where above did I see that. They seem to ‘someone’s’ view that we are overpriced somehow. We only know if we have been in a Bubble if it bursts and only then if we get a much bigger than normal correction. 2000 wasn’t a bubble in the Dow (it was in the Nasdaq), it was merely a high, followed by a ‘normal’ correction. We may or may not be in a bubble now, more than likely not. Are we overstretched, yes we are, but we don’t need a crash to work that off, time can work just as effectively as price.
yes, the definition of a bubble may be relative to one’s expectation of an overbought situation. The pattern is still in a bullish position, but this current rally could end the leg up from 1820. When this leg is complete, ( and we should be confident if we see an impulse down or a close below 2039 spx), then we could also see a wave 4 correction correcting the 3 leg advance from 666 low ( maybe 600 points). Or, a C=A decline which should be near 900 points + or -. Or, the most bearish pattern that could drive the SPX below the 666 spx level. If we asked if a number of people if a 600 point drop was a bubble/ crash or a correction, we would get different answers. If we asked the same about a downward spiral to sub 666 spx, we may still get answers on both sides of the fence. I think the point the author of “bubbles” was trying to make is that some kind of “serious” sell off can be expected to start fairly soon after the conditions he listed are present. I have depended on chart work more than anything else for the past 30 plus years. It isn’t 100%.. Unfortunately nothing is. The draw back to patterns is they often tell us what will eventually happen, long before it actually starts. This can create fear way to early and cause a trader to become cautious weeks or months too early and sit on the side while lots of money could still be made.
When the pattern began to print 3 legger advances, it shouted that a massive sell off would follow the completion of this advancing pattern. A corrective pattern always points in the wrong direction of the bigger trend. And this upward pattern breaks down to fit best as a correctional pattern. Some may argue the leg up from 666 is an impulse 1,2,3. If they are right the sell off may only be 600 S&P points, more or less. But if it is correctional, which is the best fit, the sell off “could” drop below the 666 low. Trusting in what the charts are telling me, I am waiting on a high to “sell short” rather than take the chance of buying long and getting caught in a promised landslide. Sitting here twiddling my thumbs is not making me any money. That is the draw back to observing the patterns.
1820 was an abc wave 4. This is a 5 legger wave 5. When it is complete ( “MAYBE” as early as the Fib. 34 daily window, which would be next Mon. through Wed.), try to be nimble and go with the flow. Or, trade long and use tight stops. A long trader might be making money while I sit here and twiddle my thumbs.
The problem with the charts is they tell me too much too early. The good part about the charts and patterns is they have never lied. Most of us know the markets crashed in 1929. If we were slung back to Jan. of that year, many of us would be too cautious to buy long because we know what is coming. We might miss months of bull market money. That could happen to me or any seasoned chartist from this point forward in time.
Thank you John. Will send you an e-mail. Cheers.
Re the above, I do find the idea most interesting that everyone benefits from the status quo of a bubble. As long as they are getting theirs (benefiting) from the bubble conditions. Even people who are benefiting from the bubble but aren’t even aware of the bubble.
@Richard, re: what you said above starting with your 6J comments. I could not have said it better. Great insight, very valuable contribution. Thank you.
Score big tomorrow. Big pay day on XLE and OIH shorts. 2000 puts ready for sale.. hehehe
The message from crude is loud and clear. A move down of this magnitude does signal global demand weakness as was witnessed in 2008 and 2011. Energy is a big enough market to have an effect on broad indices. So perhaps this is the catalyst shorts have been waiting for. The broad market has been in parabolic blow off mode since the $/Y has blown up its medium term rising wedge at 108 a couple of weeks ago. So unless the market drops back into this long established wedge markets remain parabolic for all those who believe that the parabolic stage is still ahead. Wedge over-throws are common and signal a strongly bearish reversal to come. Contrary to seasonal expectations this may turn into an unusually volatile year end. As we have seen last year algos and machines have been programmed to pre-empt any x-mss rally by November already. Agree with Richard Japan remains the spark that could turn the bubble upside down.
I agree. We seem to be at an incredible turning point. Many people are flip flopping between bearish and blow off top. What move hurts the most people right now? A santa parabolic rally or a sharp reversal. This is very difficult to be a bear right now. I am a bear but I am doubting myself. I am mostly cash and frightened to go short some more. I am guessing we have a move lower in December. Positioning is all that matters. Those commercial shorts are hedges not outright bearish calls. I am guessing everyone is on the long side of the boat right now. John’s Rydex chart would suggest extremely high bullish sentiment and positioning. Next week is key. If we don’t start to see the VIX rise then the bulls will get their blow off top. Cheers.
short term patterns on $/Y point to 114 as the ending rising wedge on the daily has broken down as of yesterday. This would point to a near term correction here. Crude Oil is leading equities with broader markets potentially at the September 08 candle which saw oil at a low of $63 having already had a 3 months hard down same as currently and markets at 1303 and ready to drop 50% from there. Same for 2011 when Oil was at $79 in July 2011 (having dropped hard from $115 in May 2011) with markets at 1321 ready to drop 20%. Oil only dropped another couple of points to $75 in 2011 while dropping another 50% in 2008. This is what makes investing in hard assets so difficult here despite bombed out levels and real interest rates coming down which would encourage investing in commodities. That leaves out right Equity shorts, cash, T-bpnds and long Yen as the only anti-correlated assets. In summary energy markets are bigger than precious metals with many funds left long energy for the last 1-2 years and liquidating here at low levels in to year end. This forced de-leveraging is very good news for shorts as the 2008 and 2011 experience points to.
Parabolic. Mania. Blow-off top. Bubble.
This is what a real one looks like: http://www.elliottwave.com/images/freeupdates/Image/Tulipbulbs.jpg
A 5000% increase in two years.
SP500 has increased “only” 211% in the last six years, while margin debt has increased even less, by 155% (contrary to what the Dshort chart above purports to show). I’m not saying that US stocks must inevitably and necessarily bubble up by thousands of percent over the next year or two, but the foundations are there (solar cycle etc); and circumstances are suitable (bank account confiscation; loss of faith in governments and their money etc).
The problem is that this is not a “mania”..
Pegasus, the UKX is heavily exposed to energy
and today’s overall price action was not even a blip.
Big falls in the sector, as per RDSB, BG, BP.
Otherwise markets unfazed, DAX well ahead again.
today is a holiday but the action in oil gives you taste for upcoming market moves over otherwise illiquid markets – could be interesting
The nation(s) with the most advanced technology will trump short supply/demand issues and rule the future.
On oil, I will bet and buy the consolidated US oil complex. Most intriguing and long term rewarding.
just to add equity market waterfalls both in 2008 and 2011 started after Oil had corrected to 60% and 66% respectively of its previous highs. We are currently at 63%.
Pegasus,
We are getting all sorts of sell signals on US equities as off yesterday. The IWM got a combo DeMark 13 sell signal. However it had an over lapping 4 count up. This should get very interesting. If you are right we could move down 20% in three weeks like 2011. That would blow everyone’s mind. Were we at new ATH in July before the meltdown in 2011? I can’t remember and I am not near a chart.
Best
did not come from ATH in 2011
This is very tough. Yen selling off again today.
If you want to see proof with –your own eyes– about what I am saying concerning the Yen this Thursday evening then look at Crude and all the major currencies against the US Dollar. With Crude down $5 the Euro, Pound, and Canadian, Australian, and New Zealand Dollars are all lower while the Yen is only very slightly lower. Some of those currencies are down significantly while the Japanese Yen is down the least and hardly lower at all versus the US Dollar.
Clearly, the slightest weakness in the USD and the Yen will soar. The proof is in the pudding…(right there on the quote screens before your very eyes if you would but SEE).
Richard,
Which way are you leaning? Blow off top in US equities or are you with Pegasus?
Best
We have been very lucky in the past several days in that unusually events are showing us the truth strengths of two major markets. The Riots in the USA are pointing towards US stocks NOT being weak or turning fearful for any panic selling at this time and the unusual selloff in Crude of the past 24 hours is pointing to the Yen being much stronger than most other currencies.
It simple stands to reason that if you see the potential for the Yen to rally then you should also see the potential for US stocks to rally too. I “see” both.
Wouldn’t a strong yen be detrimental to the carry trade and hence negative for US equites? I think yield spreads widening trump the riot news. Certainly interesting times.
Richard like Blue Star I’m a bit confused by your comments here. Earlier I thought you were arguing that the rise in the Yen was going to unravel the carry trade big time and therefore tank the US equities. Did I get that wrong?
Very much appreciate your macro economic outlook and comments and would be greatly assisted if you clarify my above confusion. Thx.
I assume that the Yen Carry Trade is not invested in the USA nor Japan. The fall in energies is a double benefit only to Japan because it increases demand from USA while cutting cost of production to Japan Inc. Europe gets reduced cost but also reduced demand from the Middle East and Russia. Reversal of Yen Carry Trade is being “pulled” from inside Japan and “pushed” from world declining into depression wherein moving money from one investment to another is not worthwhile so may as well pay off money borrowed from Japanese banks before Yen rallies relentlessly.
The problem is really with the definition of what a Bubble actually is. No where above did I see that. They seem to ‘someone’s’ view that we are overpriced somehow. We only know if we have been in a Bubble if it bursts and only then if we get a much bigger than normal correction. 2000 wasn’t a bubble in the Dow (it was in the Nasdaq), it was merely a high, followed by a ‘normal’ correction. We may or may not be in a bubble now, more than likely not. Are we overstretched, yes we are, but we don’t need a crash to work that off, time can work just as effectively as price.
Jeremy Granthem defined bubble as price over 2 standard deviation from the mean, so SP500 need to reach 2250 to be a bubble. In order for a bubble to work off over time without crash, price need to stay flat for more than 10 years.
Ref COT AT RECORD LEVELS. I just looked it up for S&P ON BARCHART.COM. They are nowhere near record levels, they are neutral near zero. Big moves can start around zero, but not always.
This does not bode well for stocks, but again, the question is when will price start to reflect it: http://www.ecpofi.com/2014/11/the-money-relation-signals-decreased.html
Why has Abe called elections early, because he know by 2016 he would be out.
Heads call for early election for many reasons, his is because he intends further mess up the Japanese people. Once your in you ARE in.
His popularity is diminishing at a rapid pace, a war mongering wolf in sheep clothing IMHO.
I will look at the odds for him losing in 2 weeks, I fancy a flutter.
http://online.wsj.com/articles/japan-prime-minister-abe-heads-into-election-with-wide-lead-1416804416
another bearish article:
http://www.bloomberg.com/news/2014-11-27/japan-s-inflation-slows-for-third-month-in-challenge-for-kuroda.html
Japan’s 2 year notes go negative for first time:
http://www.bloomberg.com/news/2014-11-28/dollar-set-for-weekly-gain-on-u-s-outperformance-aussie-falls.html
Japan is in perfect positive storm:
http://finance.yahoo.com/news/oil-prices-tumble-opec-refrains-003853644.html
$/Y testing back megaphone on daily around 118.25 – lower 108. Should contain the advance and start a reversal lower. CBs cannot create inflation especially not during Kondratiev winter.
$/Yen at secular tops likes to make 2x, 3x and 4x tops – so far can count 3x tops – shortest topping time has been 10 calendar days – so far 8.
What is going on with the solar flux?

Hindenburg omen will trigger again. Maybe tomorrow, maybe early next week.
Why do you say that?
NYSE has surpassed 50 days ago close. 52 wk highs and lows are both on the rise. McClelean Osc. needs to drop back down. But mostly just a hunch. Market dropped definitively after last omen, so I’m keeping close watch.
450 NYSE stocks are within 10% of 52 wk low.
Hindenburg Omen: Created by James Miekka, the Hindenburg Omen warns of potential weakness in the stock market. There are three criteria to activate the omen. First, NYSE new highs and new lows must both be more than 2.8% of advances plus declines. Second, the NY Composite is above the level it was 50 days ago. Third, the number of new highs cannot be more than double the number of new lows. The activation period is good for 30 days. Once active, a sell signal is triggered when the McClellan Oscillator moves below zero and negated when the McClellan Oscillator moves back above zero.
Another industrial commodity on the verge of break-down unless support here holds. Adds to what we see in crude (global slow-down and China in particular) and would make broad indices suspectible of a correction. 2.90 is the base of a declining triangle with target 1.40 or the 2008/09 lows.
http://finviz.com/futures_charts.ashx?t=HG&p=w1
I am perplexed by the Shanghai stock market. Up 10% in November. Nothing is making any sense. However I believe that commodities are telling the true story.
They cut interest rates in China last Friday.
I know but things are falling apart there. The Shanghi has been rising since June.
Significant rises in Asia.
Some early weakness in Europe.
Energy stocks continuing to sell off.
UST10 y needs to take out 128 horizontal multi year resistance near by. Should support the bear case when this happens.
http://www.insidefutures.com/charts/index.php?sym=ZN&a=M&studies=RSI;MACD
The sell off in crude is not unusual when
viewed from a supply/demand perspective,
it makes perfect sense.
What will be interesting is how it impacts the US
junk market, which has significant exposure to energy.
I am not concerned about the Yen weakening much more against the US Dollar in either price or time. I am concerned about US stocks strengthening in both price and time; therefor, I am looking to exit my stock shorts with a profit, if possible, or to cut my loses short. After I exit my short stocks I will probably add to my long Yen instead of going long stocks so as to get a breather from stocks to reconsider when the top will come in.
You are more likely to be a cutting losses Richard,
unfortunately.
Take this morning as an example, early AM US futures
down and then a slow steady climb towards the open,
and more likely Up we go again.
Dissappointed with myself for not BTFD earlier today. Might get a another chance before the Christmas explosive rally.
Fundstrat’s Tom Lee expects S&P to top at 3,500 to 4,000 in the next 3 years. What a fantastic result for the global economy if that happens. And we could all make serious returns if we position for that. All assuming he is right though. He has been very bullish for the last few years and has been correct so far. I can’t imagine it going that high but maybe 3,000 is achievable. Stocks are overvalued but the smart people realise if you keep buying along with others everyone makes money!
Is deflation a good thing for consumers or a bad thing for the overly debt burdened economies. The US has quit QEing and its deficit is decreasing as the ecomomy is improving somewhat. All of these are restrictive on financials, so why are they flying? Well the rest of the world is QEing with abandon. The wealthy are therefore buying $ to protect themselves from the decline in their currency (strong $) and melting the US financials to the sky. Foreign buyers are usually last to party, so this is normal except for the extreme amplitude. Who would guess that an extremely weak world economy would cause the US stock market to fly? Economics are frequently counterintuitive!
gold drops below 1180 and the miners are being hammered………… sick of this crap really
bloodbath in US energy stocks – doubt the broad markets will hold it together.
ending diagonal line hit in Biotech today – target lower 2200
could be an important turn day – $/Y retesting rising wedge and Biotech making a final top. De-leveraging in the Energy sector steadily eroding overall bullishness.
biotech making final top, how do u no that?
Trin @ 1.7, Dark Pools selling, VXX going up, but seeing a bit of algo buying which might offset dark pool volume.
Algos not able to completely offset dark pool volume hence the slight decline in price, VXX trending up…
Hi John : re algos vs dark pools buying. Not sure whether you saw my request earlier to explain how you know the different sources of the transactions. I would be very interested in getting such information.
Thx.
Hi Purvez, sorry I didn’t see your post! Contact Steve Hammer @ hftalert.com, he will sort you out 🙂
Thx John I’ll have a look at the site over the weekend.
Margin calls in commodities – my thinking is they might need funds to cover those, and anything at all time highs will do the trick here…
Don’t do what I do… I’m short here. Spoos
Thought I would share a 5min chart of the SPX showing a similar pattern developing right now on a daily scale. I am only showing it for its pattern of the mega-phone and what can potentially happen. As I type this the SPX has reached the 2070 which has broken the lower mega-phone trendline.

OPEC declared war on America on Thanksgiving day 2014. Corrupt states versus innovation. Opportunity galore.
Ok, I’m done…. SPY 2070.5 pivot rejected… stop at breakeven. Have a great week-end all and looking forward to John’s next article 🙂
Newt, it may be far more complex that that imv.
Ex energy this suits the US imv, multiple benefits
of lower crude to consumers/corporates, lower cost of
production etc, disposable income levels helped.
And it heavily impacts Russia.
SA need the US on side with the ISIL threat,
so I would look at this in an entirely different way.
I am expecting collateral damages. The OPEC war declaration may be the catalyst that the bears are looking for. Lets see how the US oil complex is going to get organized to fight back. The winners will stand up and inefficient producers will get absorbed at the expenses of the bond holders..and the cost structure get a reset (lower)….so US producers will get even more competitive.
It will take time to sort things out. but no double I will buy the strongest producers remaining, hopefully at a bargain.
My time frame is 20 years.
On SPX, I will send in my scout short again when $NYAD, cumulative goes below 5 EMA.
Lot of confusion right now with oil and gold. Very shaky.
Now Asian markets will react Monday, then Europe.
Is it just me or is it a huge ‘coincidence’, OPEC refused to cut production and announced it when the US is closed for Thanksgiving. BOOM gap down on Friday, half day of trading ……….. gold is only down to 1170 but Junior miners down 12% and larger miners down over 6%……. Silver down like 6% when most people are on holidays in the US. PLEASE DON”T EVEN TRY TO TELL ME MARKETS ARE NOT MANIPULATED. It disgusts how blatant and brazen this whole mess is.
what happened on Russell, hope that’s johns waterfall decline starting. just shows how accurate my pal is at capitulating within a week of the top
my thoughts exactly. a-b-c correction from the top and now the second chance? looks very similar with gdow also.
Offset end of day with minor loss of DOW shorts. Now I will BTFD. I hope John manages his shorts well as he is deeply underwater. Crude just keeps on falling which keeps market players from becoming Pessimistic and feeds their Optimism. Don’t let a small lose become a tragic loss: Cut your loses short and live to trade another day.
Liquidation in the energy complex puts pressure on broad markets. That we are coming from ATH this time makes this short opportunity even the more palatable compared to 2008 and 2011. The outcome will likely be similar. Odds are stacked against a rising market.
$/y unable to eck out a higher high is negative for Bulls. Biotech giving up gains. Friday is a good day for a bubble top. Also holidays make for a great combination. Silver in 2011 put in its final top at 50 on a Friday with Asia ripping it lower by Sunday night. Should be interesting here.
It has begun. Look at IWM. The Russel has flipped.
Lower oil prices are a net positive. (“In fact, during 84% of all the days that crude oil has been in a bear market, the S&P 500 has been in a bull market”. See http://www.advisorperspectives.com/commentaries/rj_111914a.php). Did stocks go up with the oil embargo?
The oil revenue of several OPEC member states is below their expenses. Russia wants to play chicken with oil prices? Fine, the US is not an oil exporter of any significance. Lower prices are a domestic boost to consumer incomes and cost of production. Russia is reliant on energy exports, but they do have substantial reserves to whether the storm. So, who gets hurt the most?
Do you think oil @ $100/barrel is a fair market price based on cost? Saudi Arabia was the oil swing producer and they could control prices. US/NA is now the swing producer and on balance lower prices are preferred.
FWIW, I continue to believe that John’s alternatives of a “bear market in equities” or “this time is different” ignores a third option; that being, the crash is past. 2009 was 1929 and we’re now in a long term bull market. However, I agree we’re overdue for a 10-20% correction. But, I’m not someone that’s nibble or savvy enough to play a counter-trend move.
Richard how do u no john is deeply under?
Hey all, quick post before I log off… dark pools have been buying VXX all week, was more apparent today. Look at smalls and mids today… and crap like GLUU was being thrown out the window… I wouldn’t BTFD up here but that’s just me. Holding my short all week next week… the case is just too compelling for bears right now at least in the short term. Looks like a classic kill all shorts then jam it down kind of job… Also look at Yen pairs especially NZDJPY, EURJPY, USDJPY very, very stretched… hold your shorts 🙂 Have a good week-end gang.
also Biotech daily candle looking bearish to me – with wedge overthrow today
stosh, good points on oil.
Some of the comments here are very wide
of the mark, the US is a net beneficiary
of lower crude prices.
A wider perspective is needed to look at this
accurately imv.
Hi Phil, there is a three part series on Oil from Stratfor. It’s free from them if you’re willing to give them an e-mail address. Otherwise, you should be able to find others who have reprinted the articles on the internet.
Part 1: Lower Oil Prices Carry Geopolitical Consequences
Part 2: When Oil Prices Drop, Some Countries Lose
Part 3: Dropping Oil Prices Benefit Major Consumers
It was written earlier this month and discusses the geopolitics of lower oil prices. IMHO, it’s a timely read given yesterday’s decision.
I hope this provides the wider perspective you desire.
Pegasus,
you can always find metrics that are
bearish, the reverse also applies.
This week we had a virtual meltdown in crude
and yet major equity markets remain unfazed.
Lower volumes can also exacerbate downside
moves, so I do not see lower trading volumes
as an excuse not to sell off.
If we go hard down Monday then I might
have to reconsider.
IWM flipped below reference close today on a combo 13 DeMark sell on Wednesday and if we open lower on Monday then we have confirmed downside.
Sell first, then ask questions. There is plenty of time to wait for the oil Q&A and reaction thereto…then buy or not touching it for the long term.
In the meantime, the catalyst for a 10-20% stock correction is here, next week is the key. A re-set would be nice.
Corporate bond ETF (LQD)…a new closing high. Is this a Bubble? Where is risk? does not matter as long as I am in it.
Just netted 50 grand on miners and oil producers puts. Awesome thanksgiving!
#JustAnotherDay
There are tears in Vancouver, not from laughter. Keep posting Bain, and if possible as you place your trades. LOL
One interesting observation of the day. I remembered gold bugs was yelling out ‘buying opportunity’ ever since 2011 decline, which to this day, I still hear it on a daily basis. Oil on the hand hasn’t had as much participants as gold. I saw news article along the line “Oil stock is the cheapest in 5 years”, “Best 10 oil stocks to buy on the dip”, etc etc… However, the general consensus is that the decline is a sign of a weak economy. It’s debatable I think.
It is clear this washout of oil will be much quicker than gold’s. I do expect some ferocious selling in next few days, the decline will be quick and clean. Do expect some selling pressure on the metals too. Gold and silver will not bottom until you stop hearing about it. If you are still talking about it, it probably hasn’t bottomed yet.
Much appreciated, I will keep an eye on oil stocks for the down side. Heard interesting piece by Thom Calandra on Cambridge House who started Market Watch back in the 1990’s and is pretty well connected. He is firm investor in the miner sector with most of his personal money and thinks tech is an uber bubble akin to the late 90s. The catalyst in his view is that metals will be the energy fuels of the future which could be a way to keep energy expensive and have cleaner air. He esp. likes platinum.
You just proved my points. Metals hasn’t bottomed yet.
There’s so much things to short if you look hard enough. For example, casino stocks, oil stocks, metal stocks. It’s so obvious that it’s easily to dismiss
Nasdaq futures daily… RSI @76, ADX @ 74 (!), declining money flow and last time OBV was this high was 18th of September… and have you seen that spike five minutes before close on all futures – sorry about your stops…
The Race to 0 percent (or here is why stocks don’t fall):
http://finance.yahoo.com/tumblr/blog-the-race-to-0-plunging-yields-across-the-globe-154913319.html
The free-fall in oil is going to disrupt the global economy in unforeseen ways. It is already destroying currencies, which tend to act as dominoes and those who only look at consumers getting $100 a month in “oil QE” are forgetting that 1) oil is also collateral (i.e. its free-fall will disrupt financial markets) and 2) consumers may not spend that extra $100, especially if the global economy weakens. The USD is soaring again, weakening US corp. profits earned overseas. Main point: oil is a financial asset nowadays, it’snot just a commodity. Those not short now may not get much of a chance on Monday….
Really good point Charles about oil as collateral. Tanking oil as stealth QE is not the whole story here… There are people out there who are using energy bonds as collateral for loans which were used to buy equities. That’s going to be a problem. Also people out there in oil facing margin calls will need to get the cash from somewhere to cover those – or simply liquidate. We can try to spin it as stealth QE and a net positive for America, but imagine what kind of impact this is going to have in the energy bond market and equities.
also not to forget the ueber popular MLP sector which will have a fall-out following trend line breaks today. The unusual October weakness in this sector was a warning shot which will get filled with lasting down-side action next week. Especially retail is invested in those MLPs.
http://www.marketwatch.com/investing/stock/AMJ/charts?symb=AMJ&countrycode=US&time=13&startdate=1%2F4%2F1999&enddate=11%2F28%2F2014&freq=1&compidx=none&compind=none&comptemptext=Enter+Symbol%28s%29&comp=none&uf=7168&ma=1&maval=50&lf=1&lf2=4&lf3=0&type=2&size=2&style=1013
There are two American markets that could be in the early days of their tulip phase: Cattle and Stocks.
if $65 in crude oil (2010 low) does not bounce then long term trend line for crude is $48. This line was touched in 1999, 2002 and 2009. Broad equity markets will be a lot lower when crude hits this line as the calendar years of previous line hits indicate. The massive mal investment which took place in the oil patch over the last 10 years from sands to shale will unwind and weigh heavy on broad markets.
The market will defend the price around 60 – 65. A lot of shit starting breaking below $65…
Hmmm…. lots of noise here many of us are just reacting to price and news. I can tell you for a fact that smart money has been dumping shares in the market, this is no BTFD moment. I find that there are lots of comments but mostly you’re mixing fundamentals, expectations and chart reading. This will only mess up your head. I’ve been long since a week ago. I’m now waiting for the trigger to short again. But I can tell you for a fact that smart money has been dumping shares. John the dark pool guy is right. Look at VIX.
sorry should read I’ve been long until last week which I squared and prematurely started shorting but of course was stopped out.
Letus know which info you have that indicates smart money dumping shares. I agree with you, but its just a feel, where is the proof or data?
J
I jegersmart, if I could post charts here I would share with everyone… the selling is very apparent and Trin at 1.7 yesterday… maybe I can send some charts to John?
I shared my method here before but the message was probably drowned out. I use volume spread analysis. I don’t use any indicators. I look at different timeframes, and I look at intermarket correlations. So my proof is volume and price action.
As we’re here discussing (for the most part) whether US stock indexes will go higher or lower, are we missing out on all the golden opportunities that are happening across other asset classes, like currencies, crude oil, wheat, silver and copper to name a few?
So I really don’t understand why some posters are so arrogant about being long S&P, I get more ticks in a day from Euro or Silver or Crude than I get from ES in a week. (I did post the silver trades beforehand on twitter btw but that’s just an occasion as I have a trading group to run on whatsapp, new to twitter not liking it.)
So check egos at the door. As a trader I’m humbled by the market. I don’t have to be right, just have to be on the right side. So no expectation, guesstimation, just observation.
Livingston and Penn paper: “Sunspots may vanish by 2015″.
Abstract: We have observed spectroscopic changes in temperature sensitive molecular lines, in the magnetic splitting of an Fe I line, and in the continuum brightness of over 1000 sunspot umbrae from 1990-2005. All three measurements show consistent trends in which the darkest parts of the sunspot umbra have become warmer (45K per year) and their magnetic field strengths have decreased (77 Gauss per year), independently of the normal 11-year sunspot cycle. A linear extrapolation of these trends suggests that few sunspots will be visible after 2015.
This would be consistent with a Jupiter/Saturn/Neptune conjunction around 1842/43 and an average long term cycle of 172 years based on J/S/N/U. Would point to 2014/2015 as the end of this cycle and the start of a new one. Could indicate a turbulent period that could easily last some years.
I’d really like to share that chart…. for anyone who follows oil… yesterday in XLE, Dark Pools were heavy, heavy buyers as price declined… so anyone interested in frontrunning a bounce in XLE that’s a really, really good signal, good amount of algo buying as well.
Going through charts here… omg… it looks so obvious now… smalls, mids, even the good stuff was being sold hard this week via dark pools while algos were pulling prices up…
John you said that the Dark Pools were selling and the Algos were pulling prices up. In my simple mind both of them represent DEEP pockets ie smart money. So I don’t understand their strategy here.
The only way what you are saying makes sense is if the Dark Pools represent the Banksters (JPM Goldman Sachs et al) and the Algos are the Central Bankers.
That would provide the perfect cover for stealth funding of Banksters.
What are your own thoughts on the Dark Pools vs Algos trading strategies?
Thx for continuing to post.
Regarding posting charts. If you are using a net based service like Stockcharts then just post the link in your comment.
Although I understand and admire the logic of oil being used as collateral to fund long bets in other markets and sectors which might now get disrupted as margin calls forces such an unwind … I do not buy that logic. Oil and energy companies have been in a significant decline since Mon Nov 24 after about one week of consolidation and that is already after a decline that started in early Oct. USA equities have been rising incrementally to ATH since Nov 24.
The oil collateral thesis would have indicated some sort of sell off to have begun occurring by Wed at the latest due to an unwinding carry trade and I do not think prices would have even hit ATH on Fri especially after the overnight “crash” in oil prices.
The only thing going for this thesis is a slight rise in VIX on Fri but unless there is some follow through early next week, how is this “tease” any different from what occurred in the recent Nov 12/13 and Nov 19/20, which were merely blips for yet another BTFD opportunities?
Steve, I enjoy reading your comments. You have done very well calling the swings. Im currently short as of Friday. This is a swing position and am expecting a small pullback before a strong rally into christmas to ATH.
I would again caution anyone looking for more than a blip if shorting this market. We remain in a bull market. There is no evidence we have topped until price begins to move down impulsively, price falls and remains below moving averages.
Concur (fwiw) – For the main US indices, your writing is presently on their wall.
What CBs fear:
http://news.yahoo.com/special-report-why-italys-stay-home-shoppers-terrify-105725287.html
German opposition to ECB QE grows. So what, all it means is more “worry” for stocks to climb:
http://www.businessweek.com/news/2014-11-29/lautenschlaeger-rebuffs-qe-as-germans-step-up-opposition-in-ecb
A larger “wall of worry” being constructed by world CBs for stocks to climb. Collapse in stocks decreasing as CBs point to more QE to come:
http://finance.yahoo.com/news/qe-not-qe-spotlight-ecb-090233190.html
Arab markets Dubia and Qatar down 5% this morning..
Ps, volume much larger than normal,
My best estimate is that we are late cycle,
perhaps very late cycle – in the US this is
likely to peak end of q2/3 2015.
The large falls in commodity prices are in part
due to increased supply, however it also indicates
at least some degree of end demand weakness.
The moves in global bond yields underscores this imv.
In the context of ZIRP with the search for yield,
there remains time for one more powerful upward move
in markets, the recent US reporting season helps supports this.
If you are short here, your best hope is for some loss of
confidence in global growth going forward.
It is very difficult to see this in 2014, however as always price
will confirm.
Phil, (group) how can we correlate the timing of “the” top with Bradley? I recall seeing a post that Bradley has been horrible at calling the turns. (I know, it indicates a turn but not direction; which is pretty useless.)
Does anyone know the details about what is called the “Bradley Long-Term Financial Forecast”?
This module is available in the Sirius astro program, and the company won’t provide the formula; but the findings are disturbing.
I took a natal chart of the NYSE and ran the transits to natal from Jan 1, 1835 to Dec 31, 1835. The results looked like a ‘bell curve’. Research indicates the market topped on April 28, 1835 but the peak of the curve occurred on June 20, 1835.
IOW the market topped early.
Doing the same for the year 1929 showed another big curve, which peaked on October 6, 1929. Again, the market topped early.
Running the same transits for the years 2015 through 2017, shows a peak not occurring until April 10, 2017!!!
I hope someone can make better sense of this? Maybe the program is not designed for users over a certain age. (:-)
I realize this is only but ONE factor; but I like to investigate different paths.
Eclectic,
Not sure if this helps, but here is a link:
http://bradleysiderograph.com/2014-turn-dates-sp500/
Might provide additional lines of inquiry. Like looking at the medium, long, and declination components
SC
Eclectic, I focus mainly on fundamentals rather
than technical indicators, so others here are far
better placed to comment.
Latest narrative is getting sold everywhere….OPEC declaration of war = QE4.
Being used to seeing very high price at the gas pump where I live, I have to say WOW! Price has dropped 35%. I see Prechter’s “Social Mood ” has indeed improved.
Higher stock price begets (mania) higher price in a short term. I see BTFD continues. Shorting must have a very tight stop.
since 2009 oil/ES relationship close to 0.4 or among the highest inter asset class correlations I am aware of.
http://finance.yahoo.com/blogs/talking-numbers/the-surprising-relationship-between-oil-and-stocks-220546670.html
if you believe in higher stock prices short term you should be buying CL hand over fist since the gap between crude and stocks needs to close fast – snap back rally in crude to $85-90 which is not impossible.
Nice open. Still short. Will add more if we get one of those low volume ramps overnight. I would love to add more.
Something nasty transpiring in the Commodity complex – global Wave of deflation
The Swiss gold referendum vote was done and 77% voted against boosting gold reserves. Gold down over $40 in a heart beat at one point.
Bain, congratulation. Santa visited you earlier this year. Good job on the call.
Thanks. It was a risky trade, but it paid off at the end. Probably another 30K profit in the coming days. I am getting married, so this would definitely help me.
Bain congrats on your marriage! what are your targets for silver? 13ish or lower? I have been riding SLV / miner puts for several months now myself.
Thanks.
The cue will come when maximum pain is inflicted on the gold bugs. You are safe to ride the puts till end of the year. More selling to come in next few weeks.
Or not, of course. These markets will eat most short term traders alive in the next few months, as the trends change.
Just buy some physical gold, and wait for the ECB to announce it’s gold QE plans.
Oooh,,, another gold bug
I’m the opposite of a gold bug, just a pragmatic guy trying to navigate this mess for himself and clients.
And physical gold will be used by the ECB eventually to fight deflation. So, a simple decision to hold that asset for a significant price appreciation.
I love fiat currency, perfect for spending and earning.
At times currencies can be risky, but one currency is very different.
Soon we will all realise that.
Ok. I hear that a lot, normally from a gold bug.
Overleverage springs to mind…….please be careful.
J
Pegasus,
I have referenced potential deflation a number
of times, there are multiple indicators.
Even if you discount deflation, it points to slowing
growth and the beginnings of the next major recession.
Let’s see if US futures can stay down, rather than the
usual gradual recovery.
Agree- Abe seems done. Yen pairs and precious metals appear to have put in a firm top/bottom here. Let’s see how equities react.
Silver staging quite a spectacular intraday rally!
Looks like more of the same Pegasus,
US futures positive.
The UK down as it has such a high weighting
to miners and energy.
DAX looking solid even on the latest German data.
UKX that should have read.
Yen to watch important today – fundamentals (Moody’s downgrade) limiting Abenomics and technical patterns – rising wedge break target 114 and rectangle top all point to a major top.
Also wasn’t it September 2011 when the US was downgraded which proved to be a major low/high for $ and gold/yen. Vice versa here should be a major low/high for yen/commodities and stocks.
Pegasus,
Thanks for the insight.
Today’s changes in US house financing will moderate this week’s profit taking and should a good NFP happen this Friday morning then it points to the low late Thursday or early Friday to begin BTFD once again. Also by this Friday will be revised reports of early holiday buying and –expectations– for better holiday buying in the days ahead as gasoline prices continue to decline. Hope will spring eternal this week which means NO FEAR NOR PANIC SELLING expected to occur.
I look for overlapping waves lower this week in US stocks before the next impulse wave to new ATH feed by speculative Sector Rotation out of land.
100 billion more in US consumer’s hands along with Commodity Sector rotation to help feed US Stocks to new ATH and beyond. No Fear or Panic selling anytime soon only profit taking then on to new ATHs.
http://www.bloomberg.com/news/2014-12-01/cheap-commodities-will-drive-u-s-equities-higher-socgen-says.html?cmpid=yhoo
The rating change on Japan changes everything in my view. Watch out below as the Yen gets short covered.
“Buy the rumor and sell the fact”. With 2 year notes going negative last Friday points to not much further selling from that Sector Rotation.
ive posted a few times on my positioning and how the end of QE analogs should lead to a sharp correction 3 weeks after the latest round of QE ended. that put us at thanksgiving week, and i noted that we could drag through that week. so now we’re here and i expect the next three weeks to be down sharply. today is a good start, not only with price action, but the Japan downgrade further enhances the 2011 analog. i initially was tracking a 12% minimum correction, but since the s&p went higher than expected, i’m not tracking a bit higher, in the 15% range. i dont think we see the 18% john was looking for only because the christmas rally may slow things down a bit. that said, we could pick up in january and then hit that 18%. price needs to move now for the analog to hold. it would also be a good time to break the streak of not having 4 down days in a row.
a break in $/Y here puts 117 on the table – support levels 114, 108 and 106
this whole world has become either you are for the dollar or you are against it.
breaking through
battling it out at 118
Good morning everyone. Nice move. Sad I couldn’t add more overnight. Covered 1/3 but still short. That was a huge sell program, 300+ shares at once. Dark pools and algos are getting out of dodge, VXX trending up. Hold your shorts.
AAPL?
airpockets – Brazil tanking
Flash crash?
Price is rising a bit but that would be short taking some of their profits, I don’t see dark pools or algos getting back in right now. Definite change of tone today…
Japanese are repatriating Yen. I agree with Richards analysis. The Moody’s rating change just facilitated this move. Apple and Brazil appear to be among the more popular targets of the carry trade which appear to be unwinding.
Hi John, probably I missed this piece. I would kindly ask you from where do you get the dataflow of dark pools and algos in realtime ? Cheers,joseph
Watch out dark pools selling into those lows – probably retest the lows in the next few minutes.
Forgot to link my GEM update tweeted last night. “Spiral contracting to 12/7 = market “heavy”. Low expected later this week. GEM hourly update through 12/1 16:00″ https://twitter.com/mjmateer/status/539214119724146688
Hi Peggy, you are following the Spiral longtime now. Do you feel comftable in following the trend and is it more right then wrong in the direction of times ?
yes. For me, the longer trend (Spiral Expansion/Contraction) is for swing trades. I use the shorter trend (Spiral through the quadrants) for intraday trades. Specifically, the Spiral passing through corners or “triple clicks”. For example, the Spiral is passing through Quadrant 2 corner today from 11/30 23:00 to 12/1 14:00. This is a volatile time period. Next opportunity is the “triple clicks” 12/1 22:00 to 12/2 13:00.
To give you more context, the Spiral stopped expanding on 11/28 and is contracting until 12/7. I’m expecting a low @ 2038 by Friday.
Here we go, VXX trending up, heading towards those lows again… dark pools selling into lows is never good!
Bonds are painting an ugly picture for later half 2015
growth prospects, would not ignore that on a longer
term view.
are we seeing a disconnect here, what is bad for japan may actually take yen down?
Rating down grades are usually lagging indicators ie they come towards the end of a move. Examples 2011 for the U.S. A G3 rating downgrade ( global safe haven status) is very rare (US, Germany, Japan) and the market will take seriously in looking the other way (break of trend)
$NYHL at -216 (Histogram) says correction. Lets see how long it stays red. This is good for both shorts and longs.
EOD $NYADV (695 issues); $NYDEC (2423 iisues)= 1: 3.486.
$SPX finally below its 5 EMA. Correction begins.
Watch out trying to reverse up. Look at AAPL, VXX down…
Precious metals has to be the craziest volatile sector. From what looked like an imminent overnight collapse to retest critical $1142 level it somehow found support and gone ballistic this morning and currently above $1215 … all within 24 hours!
We had a 17,500$ move per silver contract!!!!! First 6,000$ down then 11,000$ UP.
All specs got smoked, both bulls and bears. No one can survive this type of moves unless they have very deep pockets.
This is like playing with dynamite! It will rip your head off.
I will not be surprised to wake up tomorrow with all gains erased and under 1140$/Oz gold!
Crazy!
Weird thing is that gold and silver prices today are now higher than the high for the entire month of Nov. Oil prices are lower than in Nov which bodes well for the mining industry. Yet GDX and HUI are not making higher highs today relative to last week’s high … negative divergence.
So your thinking may not be that crazy.
yes, miners are lagging. Volatility has exploded as expected though, now we shall see if there is a follow DOWN or UP.
Technically, so far metal complex has been making lower lows and lower highs – definition of a bear market.
Low oil should be good for miners expenses, you would think, but there are many more factors at play.. Remember when big miners started to remove hedges when they were so sure that prices were set to continue much higher for years? Did not work out that well for them and im sure it hurt(/s still).
Not to brag but I got 1240 ticks in two days. Two contracts, that’s 2480 ticks. If you know what to look for you can catch both the crash down and up beforehand. Someone from my group took 20 contracts. Sure has deep pocket and likely insane. But he played it down one way not up.
The crash in PMs on Friday screamed manipulation to me. Honestly, who would sell, sell, sell into such thin liquidity? Someone who doesn’t mind losing millions in order to smash the price down. Once “normal” trading picked up again today the losses were recovered.
I feel like a moonbat talking about manipulation but these sorts of maneuvers fly in the face of game theory.
I’ve reached the point where no amount of technical or fundamental analysis makes sense or provides direction.
So I’m only going to rely on PRICE!! I trade the DJIA and each day I intend to draw a line in the ‘sand’ and define a pivot point around which I will trade. I am a die hard Elliott Waver so I micro count the waves. If I get a micro count of 5 or 3 which I think is tradeable then I intend to trade it BUT keeping mindful of my pivot point.
If my 5 or 3 count takes me across the PIVOT then I’ll abandon the trade.
I can’t think of ANY OTHER way to trade this MESS.
If anyone here has alternative thoughts then please DO LET ME KNOW.
Thanks
The problem is if you don’t know your bigger trend then your impulsive price action might just be a corrective impulse. Once stuck you will be riding these so called short term trades as long term losses.
you are correct. We must identify the bigger trend and trade with it. Right now that is up for grabs. We just saw a 5 legger down so is it a wave 1 of a new trend down or is it a “c” of wave 4 and SP is about to finish a wave 5 up? We did see some short near term supports come out suggesting the trend may in fact be turning down, but we really need to see a second 5 legger down or a violation of 2034.48 ( or at least 2039.68 spx) to be sure the 2077 high ended the bull. The action off todays low ( the bounce) is more in line with a correction at this time. If this action remains corrective, it suggest we will soon see lower lows. Lower lows “could” do more serious damage to the chart support levels.
http://tfaat.blogspot.ca/2014/12/1-dec-2014-st-down-trend.html
MP / GN I’ve been trying to count waves from MICRO all the way through to multi year and I can ONLY SEE 3 wavers everywhere.
Those are HARD TO IMPOSSIBLE to trade so hence my new strategy.
Thanks very much for responding to my comment and I’ll happily listen to alternative arguments further.
I try to concentrate more on figuring out the major trend first, then look for impulsive or corrective patterns rather than get to fixated on the counts as the counts change like ex-wives..
So far todays down move is considered a correction until the major trend changes to the downside. With the triangulating pattern today, only two options come to mind…
One or two days of price work might clear up the muddy water and give us a clear trend we can trade with confidence.
The pattern got muddy advancing higher from the 2034.48 low on 11/17. The 2077 high could have been iii:5 then iv of 5 pull back to 2056.81. What happens after that is anyone’s guess. But, the way it is selling off we have to entertain the possibility of a 5th wave failure last Fri. Since then the down legs have been 5 leggers and the rallies have been 3 leggers. This is considered a bearish behavior. But one day doesn’t make a trend, as they say. The SPX must maintain this behavior for another few days ( and take out some important supports) to be a believable bear trend.
Also, it appears much of today was spent creating an abcde triangle. Some might call it a bear flag.
A good chance we will see another impulse down leg tomorrow. A wave 5 maybe? I shorted on the 2059ish spx high, figuring it was c:4. Still short looking for an impulse down tomorrow.
Just wanted to share this…..
Click to access pe3.pdf
Every couple of weeks a Bob Hoye update appears at Biwii, it’s worth looking out for, has been spot on in the past year, and very knowledgeable about historical precedents.
Might help provide clarity.
GM Thanks very much for sharing that. It was very interesting and I’ve made a note of it for the future.
Hi all, before I log off… algos and dark pools buying, VXX down in the past hour, I think we go back up a little bit in the last half hour. Probably a low vol ramp overnight, I would short/add from there. Have a great evening all.
Golden Nugget – Nice to see you posting here. Got wind of this site from someone at Daneric’s.
Here is my Swing Trend Indicator results for the year 2014, should keep you with the trend. My EW counts are based of this indicator.
http://unbiasedswingtrades.blogspot.com/2014/12/swing-trend-indicator-timing-for-2014.html
thanks. SPX appears to be working a bear flag for now ( wave 4) so next leg should be to the down side.
Just checking in…
No change to my trading system – still holding 100% short….
The recent weakness in the HY area has taken the daily system reading back down to strongly bearish, but no change in the “trade” signal…
RSI is rolling over on most of the general SM charts I look at, and money-flow still shows money leaving the market – been like that for about three weeks now…
And HYG and JNK both closed today, just lower than their lowest closing price from back in October… They went Ex-dividend today, so it’s not a direct comparison, but still, can’t be ignored…..
Anyway, just holding short, and seeing nothing to want me to change my thoughts there… Good luck…
The West lowering oil price to bring down Russia? The West will lose vs Putin.
http://www.goldstockbull.com/articles/grandmaster-putins-golden-trap/
Master Putin was not able to electrify Syberian towns despite of huge bubble on commodities that gave Russia billions of petrodollars. He will use gold to buy food because nobody will sell it for worthless ruble soon. 100 years ago Russia could feed the world, today thanks to Putin and his KGB friends they can’t feed even themselves. However they are still number one in propaganda.
(sorry for my English)
Being number one in propaganda is no mean feat in the world today.
As to number one in propaganda, I always thought that 100 years ago Bolsheviks financed by the West destroyed Russia, not Putin.
Yes, West also financed Adolf H. But you linked article where Putin is viewed as a grandmaster. Come on – he had a chance to make Russians modern society but instead he tried to rebuild typical Russian empire: corrupted, with whole wealthy concentrated in hands of oligarchy and based on voilence and propaganda. Country is managed by people from secret service who know how to kill or lie, but have no idea how to make life of typical Russian better. Results? The biggest number of alcoholics, narcomans, abortions per habitant, and the endless fear of Russia neighbours of being invaded.
This article is a proof that their (him and his KGB friends) propaganda is still the best – such poor and corrupted country can fool ten times bigger West. In fact he is fighting for his life.
Come on. ‘Modern society’….you mean something like in the US? ‘Corrupted with weatth concentrated in the hands of few’ – are you talking about the US again? ‘Violence and propaganda’….who is financing today Ukrainian Nazis known as ‘Banderovci’, their genocide and rape in Eastern Ukraine, while calling it a struggle for freedom? Russia is managed by people who care about Russia, therefore they are the enemy, as much as Gaddafi was. Victor Orban cares about Hungary – therefore EU and US are trying to implement sanctions and orchestrate another colored revolution.
Actually it is funny to hear Putin is a bad leader, because Putin’s approval rate in Russia is 87%. While Obama has only 23% aproval rate. F. Hollande – 13%. A. Merkel 74%.
Is the story about American invadors scared in the Black Sea a propaganda as well?
Did you hear that in the mainstream news? Why NOT????
http://www.voltairenet.org/article185860.html
87% is so much real as 101% support in Crimea 🙂 Yes – all this terms (corruption, voilence, propaganda) you can assign to USA but only those who lived in a country rulled/occupied by Russians know the difference. However, brain washed simple Russians really support Putin like probably most North Koreans support Kim. They believe his genius because they live better than 20 years ago, but don’t know that it’s only thanks to 1000% rise of oil prices.
Banderovci gained 3 or 5% in free elections. Most of the Ukrainians (and Russians too) want to live like Western people not like Russians. That’s the reason why it’s so easy to finance a rebel there – a lot of volonteers who have nothing to loose in their country.
We will see in next 2-5 years who wins this game – master Putin or the West. I understand your pain when bankers print trillions of dollars to save their power but look on it as a trader: compare the productivity, quality of life, personal freedoms. Read some other sources than “independent” financed by Moscow. Good view on KGB tricks bring Viktor Suvorov’s books.
Also those naive Eastern folks dreaming about the West do not know what the West is really about. I lived in both camps and I chose the East. ANYWAY, only because some people want to live their lives and love their leaders is not the reason for anyone to bring them ‘civilisation’, democracy’, ‘progress’ while it’s all about conquest, debt slavery and natural resources. Russia is a sovereign country so if anyone outside Russia thinks it’s OK to interfere, only because TV says so… Fortunately this time agent orange won’t work – if the US attack Russia, say goodbye to New York and Washington 🙂
It’s not the first time I say the West will lose vs Putin. Any potential global military conflict will go out of control and the US will not survive.
Thanks all, new post is out