

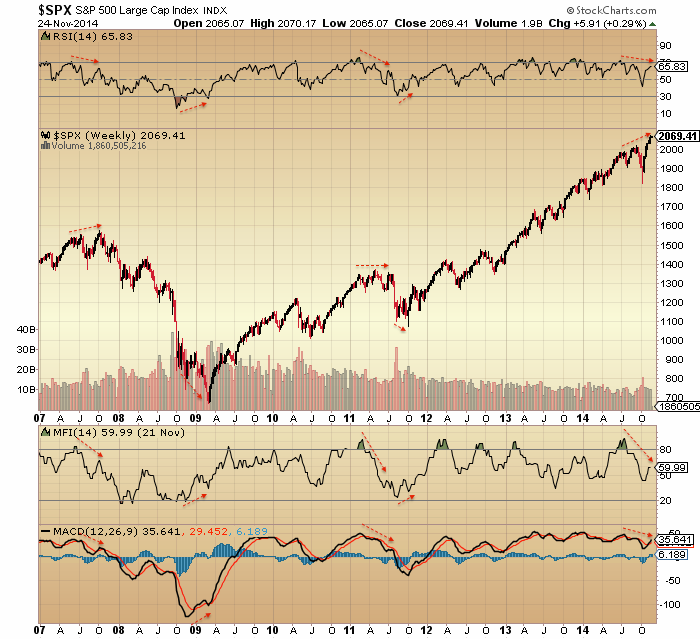
Take a step back and the topping process since the start of July can be seen in RSI, money flow and MACD divergences:
 Source: Stockcharts
The same divergence processes in 2007 and 2011 lasted around 5 months. From the start of July 2014 that would equate to a final peak around now.
We also see the same NAAIM manager exposure divergence as the 2007 and 2011 peaks:
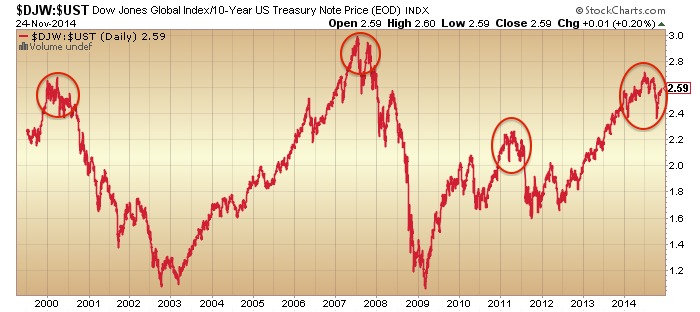
 Plus we see a topping process more clearly in the relative performance of stocks to bonds:
Junk bonds double topped in July and September and are now divergent to equities, and previous divergences were leading indicators of where stocks were headed next:

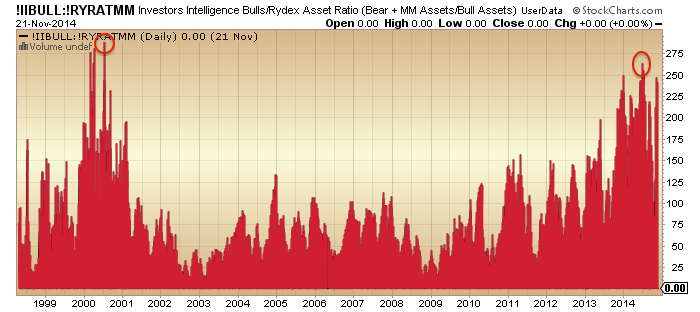
We see peak mania at the inverted geomagnetic seasonal mid-year peak closest to the smoothed solar maximum peak, via sentiment and allocations, just like at the last solar peak in 2000:

The sunspots chart shows the waning since around April 2014, putting stocks on borrowed time.
Offsetting the October-November rally in equities, we see gold and miners advancing and treasuries too, with the yield curve flattening further (equivalent to inversion under ZIRP):

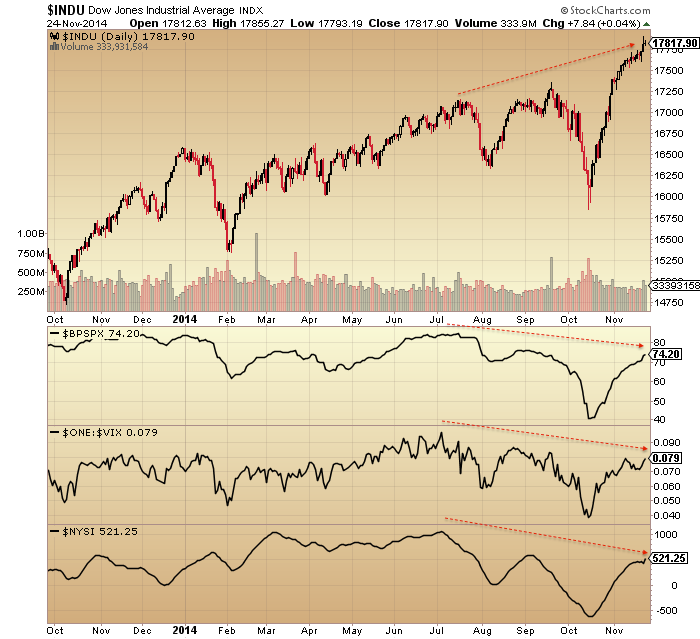
Plus we see various divergences in place since the turn of July contrasting with price, including bullish percent, volatility and breadth:
A peak across the pond at the Dax reveals a similar topping process in place as measured by true strength and breadth indicators:

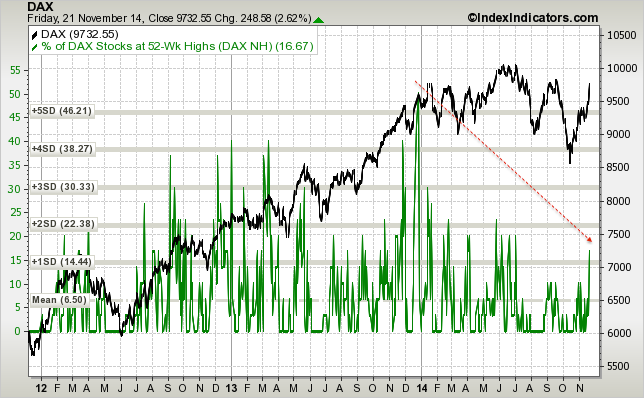
Source: IndexIndicators
To sum up, there is a ‘normal’ topping process occurring behind the scenes, yet most are oblivious. If your arguments are either that indicators don’t work any more or that central banks’ actions trump all, then history is not on your side. I’m no permabear, rather the evidence is far too compelling to be anything other than bearish on equities here. This remains a truly golden opportunity for ‘reverse value investing’ yet right now appears to be the point at which the least number of participants can see it.
If it seems like price can only go up and that all weakness is bought, then recall just a few weeks ago the situation was similar but in mid-Sept suddenly bears took control with several engulfing down days. The evidence above reveals this is going to happen again, and argues that this time will be definitive. The key point is that behind the scenes and cross-asset we can see that things clearly changed as of the turn of July and that this latest leg up in price is part of a topping process not a bull market trend. It’s just about the timing for capturing what should be the final peak.
Skew is back elevated like mid-Sept or mid-July, the last two times the market rolled over:
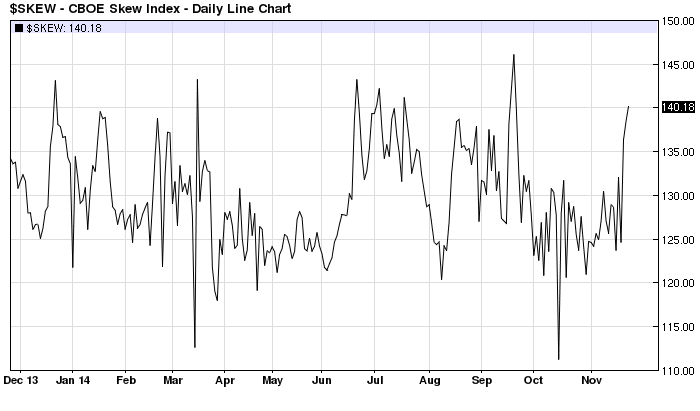 Source: Barcharts
We can add to that recent readings in ISEE put/call and Nymo for evidence a roll over is imminent.
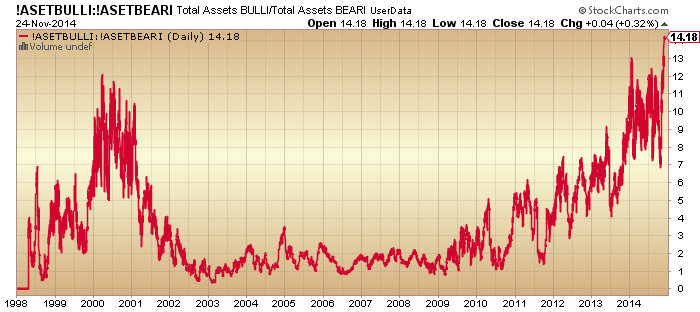
Allocations look truly exhausted:
We are heading into the negative lunar period this week, and the real geomagnetic trend remains down:

 I am looking for the leading stock and leading index to roll over to cement the trend change, namely Apple and the NDX. Microsoft, the other main driver, has now broken, leaving Apple left to pop its parabolic.

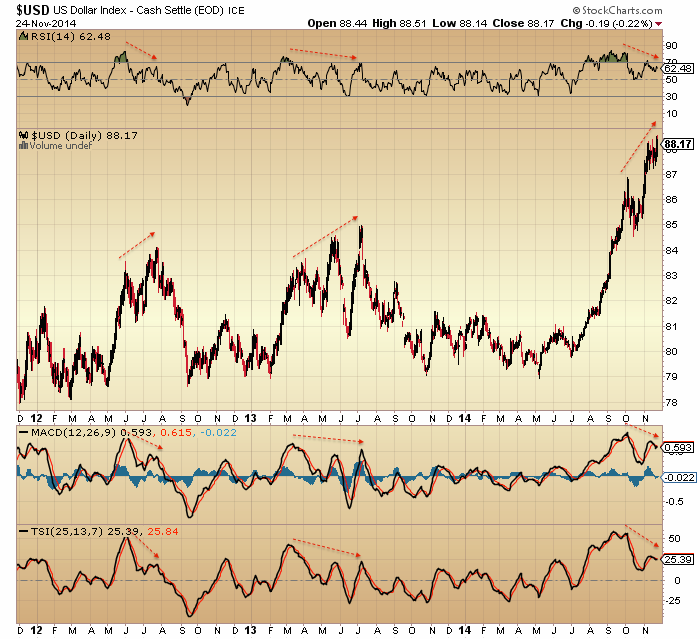
And for the US dollar to break too. It shows the same negative divergences that marked previous peaks:
I believe gold has bottomed in line with October 2000, and that the break in both the USD and equities will send it soaring.

Interesting thoughts John.What you say will transpire and this time with a lot more intensity on the downside but i guess it might be a few more weeks before that pans out.Possibly end DEC or early Jan next year.SnP likely to move towards 2130-2150 before a PLUNGE starts..
Guess you know my argument. Solar activity long term down. Gravity cycle long term still up. Turn window open and will close in February 2015. So anything can happen now. But time is running out and it will be weeks, not months.
Cheers,
André
The center of mass of the universe is moving in and out of the sun due to Jupiter and Saturn. The sun’s motion makes an 178,7 year cycle around this center of mass, made by 9 Jupiter cycles (19.9 years.). Within this 178.7 year we find 16 11 year solar cycles. There is a slight variation of 1 year on the 176. Seems last time this cycle turned was 1837. This gives us 2015/2016 for a major event in solar activity. Should be an interesting once in a lifetime event 😉
Sould be : of our Galaxy.
In 2020 we have a heliocentric conjunction of Saturn and Jupiter; pulling the center of mass as far from the sun as possible and thus creating a ‘center of mass inversion’.
Could this be the start of the new bull market?
Thanks as always Andre’, your posts are entertaining and informative.
Andre,
I know your looking for a low ~12.15. May I ask what comes next? Specifically I am focused on the 12.26 period as important and was curious if your work supports that as a high or low.
Thanks.
thanks for that heads up! and yes, the question is: will 2020 mark a high or a low in the stock market?
The way I see it the long term solar activity is down. So gravity has to do it all alone. We haven’t seen this situation for over a decade. Especially the gap in timing between two forces is extreme. Regular timing on gravity gives December. An Inversion could push that forwards for 2 more months. But the long term gravity cycle is almost done. So this is a tricky situation for forecasting.
December 26 we have a heliocentric Bradley. And we have the new moon on dec 22 with perigee on dec 24. This should give us a high. Therefore I still think we make a low before that. 15-17 December seems likely: a double spiral date on 17, moon conjunct the node on 16, the node turning direct on 14, solar activity extreme on 15 and heliocentric mercury max south declination and turning on 16.
But again; the next few weeks may get very tricky as the ice is getting very thin.
Hope this helps.
André
Thanks. Appreciate it
“I believe gold has bottomed in line with October 2000, and that the break in both the USD and equities will send it soaring”
Couldn’t agree more. Back 99/2000 when I was buying gold stocks I was literally laughed at. Those that have the guts to buy now will make a killing in the years ahead. Many solid juniors will rise 30-40 X current levels.
There has from my recollection never ever been a bigger and better contrarian play than what gold and gold stocks represent now.
Cheers
Exactly!
John, great observations and I admire your analysis as always. But sometimes we have to respect that price is price, even in the face of persistent divergence. Today is realistically the last day of the week where we may see a material increase of volatility, but futures are crawling up again. Should we move up again, i think we have to concede a further squeeze into end-of-month and a positive November close. Either case, beginning of December we should see some kind of a pullback, but the real deal won’t likely happen until 2015.
That said, I expect gold, silver and bonds to move up regardless of the direction of stocks, and so diversification certainly helps instead of putting all eggs in one basket (shorting US stocks)
I do not think CB action (ultimately) trumps all
or this time it’s different.
My central view is to kill this bull market
the perception has to be the US business
cycle is about to turn, that is the missing link imv.
The DAX is rapidly approaching a new ATH,
unless markets reverse this week.
Any reversal now is likely to be short and
mild and I would be exceptionally careful about
adding to short positions unless clear downside
momentum is established – unlikely without an
outlier event.
As markets rapidly reversed from October lows
they have taken out double tops, megaphone topping
patterns, what appears to be left is a decisive break out
on US markets.
Appreciate that this is not want many either expected or
may want, however is price action really
indicating something else at these levels?.
Thanks for another great piece, John. DAX future contract is testing its 19th Sep around 9,900 right now. If it breaks through that resistance it can reach its summer top of 10,000 quite quickly. I am short in U.S. indexes since yesterday but if DAX moves through 9,900 I will immediately cover. If U.S. opens with another upside gap today I am afraid of VIX potentially breaking down its trendline.
That would mean more strength until January.
It’s quite clear that the ECB has one aim and ONE aim only. And that is to drive the German market higher.
Draghi’s announcement last week was targeted specifically at the stock markets by stating that they were prepared to “intervene” directly to drive stock prices higher.
ECB QE has nothing whatsoever to do with increasing lending amd stimulating growth. European banks can already borrow as much money as they want at .05% and could loan it out at substantial returns, but it just ain’t happening.
So ECB QE will NOT increase bank lending because there is no requirement for it and WILL NOT drive base line inflation higher.
Central Bankers know the only line between the global economy and outright collapse in confidence and as such full blown deflation, is the stock market.
And I have no doubt they mean business, the problem is that driving stocks prices higher goes hand in hand with human psychology. It only take confidence to break and it’s game over……..
That’s where John’s waning SC comes in.
Allan, as far as the ECB are concerned, rest assured they don’t care about anything but price stability. Please ask one of the millions of unemployed youths in Southern Europe what the ECB has done in terms of intervention, and they will answer ‘not much’.
If you apply your views of the other central banks to the ECB you will be perpetually surprised, not least when they QE into physical gold. Gold is the only asset that can prevent deflation in the Eurozone, as gold, unlike other assets, can be bid to any price level to soak up Euros without creating a bubble that has dangerous side effects.
There is widespread opposition developing in Europe to ECB unleashing QE.
Let’s all face it, QE and ZIRP did not work. All it did was benefit large institutions and drive asset prices higher whilst punishing savers and retirees.
There has been absolutely ZERO trickle down effect.
Wages remain depressed, businesses are not investing, organic growth has all but disappeared. The US Govenment makes up for a large chunk of US GDP, without which the US would likely be in full blown recession already.
In fact if anything QE and ZIRP has negatively impacted the global economy by encouraging inefficiency, complacency, laziness, risk taking, greed, encourages less free thinking and so I could go on.
There has not been a recession in Australia since 1991. Yes we sidestepped the GFC totally. That means that anyone under the age of about 40 have never experienced what it is like to do it a bit hard. I know for a fact that most under 45’s are deep in debt, many up to their eyeballs, understandable given the average Sydney house price is over $800k. They have, through no fault of their own, become ultra complacent and will likely lack the skills required to cope when the next recession does come.
They are the victim of an experiment that was thrust upon us to save the .1-1% of the world that were responsible for the mess in the first place. The intention was never to benefit the masses but to bail out the few.
I really fear for this nation in the years ahead. Not least of which because our so called leader is a complete lying through his teeth, IDIOT. In that regard I doubt we are alone.
Cheers all.
Im from Sydney too Allan, couldn’t agree more with what uve said…….. and gold has just been thrown down from the 1200 level again, because US GDP numbers are ‘better than expected”.
NO wonder miners have not been making ground for the past week or more.
Thanks guys. Concur re Vix, and similar for certain indices and indicators: stocks need to turn down without delay to not reset the topping process to some degree. Hence I think it should happen.
Here’s another angle. Stocks topped out with a price thrust like this before:
2000: 17% in 23 days
2007: 15% in 39 days
2010: 16% in 55 days
Oct-now 2014: 14% in 29 days
So not disimilar. Room for a little bit higher and a little bit longer but generally in the window, which fits with the post above.
What were the dates in 2010?
Have added a pic below
Number of warnings on LSE listed companies
continues to gather pace.
Companies with the UK as their main market still
churning out increasing earnings, however that
dramatically alters on large Eurozone exposure.
KGF which I have mentioned a couple of times
issued another weak statement this morning.
I follow this company as it’s usually a good read on
the Euro area.
There appears to be a growing slowdown in the Far East
and Allen has mentioned Australia as a
reflection of this, I would agree with that view.
It’s just a case of how deep this slowdown becomes and
if Japan is leading the way, that should become clear during
Q1/2 2015.
If you are uber bullish it’s temporary and will reverse.
Phil, the ASX is, as I said last week, the truth teller. It is not subject to the same degree of manipulation and intervention as other major global indices and flies stealth much more readily.
More weakness today, not seen on this chart, as it was repelled by the 50 dma.
The weekly and monthly are in bad shape as well.
http://stockcharts.com/h-sc/ui?s=$AORD&p=D&b=5&g=0&id=p41587917248
And let’s not forget good ‘ol Dr Copper
http://stockcharts.com/h-sc/ui?s=$COPPER&p=D&b=5&g=0&id=p51920209641
You want to see how QE has helped the masses?……..this more than anything else puts it into perspective……
http://dadaviz.com/i/1070
Market energies suggest that an important top could be posted as early as 28 November-5 December. Breakdown below 20 daily EMA should define the size of the bounce and the short term trend into the 15-22nd December. At this stage those that are long should look at liquidating, its been a good ride. Cheers
http://tradingtweets.wordpress.com/2014/11/22/2-5-december-high/comment-page-1/#comment-183
Allan
QE has worked just as intended I believe. If you think QE was and is being done for the benefit of the “people” then you need to re-evaluate imho. No offence intended.
J
js, that is exactly what I meant. I prob should have added the SARC
Careful today on the US markets!GDP due out along with consumer con and well as home price index.
Ps agree QE only works for 1% of the worlds population.
Not just ANY 1% but THE 1%. Lol
GEM hourly forecast 11/15 9 am to 4 pm est. https://twitter.com/mjmateer
Those topping thrusts compared:
This could be a good test: If we still stay below Friday’s high after the revised (upwards) GDP figure then I think the ‘turn’ has arrived.
Sorry should have mentioned that I was only considering the DJIA. the S&P futures have already gone above Friday’s high.
Agree
Good charts. Yesterday tied the record number of daily closes of the S+P 500 above its 5 day moving average which is 27 days set back in 1986.
Oops again, I meant consecutive daily closes. See yesterday’s link for the source of that information which includes this November being a record number of monthly consecutive closes about its 5 month ma too.
GDP 3.9%____ 3.3% est
Aaron, clear momentum remains in domestic US,
which is why an ultimate top in December/January
is unlikely on my take.
Shiller home price came in at 4.9% —-4.4% est
Yep I have to agree with you Phil top looking more like into 2015.
Concerning today’s American economic reports it could be a “buy the rumor and sell the news” event.
Looking forward; the fourth and first quarters now look to have reduced GDPs and possible negative like the first quarter of 2014. If the market is forward looking then this could be a “sell the news” event and the “top” is in. Let’s see if the S+P 500 –closes– beneath its 5 day ma today.
Consumer confidence out in less than a hour, will it be a hat trick and that beats estimates too?
Interest rates have got to rise soon.
john, here is a interesting chart. http://www.ecpofi.com/2014/11/bubble-chart-of-day-will-this-ratio.html
I would say if QE did not end, we could have seen that 2000 peak, but as you can see it started to hit a bump January 1st of this year, just like every other indicator. Every indicator besides stock prices has hit that warning sign bump January 1st of this year.
I am reposting this link from yesterday as the chart on this link should be compared with the chart on your link. The two charts together are very powerful and telling.
Oops:
http://finance.yahoo.com/tumblr/photoset-u-s-stocks-are-2nd-most-overbought-in-history-195753113.html
Two good charts, thanks
Aaron
What you may want to factor in is likely 2015
slowing US growth on weaker international
markets, coupled with a stronger $ impacting
many of the big US overseas earners.
It would not surprise me if there was no US rate rise
through 2015, or at most one increase.
rates will rise 2097. organic growth left the station years ago. See Japan.
Thanks John: Great analysis again. To align with history, the stock market should roll over *soon*. To add to your perspective and analysis, the credit spread is also signaling top: http://goo.gl/CkGT9J
Great chart thanks
John,
I think you have already read this but to be sure this is a very could link that explains everything about all the technical indicators that don’t seem to work
I lost a lot because I also was convinced that the market would tumble again shortly after okt 15..
But I believe the CB’s and what ever is behind first want to suck up all the money before they will leave this game..
Untill now Mahendra is right again with his advise to buy SP500 at 1820 and hold on he predicts this rally will go on till spring 2015 and the end will be arround sept 2016..when the CB’s will lose controll and we will have a crash but first we will see a bubble not ever seen before..
I still hope you are right John ..
All the best…
http://www.zerohedge.com/news/2014-11-22/veteran-sp-futures-trader-i-am-100-confident-central-banks-are-buying-sp-futures
nice decline in margin debt in october, as to be expected
nice catch Rob, thanks
But November may show new all time high.
Energy (oil) index is going bonkers. Nothing else.
If xle stocks are propping up the market right now, it’s all over.
At the mid day of the US markets both Copper and the Australian Dollar have broken down hard to new multi-year lows and yes I did say years and not months or days. Should these both stay down then the odds are greatly increasing that not only are the highs of stocks in but that the S+P 500 will sell off late today to close beneath its 5 day ma thereby not setting a new record of consecutive closes above its 5 day ma of 28 days.
Iron ore prices fell to new five year lows today which is another reason the Australian Dollar is falling to new multi year lows as well as Copper:
http://www.bloomberg.com/news/2014-11-25/iron-ore-drops-below-70-for-first-time-since-09-as-glut-widens.html
So far there is a divergence between the S&P and the DJIA. The former made a new ATH in the futures on the GDP news but the latter went …. mehh!!
Short squeeze after squeeze after squeeze after squeeze. Just need a few days without optimistic statements and positive lagging indicators.
Bonds dropping relatively hard last 5 days
Can a stock market top occur now?
Recent history suggests March and October as the ideal months.
IF gold bottomed this month then I can see March as the mkt top. Last gold secular bull, lead(gold bottom)/lag(market top) was 4 months.
US Farm income to decline 21% on crops:
http://www.bloomberg.com/news/2014-11-25/u-s-farm-income-forecast-to-fall-21-from-2013-on-crop-prices.html
Thanks John. good work.
From a chart/pattern perspective, the pattern has now moved a bit deeper into the final wave 5. The 1,2,3, & 4 up from 1820 low appears to be etched in stone. And we are now within the final wave 5 up, the best fit is that we have already seen i:5, ii:5, and iii:5. There is also a “chance” the iv:5 was completed at 2056.81 spx. Or that was the a:iv:5. So we either get one more dip down to complete iv:5 or iv:5 is complete. If it is complete, (60-40) chance, then the SPX is in the final bullish v:5 leg up. For those not familiar with this type of patterns, it means the SP may need to make one more dip to 2050 area to complete w4, then we get wave 5 up to new highs. Or, the w4 is already complete and SPX is currently in the final wave 5 up. If the wave 4 is complete, this final wave 5 up wouldn’t last more than a few days tops. But this holiday and low volume could cause it to stretch out beyond what is normal. In other words, if not for the holiday, we would definitely expect this last leg to end by Thurs./Fri. The pattern also allows for a new high in the wave 5. The wave 5 could unfold as a failure, but, bullish 5th failures have been rare the last few years.
In other words, don’t be surprised if we see one more new high in the SPX. And if we do see it, the pattern says it will likely be the last high for many weeks, months, and possibly years to come.
The previous 2022 high was not as likely to be the end because the end is almost always marked by a 3 legger overlapping pattern down just prior to the last high. The 1820 low was exactly that. An abc wave 4 down. That means this next high may be a high of major significance. And if not for the low volume holiday week, we might have seen it by Wed./Thurs. of this week.
The support that trips a sell signal for this pattern is 2039.68 SPX. When we get a close below 2039.68, this particular bull leg should be considered done. Some people may favor the next lower level at 2034.48spx just to be on the safe side.
Today’s hard sell off in Iron Ore, Copper, Crude, and the Australian Dollar is not because of over supply. It is because Demand is falling much faster than producers can or will cut back on production. Producers are showing how desperate they, and others really are, by not cutting back on production with such huge world wide declines in demand. These are powerful signs of a world wide economic implosion already underway.
T-Bond futures just soared. Well of coarse they did as the heavy industrial commodities; Iron Ore, Copper, and Crude; are falling fast and hard. That T-bond futures are up so sharply and stocks have yet to sell off means nothing. Just wait and see what soon happens to US Stocks.
The odds are growing rapidly that the “top” in US stocks has come in.
As I mentioned i am now in the bull camp , only temporarily. As they say “a bull market is like sex. It feels best just before it ends”. It’s realistic we get to 20k dow , 5k+ nas, and other blowoff manias like apple $1 trillion mkt cap. Im decided on the split accumulation of index calls and gold/silver miners. Place your bets.
i guess i’m not the only one.
I thought that Friday 9/19/14 was the top. It wasn’t. Did have a sell off though.
Friday 11/21/14 looks like an even bigger top. Maybe that was it.
Bonds think so, margin debt declining, participation waning, maybe even AAPL reversing, who knows.
this guy follows Lindsay and says 11/22 would work as a top.
http://www.safehaven.com/article/35924/the-flux-capacitor-forecast
looks good to me
HI All
New margin debt data out.
To me this doesn’t look like a top; this looks like spring 1999 or fall 2006.
Will
I just went long SPY as Weds. before Txs is one of best of year. Also tomorrow until 12/2 historically is one of the highest prob. bullish trades of the year. It is when most shopping is done the whole year and wealth effect from stock values contribute to the amount people put on their credit cards. Declination is moving up and apogee(usually weaker time of month) is two weeks away but new moon bullish period just ending and this usually has a three day slump. For this short term trade, seasonals and declination are positive; lunar cycle is negative. The dice have left my hand.
It looks like the ducks are lined up in a row. I think that only one market needs to be watched for confirmation that the “top” in US stocks is in and that is the Yen. Should the Yen rally strongly then the odds are great that the Carry Trade has reversed in a very big way.
The Yen daily MACD in on the verge of a buy signal which will likely happen tomorrow. In addition to that the weekly and monthly MACD are making diverges which if so mean a very big rally to come just like stocks are diverging implying a very great fall to come. With the industrial commodities selling off hard today all that is needed to confirm that a major world wide downturn is happening is for the Yen Carry Trade to reverse all on its own because there is no where to invest; and, the prior loans need to be paid off regardless of BOJ interest rate policies. In fact, without rising Japanese interest rates a sharply rising Yen is an even better indicator of the reversal of the Carry Trade, thus, assists around the world are being sold off due to a major world wide economic implosion.
The last time (10/01/2014) that the daily MACD of the Yen gave a buy signal the Yen rallied to its 50 day simple moving average. It would be a good idea to take a look at the Yen with its 50 day ma and its 200 day/40 week ma. It looks very over sold and if this rally goes beyond its 50 day ma to its 200 day/40 week ma then the profit will be substantial which also agrees with a substantial decline in stocks.
It would also be a good idea to take a look at the resistance of the US Dollar index at 88 going back for several years as the Yen is the second largest component of the US Dollar index.
Looked at past secular tops in the $/y and the average path would see the topping process min 7 days so we are close at day 5. Average first leg down would take the pair to 109.5 then a rebound to around 114 before a plunge to 95/97. 200 dma around 104.5.
i just received the most reliable short signal known to mankind since 2009, my pal just capitulated and closed his shorts. I now guarantee the mkt will fall within 1 week and by at least 3-4% I have opened shorts today and will wait to close once he texts me that he has reopened his short
Nikkei and Nasdaq rallied nearly 20pct off the lows. This is where the speculation is anchored. I agree with Richard that the Yen is the only market to watch here to indicate a reversal is coming.
been watching the $/Y very closely, watching the 15 min chart and you will see every time there is a dip buyers rush in, so far, after such a large advance, no correction yet, only a sideways consolidation. hope to see at least a small correction…if we can get a bit below 117.40 i may close some short positions. must say, the $/Y is very strong so far.
I would wait, the market never let’s you get in that easy, I’m a bit of a bear and yes it looks toppy but I don’t like trying to guess a top. Much rather stick auto shorts in underneath.or just wait for a decent reversal.
Yes you may miss some of it but at least your on the right side of a trade.
Just IMHO
Although the indexes are not moving, everything around them is lining up nicely. The bond bid was strong today. The prior divergence between bonds and spy lasted 4 weeks and began to close in the 5th week. We are currently in the 5th week of the divergence that formed from the October low, so we should see the spy move down imminently. Thanksgiving gives a break, so there may be the possibility of skating through this week. Either way, I think 70 points gets shaved off VERY quickly and once we break 2000 we should see a bit of panic. High yield drifted higher today, in line with what it did immediately before the Aug and Oct declines.
i believe when the volume returns, it comes all at once and these past few weeks of drifting up/sideways in such a small range will be reversed within a couple of days.
drop in margin debt says top is not in……not yet!
Why?
Margin Debt always peaks before top in Equities and turns down before the market does. So this is actually consistent with a fall in price.
Specie; didn’t Andre’ mention his work showing 107 days?
The Spiral is crossing the horizon tonight and also maximum Expansion of the Spiral radius occurs at 19:00 and 20:00. The hourly forecast has a low 11/26 2-3 am and a high at 9 am. The Spiral will contract now until 12/7 and a more significant low is expected closer to that date. https://twitter.com/mjmateer
30Y bonds completes the breakout today and symmetrical arc formed off the highs in Oct and subsequent consolidation. Now it looks like a giant 🙂 be thankful if you long bonds

Some here were suggesting higher bond prices = lower stock prices. Back in the old days yes as it’s a safe-haven play, but in the face of CB intervention and ZIRP, lower rates mean more appetite to chase yields in stocks.
Japan is running out of options:
http://www.bloombergview.com/articles/2014-11-26/japan-is-running-out-of-options?cmpid=yhoo
Meaning that Japanese interest rates may rise (against the wishes of the BOJ) which will rally the Yen and set of the reversal of the Carry Trade.
bond vigilantes been betting on skyrocketing rates in US for the past 5 years and i’d say they are broke by now
if japanese interest rates rise, i.e. boj loses control, i am not sure if that will rally the yen, when the government loses control i think the currency devalues and the $/Yen shoots up, japan will not have enough to pay for the interest, non stop printing. am i wrong on this?
Tuesday came by and no pullback. and here comes the seasonally most favorable 2 trading days. The only possible catalyst for a drop is an Escalation of American Spring Night into American Spring Midnight Madness by Thanksgiving.
http://www.zerohedge.com/news/2014-11-25/american-spring-night-2-ferguson-militarized-nyc-lincoln-tunnel-times-square-blocked
Would agree with that, it’s looking like multiple new ATH’s
in to Thanksgiving.
On the flip side a couple of lower closes now against
such strong seasonality may be a powerful reversal
signal, that looks a remote prospect ATM.
I have been reading blogs, talking to big time players, following Tweets and I have come to the conclusion that there are no bears left to speak of that actually have positions on. Question: What hurts the most amount of people right now? A santa rally or a scary pullback into the end of the year? The market always loves to cause maximum pain on the most amount of people.
Thanks all, new post out.