

The exhaustion gap (from Friday) is still in play, and I’m now looking for a gap down day. The current Nasdaq is shown below followed by a typical exhaustion gap pattern:
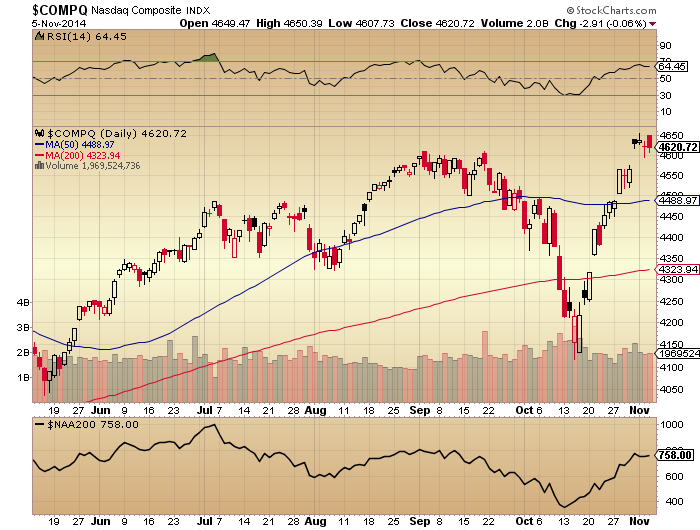
Source: Stockcharts
Source: TraderPower
The equivalent point from the year 2000 looked like this on the SP500:
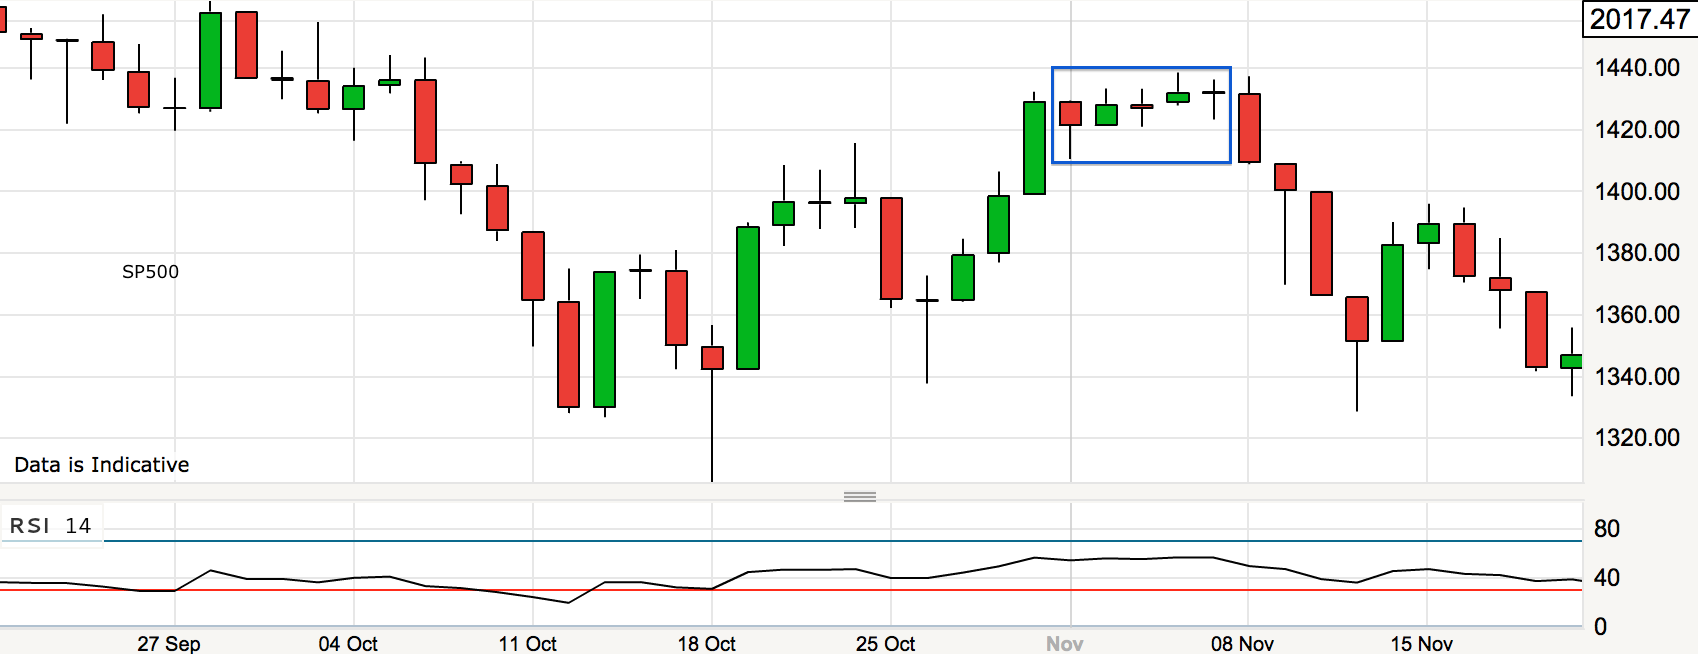 It took a few days to reverse, but the key is no significant break higher. Today is the full moon (or early tomorrow if in the US) which could mark the reversal, plus we have a potential gap down trigger from ECB disappointment. If the ECB surprise to the upside then I still don’t have a case for a continued rally, and that’s because I don’t see the fuel for higher.
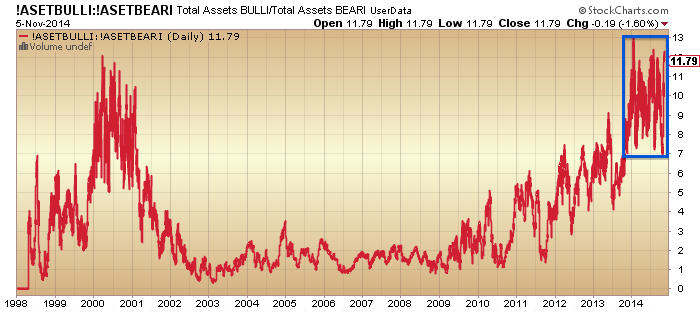
The latest II % bears reading is 15, which has been the historic limit, and AAII bears also now stand at 15%, which is their lowest reading since 2005. Rydex closed yesterday just below 12 which is thereabouts the historic limit too. Here we can see the market went down or sideways-then-down at such high allocation readings:

Add in the overbought indicators and current geomagnetic disturbance and it is likely the next move is down. Junk bonds appear to be leading this move.
 Plus note at the foot of the chart the renewed move lower in defensives versus cyclicals: XLY:XLU.
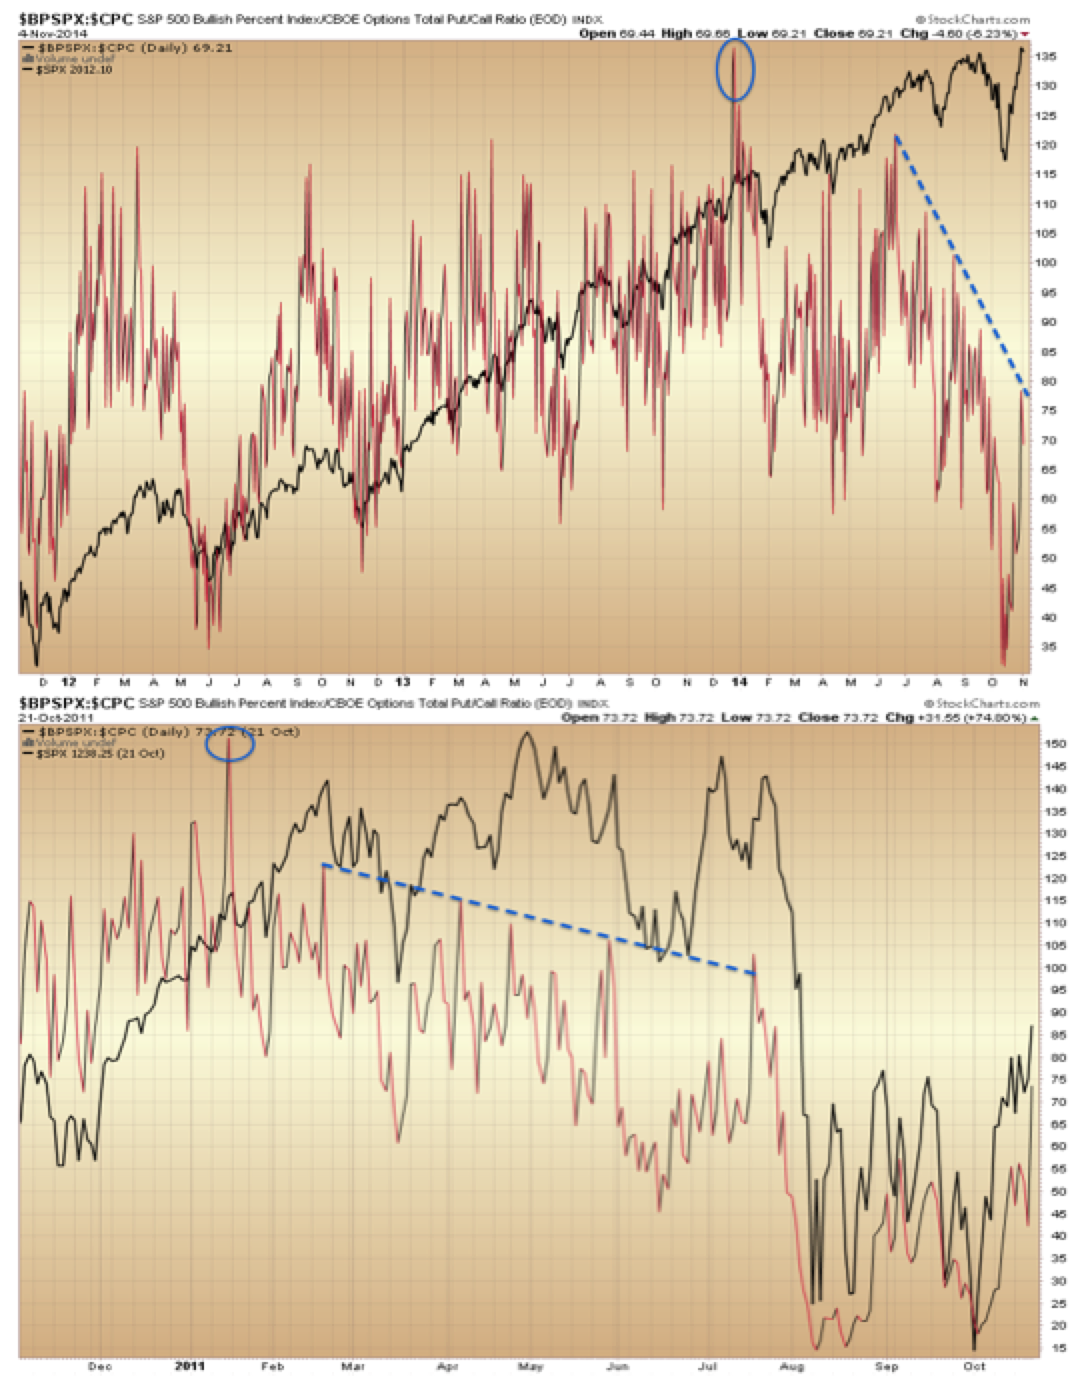
Bullish percent over put/call ratio is showing a five month divergence following a turn-of-year spike peak. The only mirror I can find for this is 2011, where something very similar occurred.
 For those who missed it, gold miner bullish percent is now at zero and suggests an imminent bounce or bottom for GDX:
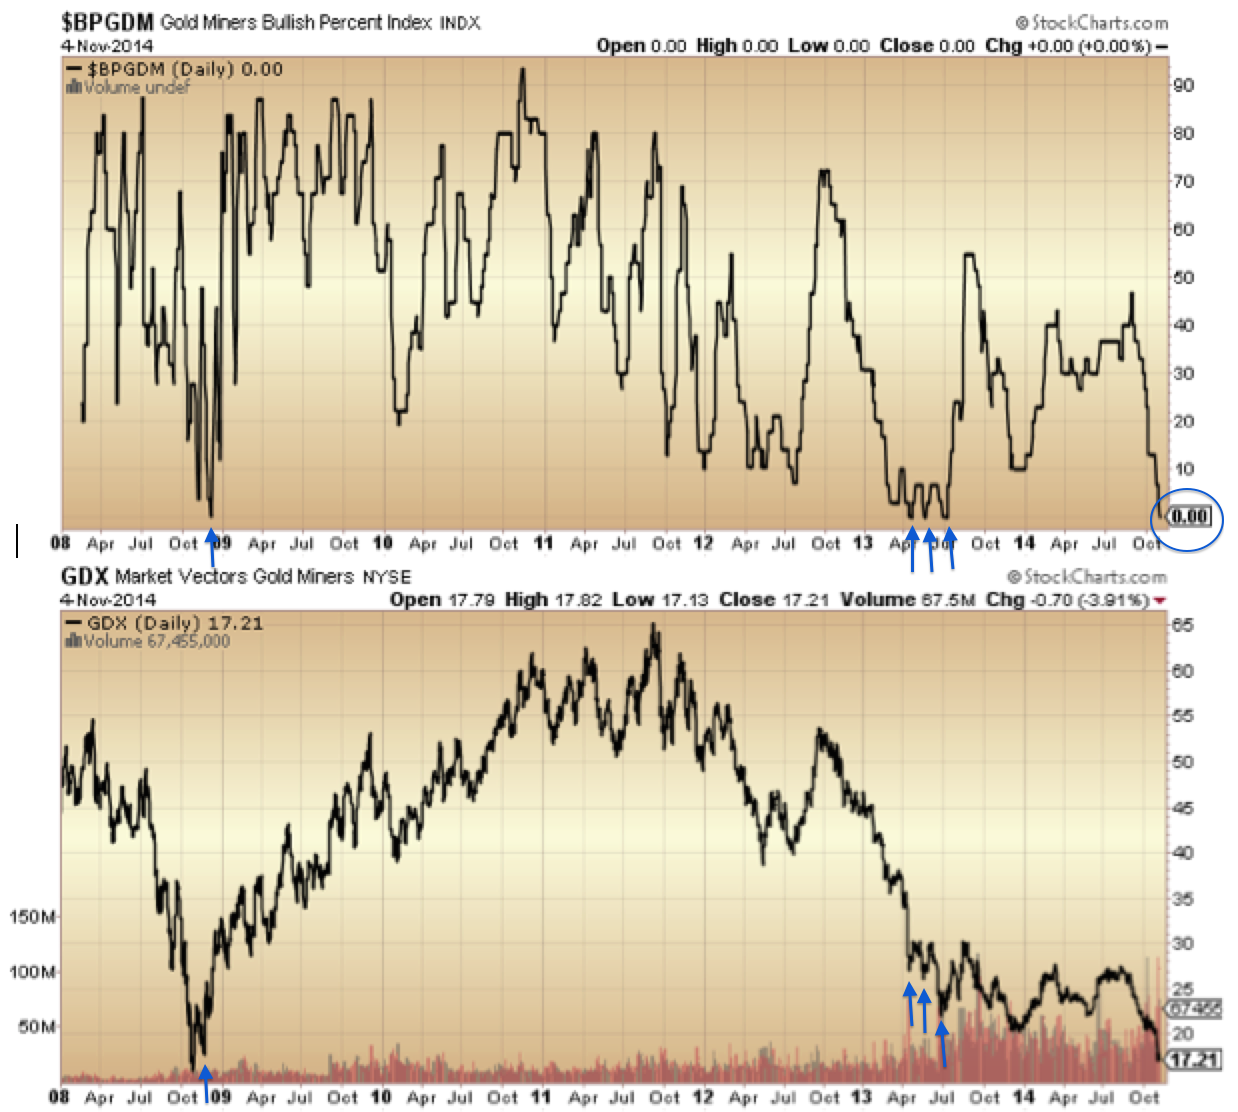
This is the flip side of the equation: gold and miners are capitulating whilst stocks top out. Reversals in both should occur together. I wondered previously whether gold miners would be sold off in a steep stocks sell-off, but the difference this time, say compared to 2008, is that they start from total washout levels, so I see the only way is up.
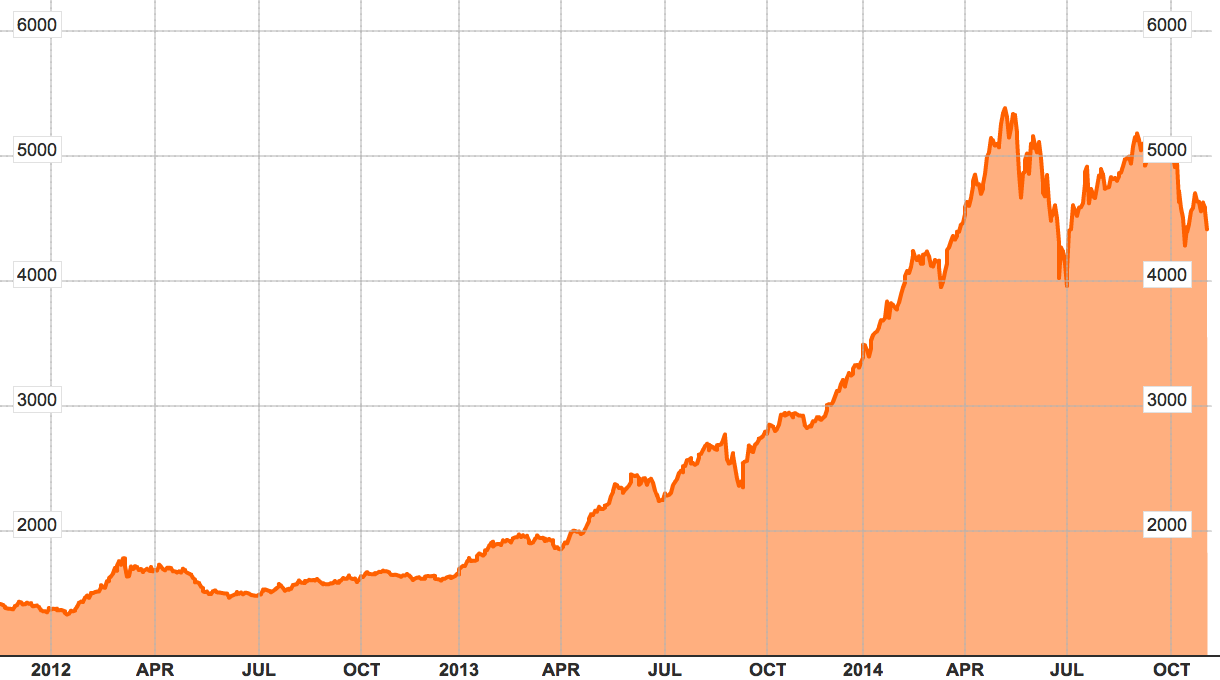
Moving on, a bubble I noted previously was the Dubai stock index. The parabolic terminated in May and there is a clear second chance peak since. This is a text book bubble/pop chart as it stands, and plays into the solar max being behind us circa April.
 Source: Bloomberg
The bubbles in Indian and US stocks look to be the the last to pop.
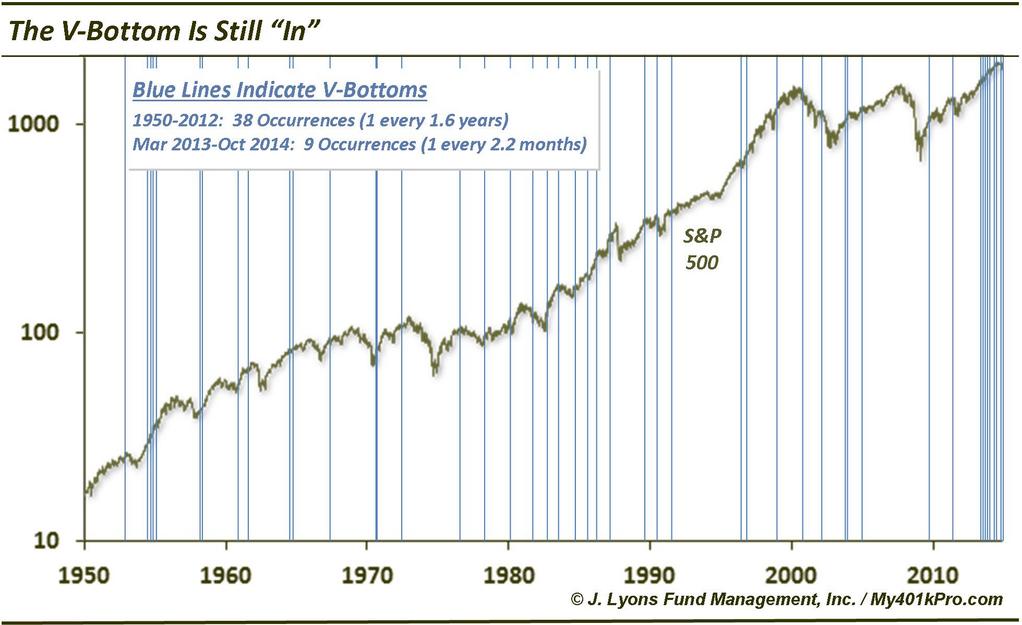
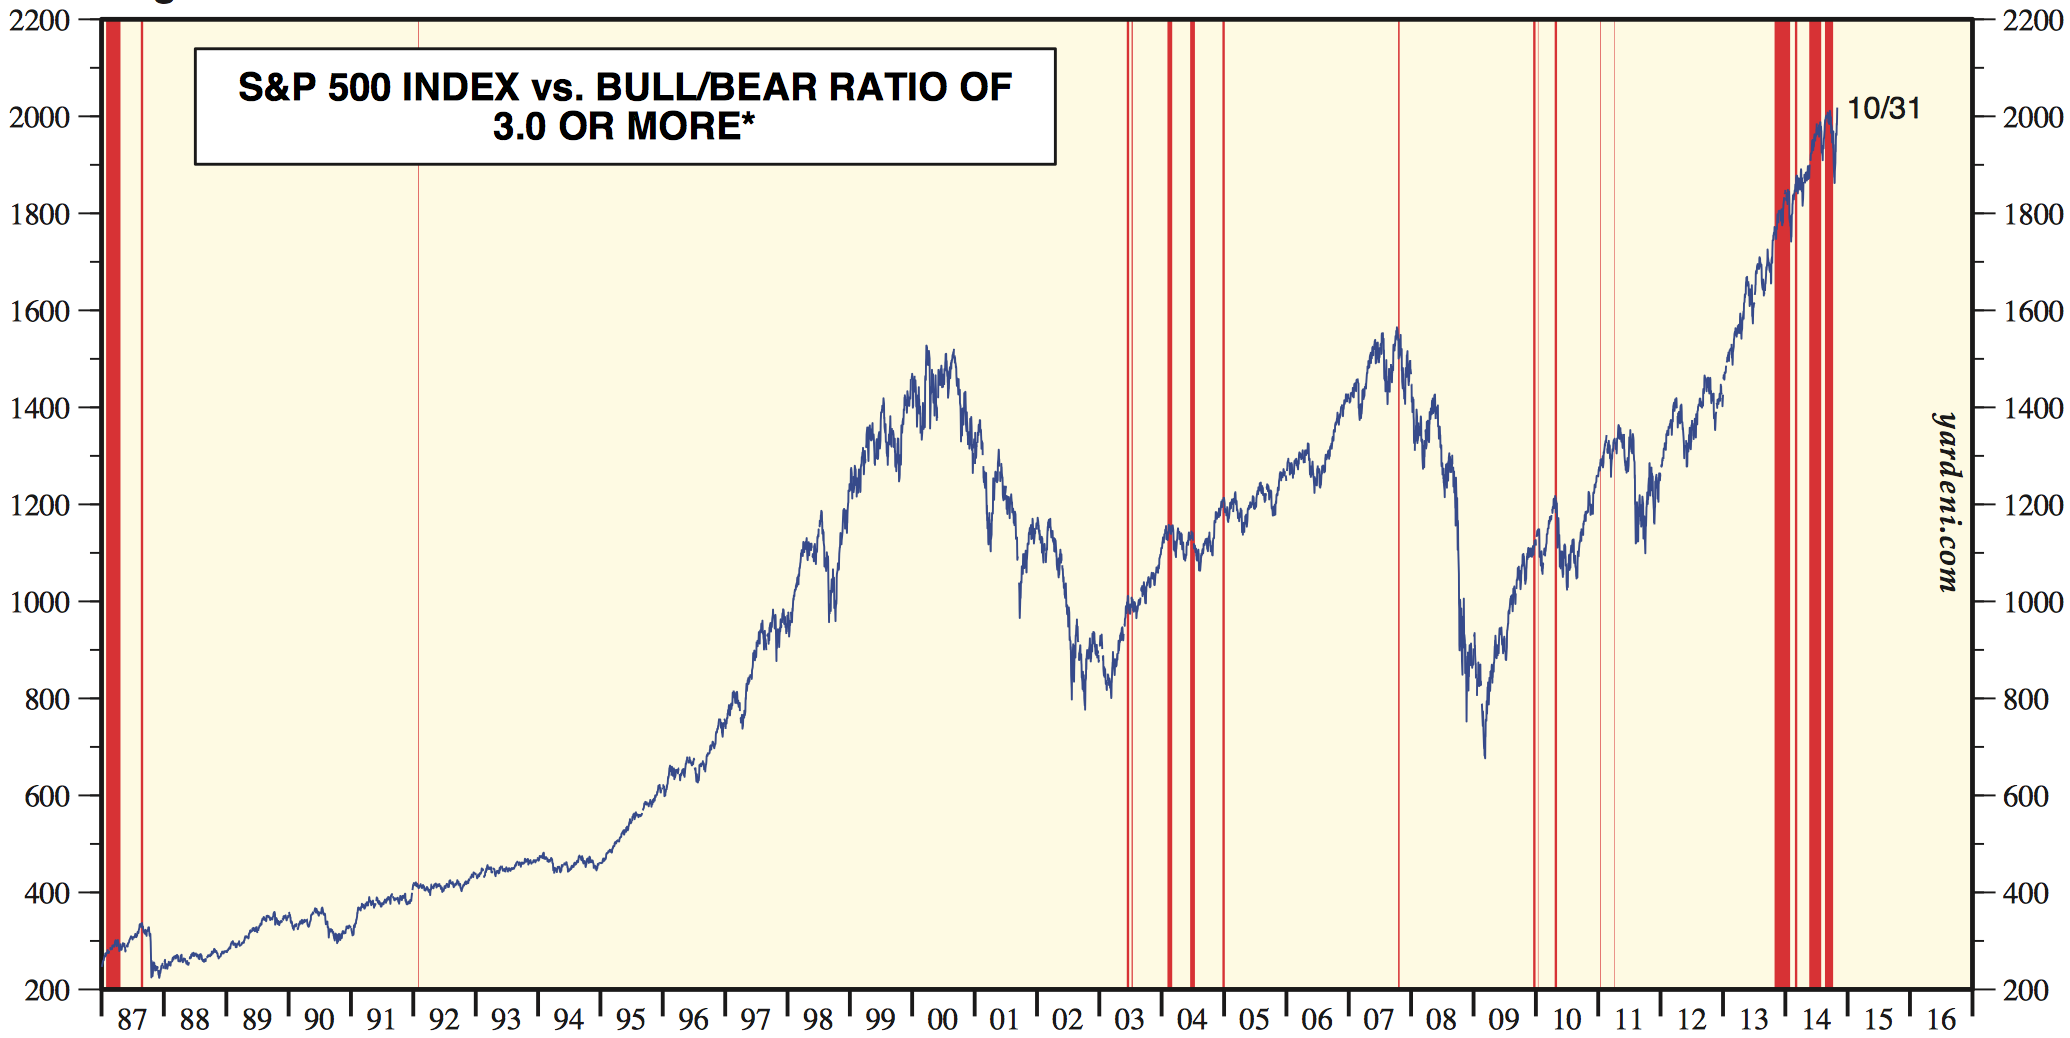
The mania in US stocks has been unprecedented in history in various ways:
Source: Ed Yardeni

Source: Rory Handyside Source: Doug Short
In short, sentiment, allocations and leverage have stretched to levels and durations not seen before. The unprecedented v-bounce cluster or swift dip buying has, in my opinion, stored up a mega-correction, and the record Skew level and duration warns of such a large drop. The October drop in equities did nothing to reset sentiment or allocations. I won’t be shifted from my stance that this is the set-up for a crash unless these indicators reset without a crash (which would also be a first in history).
It’s clear to me that the solar maximum has driven the mania and the lack of demographic tailwind has been compensated for by investors going all in on allocations, leverage and bullishness. With the mantra for the mania being central bank policy trumps all and the Fed being the most aggressive CB (until BOJ this year) I believe that’s why the stretching has been so pronounced in US markets. But ultimately, no-one could be prepared for this set of unprecedented developments in the markets. History has been well and truly made this year.
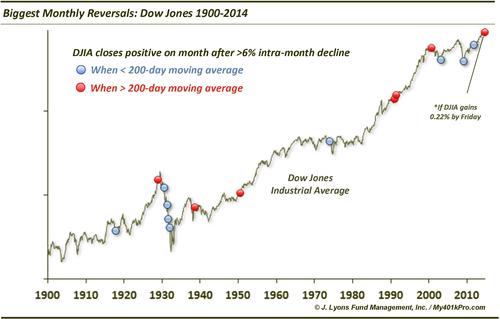
Recall at the October low we saw a capitulative breadth reading similar to bear market bottom lows? Bullish percent shows something similar:

Drawing in the nature of the reversal…
 Source: Dana Lyons
…similar reference points are popping up. Namely, what happened in October is either a sign of a market top or early bear, or it is a bear market bottom or major (~20%) correction bottom. It is neither of the latter two, so I suggest it is in fact the market peak / early bear sign and I have shown similar hanging man candles to October’s at the end of the 2000 and 2007 topping processes. However, there is one other option: it is an unprecedented catapult to an even bigger leg up in equities, which would fit with an anomalous delayed solar peak, if the bulk of the solar scientist models have it wrong, as well as the general ‘unprecedented’ markets theme.
I can’t rule that out. But it’s the cross-referencing again that keeps me from giving that serious probability. Leverage has failed to increase since February, sentiment and allocations are at an invisible limit. Negative divergences in breadth, defensives, volatility, smart money and other indicators are mature, and particularly compelling since the start of July. Since that point we have lower highs and lower lows on European indices and US small caps, which I believe are in bear markets. The positioning by indicators puts us right at the end of the topping process, meaning the next leg down is the definitive. In my opinion the case is so strong now that I can’t give an alternative much weight. So I continue short stock indices and long precious metals, but I am ready to step aside and wait if the market decides otherwise.
UBS see similar signs for a leg down from here but believe we will then scrape another marginally higher high by the end of December – but just in US large caps. I know this fits with some of your views that the final peak won’t happen until then. So, I would say: let’s see what indicator signals we get if and when this November leg down erupts. I believe this will be the definitive fall, but the possibility of a year-end peak would become clearer if we were to see swift capitulation again.

Thanks John great analysis & compelling summary of the evidence. Your efforts much appreciated.
Excellent analysis as usual!
The bounce in the oil stocks today appeared to shore up the S&Ps, but I doubt it sticks for long (in the S&Ps or in the oil stocks), which is what the bond market and junk debt are saying as well . If Europe sells off when the ECB doesn’t perform a miracle in the morning, the S&Ps should follow…
Thanks John. I had been wondering how the charts looked now that we’d had the ‘up draft’. Add mind reader to your list of credentials please. 🙂
Thanks guys
Great call on miners!
Thanks John. An Island Reversal would be a perfect signal but they are extremely rare especially on indexes.
Here’s hoping 🙂
Also the DAX has found significant resistance at the 50dma and possibly is the worst lookng index chart aside from possibly the Hang Seng of all the major global indices.
It needs to have a strong bullish move very very soon because it is beginnng to look extremely bearish again.
http://stockcharts.com/h-sc/ui?s=$DAX&p=D&b=5&g=0&id=p29753967420
Cheers ’til next time.
Actually studying both charts again the DAX is the worst looking chart. Any index or security that fails multiple times to rise above it’s 50 dma after it’s 50 day has recently given a bearish cross below its 200 is a signal of weakness and a confirmation of further weakness.
Let,s see if Draghi and the ECB pull something out?
Something to keep an eye on: the Russian ruble is still in free fall despite Russia trying to prop it up with interest rate rises and spending its reserves on it. Russia’s inflation rate js already 8.5% and its economy already weak
3rd auto short under 2000 on SPX set at 1989. (Other two at 1973 / 1949)
If it does move down it might go fast.
Added 2nd long to ftse at 6518 ( other long still going at 6493)
Both have stops at 6323
ECB just might do something positive today
Thanks John!
Nikkei and $/Y having hit a brick wall? Looks promising judging from violent overnight reversal on fx.
http://www.moneyandmarkets.com/important-questions-answered-2-67831#.VFtirsktSJ0
Russia have stated that there is a limit to intervention ruble-wise – the market didn’t like that…
If you want to see a bear market in microcosm
then look at KIngfisher, epic KGF.
This is not some ridiculously rated barely profitable
tech company, but a highly profitable cash generative
Home improvement retailer.
The stock has been de-rated as earnings expectations
have fallen, KGF has large Euro area exposure,
it remains highly profitable even on lowered guidance.
This will ultimately happen with wider equity
markets as mean earnings compress with the next recession.
No amount of QE will prevent this as CB’ s cannot abolish
the business cycle.
Earnings are the lifeblood of this bull market at it’s advantaged
stage and their importance is often underestimated with the
Elephant in the room that is QE.
Of course the two are linked, however falling earnings alone
will be enough to eventually kill the bull market.
With SPX mean earnings and dividends still rising,
even allowing for a moderation in their growth rate,
the bearish case lacks a vital component imv.
Still in place. European markets show similar structures beg. 2008 and summer 2011,- like Russell200- whilst US indices are pointing out oct´07.
Thanks, John
Looks like a raft of new ATH’s again today.
DJT may join the others.
Looks like Super Mario just handed out more cocaine to the markets. Lets see if it holds.
$/Y looking to have put in a first impulse wave down from what could be a multi year top at 115.5 – waiting to start wave 3 down s-t target 112.67. If that proves to be the top then this will have wider implications for stocks, $ and commodities (down, down, up respectively)
will be interesting indeed to see how the $/yen reacts to the markets today.
indeed
look at the euro/yen daily chart…may be a top?
risk trade even more correlated to E/Y so yes looks like a hard reversal here – rubber band is stretched
John, trying to make sense of one graph….
is this a daily chart? What are the dates?
Thanks!
I looked at Nov 82 but it shows a rally continuing through 83…surely not what you are suggesting?
It’s just to show an example of an exhaustion gap pattern
I found this confusing too. What if we’re currently to the right of the v-bottom and about to experience a big move upward? I don’t believe we are but….
buy signals fading fast – AD line is lilting like a summer starved flower…
http://stockcharts.com/h-sc/ui?s=$NAHL:$NATOT&p=D&st=2014-05-17&en=today&id=t67030228095&a=369189956&r=1415286965449&cmd=print
http://stockcharts.com/h-sc/ui?s=$NYUD&p=D&st=2014-06-12&en=today&id=t16264335459&a=367854604&r=1415287137843&cmd=print
http://stockcharts.com/h-sc/ui?s=VXZ:VXX&p=60&st=2014-10-15&en=2014-11-06&id=p13035672353&a=372598734&r=1415287366644&cmd=print
the noose tightens! lol
or will the condemned get a reprieve! man the minute charts look like crack heads dancing
Looks like the exhaustion occurence for the European indices is in (DAX fell back below resistance trend line), while the same for the US is still to come tomorrow. The European carnage may begin now.
Mario Cart on wings of gold…where it stops nobody knows…
mid caps trying to break out and start a new uptrend…tenuous and strange the mario move is
http://stockcharts.com/h-sc/ui?s=$MID&p=D&st=2013-07-21&en=today&id=t44045692085&a=374805050&r=1415289432335&cmd=print
http://stockcharts.com/h-sc/ui?s=$INDU&p=D&yr=1&mn=0&dy=0&id=p31468890305&a=370309589&r=1415292661496&cmd=print
So new ATH’s as expected.
The DJT will have the bulls smiling.
Mild reversal from here or power on higher ?.
likely retrace to the 17100 then we will see.
as for ATH that depends on what you are looking at…
NYA and RUT as in the bear camp
NYA BIG TIME which supports the idea that the headline indexes are being kept alive on declining breadth and just a few issues.
http://stockcharts.com/h-sc/ui?s=$INDU&p=W&yr=2&mn=6&dy=0&id=p37135064912&a=375131668&r=1415295547934&cmd=print
maybe pending mid terms were what was supporting stock market and depressing gold and oil, mid terms over now gold and oil to rise, stocks to lose some support. not bearish though into preelection year 2015, as 5th year of decade has been so strong for market.
stairway to heaven…HA!
http://stockcharts.com/h-sc/ui?s=SPY&p=W&b=5&g=0&id=p06669833237&a=374076938&r=1415294266773&cmd=print
Great charts Elvis
THANKS! but I was banned BY elvis and so my name is never spoken! lol
second that….
All roads lead to Rome, all charts lead to the sky if measured in fiat.
With fiat you always eventually end up with “Fix It Again Tony”.
like my old fiat 124 spider! well the dollar denominated staircase is wobbly at the top – wont last much longer
spx may have another 10 points left in it but it could crumble anytime
I think the PPT should be rebranded as the TPB – THE PATTERN BUSTERS!
http://stockcharts.com/h-sc/ui?s=$INDU&p=D&st=2013-08-01&en=today&id=t54619500768&a=368645081&r=1415296586542&cmd=print
The market looks like a floating turd.
GC is this one of those… they show you a picture and you have to come up with the first thing that comes in your mind? Please can you show us ‘what you are seeing’ on a chart?……errr perhaps not. I’ll live with just the mental imagery.
Lol.
major neg divergences, out of steam but can trickle a bit higher.
Thank you George, I will have that image in my mind for the rest of the day.
Imagine 6 open spx gaps below. do you think a few might fill ?
there is something not right about the DJIA 27 basis point point…!
bbe now you are being toooo clever. What the hell is a DJIA 27 basis point point?!
Please remember you have low life pleb here that you need to ‘drag along’.
Thanks.
the machines probed the 17530 area looking for bids and could find any but they launched from there anyway to create a price others would glom on to…
artificial price “discovery”
watch the 17530 area now IF price collapses with no bids that were be where THEY defend it if they can
that will be where they will defend – typo man to the rescue!
they probed it and then launched from it – pin prick nearby
Thx bbe got my sights trained on that number then.
Somewhat related – amazing video of biggest sunspot since 1990:
http://rt.com/news/202831-sunspots-flares-nasa-video/
http://www.zentrader.ca/blog/ a couple of good posts about the strange underlying realities here
ty you are really an asset to this blog……………and of course really appreciate the hard work John puts in ty all
today is a perfect example of how pig farmers create bids for pigs nobody is buying…
what’s with the airlines? up up and away!
Cheap fuel?
THEY are actually defending the fractal off 17530 so the breakpoint to the downside here is around 17538
if that does break though thats where the no bid machine ramp blasts off from.
reversion to the mean coming…..way extended, even if one is to accept a bull scenario
fractal probing! it hurts!
next probe point 17535
machines are running out of room
I have no clue how they work.
Michael Lewis’s Flash Boys
http://thecolbertreport.cc.com/videos/c7wjzg/michael-lewis
If my tide theory works (price rises to low tide nyc (today at 2pm) and then sells off, I would expect price to drop imminently by .3%.
A drop by 0.3%? Incidentally I thought that was Andre’s theory? 😉
Yeah, I guess it didn’t sell off after the low tide, today. But there is a trend of strength 2 hrs into low tide, and weakness 2 hrs after high tide. Andre’s concept was more regarding swing trading on a multi day basis using weekly or monthly data as trend indicator. The system I am working on is intraday. By the way, I hope Andre’ returns to update on his findings.
John, I definitely respect your view points and opinions about the market. I disagree with your assessment of precious metals despite the overwhelming evidence you provide to support it. My concern is your implication to now buy gold miners as this is the “bottom” and others get persuaded by your analysis.
There is a difference between a bottom (i.e. either bullish reversal occurs or it forms a base) and a trading bounce from oversold conditions. From chart analysis the daily bars since the Oct 31 gap down have been forming a bearish flag pattern. In fact even today’s bounce which is even greater in terms of dollar amount than Mon Nov 3 is occurring on much lower volume than Nov 3. That is not the hallmark of a bullish reversal in most cases.
Today marks the exact top of the bearish flag trendline, if that happens to be the pattern that is forming, and if so then the action would be to short miners aggressively here because the potential downside breakout would occur within one week and the GDX near term target would be around 14.
There is another scenario where instead of a bearish flag it can form a diamond consolidation at this point. If so then there is further upside in GDX to low 18.30’s to form the top of the diamond and close the Oct 30 gap down at 18.20. At that point the break out could then be either to the upside or downside but the consolidation gets dragged out much longer than a flag … at least one more week of consolidation to complete the diamond. Then likely Nov 19 or 20 would determine the breakout direction for the diamond scenario.
I have studied GDXJ a lot. Usually rises into the full moon and then sells off right after. Except for recent super down move, you could make quite a lot by buying new moon and selling full moon. Also if it above the 5 day ema for 2 conseq. days in up direction that could be a buy but if it closes below for 2 conseq. days in down direction that is sell. Also 14 RSI works like a charm but the price is not going to cross this for at least a few days even in the most bullish scenario. Full disclosure: I lost half my bank roll last year in GDX and would have lost more if I had been in GDXJ. I am not looking at strength in this sector till next years Venus retrograde which begins in the spring. Venus retros have been where all the up and away months have been for the miners last 10 years. Venus rules money and I guess that has something to do with it. By the way full moon is today.
Betafish, exactly what is the date range for Venus retrograde in 2015? That would be handy to note when it comes down to that time period and reviewing market action at the time.
I currently have a more concrete (temporary) bottom for gold around late April to mid-May 2015 period. That is based on the chart counting of TD’s for the past historical moves preceding the lengthy consolidation gold and miners got stuck in. It also coincides with seasonal behaviour because in many instances gold encounters one final ugly down move and then bottoms out in the past several years during late spring.
Farthest East Elongation 6/7/15 until Far West 10/26/15 usually bullish for stocks esp. GDX.
Steve
At lunch time I was looking at Trader MC’s public charts and came across his $HUI Waves Big Picture updated last on August 15th. Not sure if the link will work when I paste it here. His wave 4 at 251.83 seemed to have held and if you do a daily chart from this point you should be able to discern 5 waves down to our recent low of 146.01. Based on your comments on diamond patterns it sounds like Rambus Chartology; I am not a subscriber but know they are looking for a major plunge.
Going back to the Trader MC chart he had put the fifth wave down around 150 back in August, not sure if that was intentional or just where he dropped it. The wave pattern now does have a complete look to it. The argument on your side might be that perhaps what is shown as wave 5 would extend down in 5 smaller waves.
The other aspect to consider is that if you look at a monthly chart and use a 65 MMA this is often used to discern reversion to the mean or how stretched is price from the 65 mma? If you do a PPO (1,65) it will give you the percentage that the price is from the 65mma and it is over 50%. If you look at a 20+ year chart on either $HUI or $GDM you will note it is at extreme rare stretched levels. While you are looking at the monthly chart check out the positive divergences as well, I like CCI and MACD histograms personally. The other thing to consider is with prices this stretched what happens if they do blast off. When I look at price action off the 2008 lows being short this group is suicide. Some stocks tripled off their bottoms in a few weeks time.
Just an alternate view, I don’t think it is a slam dunk on either side of the play.

Hope the link works, otherwise you can probably search it out:
zigzag, thanks for providing your perspective. I always want to hear from both sides in case something is overlooked or gets interpreted differently, so very much appreciated. Diamonds are a common chart pattern although Rambus utilizes them in a somewhat proprietary way. I actually was a subscriber for a couple of months in summer 2013 but found that he required too much chart action to either confirm or deny his outlook. By the time price reached a specific point to violate his thesis, you would have suffered too much draw down. Also, this is obviously disasterous if using high decay 3x inverse ETF’s as a buy and hold.
I am definitely out of my shorts if price does not plummet in Nov.
Steve,
One more thing, if you look at the $hui chart from trader MC you will note the wave 4 (red) which is text book looking. From what I have read it seems to me that a lot of the people calling for crashes are looking at this pattern (wave 4(red)) and calling it a 1/2 way pattern. I don’t agree with that.
qe$4! talk!
Thus Spoke Elvithustra
What do you mean?
It was a pun on Elvis’s name comparing him to the author who once penned: “The higher we soar the smaller we appear to those who cannot fly.”
Early Fri Nov 7 sell on S&P longs on jobs number and hopefully you get SPX 2045-2050 gap up range. Anything more should be considered gravy! There might be a second chance spike up on Nov 13 if for some reason you hang on.
But you probably will do yourself a favour by getting out either Fri or Mon and then look to reenter at the bottom for a big up move around Nov 19 or 20 for a 14-day blast-off where the potential to rise nearly every consecutive day during this span is very realistic. Even higher highs than today or tomorrow in early Dec.
Steve T: Your predictions sound very reasonable and insightful. May I please ask what tools you’ve used to come up with your conclusion? EW? Thanks,
I am merely reviewing past fractal patterns and lining up the dates of the primary tops and bottoms back then with what is happening right now. The moves in between (i.e. the “squiggles”) can diverge slightly in that sometimes the day to day movement might not be an up or down day or there might be or not be temporary counter rallies before hitting the eventual targets.
What I have observed is that the dates and action likely coincide with either lunar or astrological alignments and that is probably why the price action reacts similar. I am no astrologer or lunar nut but Steve S. (aka Betafish) continues to point out the dates appear to align with some lunar movements. That is by random coincidence but probably unlikely though.
Also the Bradley turn dates appear linked to astrological significance for someone to pinpoint them so far in advance too.
what fractals Steve ? show some charts. You are just making wild guesses here.
Thank you Steve T. Much appreciated your feedback
The elephant in the room is Saturn superior opposition on Nov 18. Market usually is weak for month following this annual event. Otherwise your call lines up well with seasonals, Lunar Edge 11/9 to 11/25, and declination S to N 11/15 to 11/29. Maybe I will wait until 11/15 to enter and ride until early Dec. Txs. Steve
Steve S. Appreciate it if you could address this quick question for clarification:
Your “declination S to N 11/15 to 11/29” – These dates appears to coincide with the full half cycle of its (a) crossing the celestial equater from north to south, AND (b) reaching the maximum south declination AND (c) moving from the maximum south declination back north and crossing the celestial equator form south to north. Something like moving from 3 o’clock through 6 o’clock and then to 9 o’clock (or back to 3 o’clock if you wish) on a watch.
Is this what you mean by declination S to N, or you may be refering to dates other than 11/15 to 11/29?
Many thanks.
Correct the moon moves like a dial on a clock from north to south and then back from south to north. It appears that the north to south is usually stalling prices and from south to north rising prices. There are several times of note during this cycle one is that equatorial north to south which corresponds to 7 to 8 days after the north maximum is strong not weak and the downward price movement takes a breather. Interestingly enough this corresponds to when the the moon is in Libra every month and Libra here is the balancer of the prices. Also right after the equatorial crossing there is a three day zone of pronounced weakness about two days after the crossing which corresponds to Scorpio (I have no idea how or why the zodiac matches up every month with this cycle).
By the way, I had for some reason misposted the S. to N. declination and the correct dates should be North 11/9, Equator 11/17, South 11/24, Equator 11/30, North Dec 7. This totally changes my earlier post.
Error on above post Lunar Edge is correct but S. to N. should read Nov 24 to Dec 7.
Steve S. Thank you very much for the details. Best regards.
appreciation for all your education
Steve
You are right on in all your posts and I couldn’t have said it better.:-)
Sorry about that, I didn’t think the link would actually paste the chart in the discussion.
ZZ, is this you?
Christmas rally anyone?
Great Blog John. I have been visiting often but not posting comments on a regular basis. With your analysis and my reactive trade analysis, it definitely makes it easier to see the bigger picture and where the road might lead. I read a few post back that there were a few looking for an Oct 15th bottom and my confirmation came in at Oct 17. This was my low risk buy signal.
http://tfaat.blogspot.ca/
SPX 2150 looks achievable by year end.
This bull market will run well into 2015 ,
strong momentum in the US domestic
economy is likely to underpin this.
I would agree we are overdue some shallow
short term pullback, however markets could
just continue to melt up from here.
A game changer like a full scale Ukraine invasion
would alter this view.
Its just up up and up. Starting to think we have this all wrong even with Johns analysis strongly suggesting otherwise. Could the indicators go even more extreme in these extreme monetary policy conditions? Not likely according to history but there is always a first for everything.
It looks bulls are determined to push VIX down to major trendline support in 12.50-13 zone on Friday. We ‘ll see if this support works. Bearish action may commence next week.
http://tradingtweets.wordpress.com/2014/11/06/12-17-november-high/#comments
for those of us who take the geometry seriously … crucial LONG TERM pivot in FAS
http://stockcharts.com/h-sc/ui?s=FAS&p=D&yr=2&mn=3&dy=19&id=p92427758706&a=375189174&r=1415319233675&cmd=print
thanks Slater
Great chart.
thanks
Lawsuit:
Chicago Futures Market Creates “Guaranteed Winners and Guaranteed Losers”
http://wallstreetonparade.com/2014/11/lawsuit-chicago-futures-market-creates-guaranteed-winners-and-guaranteed-losers/
I believe Friday 11/7 will be the top and reversal day, heading to a lower low in the DOW and SPX by the first week of December. For gold and gold miners I agree with John’s analysis with one caveat, they are not done on the downside just yet. If markets do sell off as I suspect next week, I believe gold and miners would initially sell off as well. Gold cannot be seen as a savior. The miners, yes they are down from washout levels but that does not mean they could decline further. 1100 gold would send miners once more into a tailspin, as margin calls could force a nasty capitulation low. I’ll hold some powder for such case. Friday I am shorting SPX and DAX.
Youll get burnt shorting SPX
“QE is a stingray, dear readers, all the poison is in the tail end”. From Danny at Lunatic Trader. Implication is that QE will spur this market up to a 29 style peak. Would not discount Danny’s opinion because he has been around many years, with mostly successful predictions.
Just a quick comment that the sentiment on this board has shifted from neutral/bearish to bullish. The spiking corrective move has discouraged most of us, myself included. Shorting has been painful to say the least. However, I believe that the better strategy right now is short. Markets are way overbought and are due for a strong reversal. Many are doubting John. I am NOT one of those. I believe the imminent pullback is around the corner. EW count, sentiment, VIX factors, and geocosmics are all pointing to an imminent drop.
Rusty retest variation sell did not enter yesterday, still in play today: http://scharts.co/1GqpEmM
There are rumours NFP is going to be good.
No one should be shorting or doing anything else because of a blog on the internet – regardless of how thorough the analysis – no offence intended of course!
SPX-wise, anything above the 2007-2009 area is still bullish to me – so I wouldn’t be going short in the medium term at the moment. Better to allow the tape to break well-defined support levels and short then. Yes, you may miss out on a few dozen points points but at least you won’t be squeezed to buggery.
The problem with having a bear or bull view is that it affects our trading mentality, most have missed out on the 210 point rise on the SPX over the past few weeks as a result. I include myself for most of that having taken only a net gain of around 27 points on the SPX in the same period, the DOW has been better with just under 327 points net gain.
I always ask myself the question: “do you want to be right or do you want to make money””?
I shared some statistics on an earlier post in terms of proportion of trades that have been winners or losers. I have another one for the last 30 days:
Number of trades: 63
% of trades that have gone against me initially (for minimum of 1 hour): 78%
No. of trades that hit target/limit: 18
No. of trades closed early: 32 (by me, manually whether in profit or not)
Net profit on principal: 13.8%
I think the above points out that I have cr@p timing in general, although the result has been good (for me). I am only sharing this because it is useful to me to track other parameters apart from profit, margin and so on. I was very surprised to see that I clearly close out more trades manually than I thought I did whether in profit or not. The “missing” trades (13 ) is either where I have been stopped by the system (6) or where I have changed my target/limit order and then used a trailing stop (to maximise any profit) and have been stopped. Unfortunately I have not tracked whether I would have made more or less profit had I left the limit in place, although I think in the period in question I have by luck made slightly more…
I hate using time on this sort of stuff, but I do find it useful to have a periodical check on my behaviour. Does anyone else do this? What do you track?
(You don’t need to include profit, I just included it in order to show how many trades that have been ill-timed and in despite of that it has been a good period).
J
I don’t track so many things, firstly because tracking must be fun, secondly I am mainly daytrader, so there is too many trades too analyze. Every day I record the number of trades, result, and win-loss ratio. At the end of the month and sum it up, for example : October, 116 trades, 56-25-35 (win-BE-loss), 62% win ratio. 5 losing days. Volatility in mid October affected negatively my win ratio, but improved my resuIts in terms of points. Also I draw my equity chart, it must be in a nice bull market.
Whenever a trade goes against me by more than 10 pips, I close it manually, mainly at break even or with a small loss. My auto stop loss is rarely hit, my winners are those trades that work straight away and enable me to lock the trade at BE within two 5m candles. So my entries must be good, if half of them goes in my favour without looking back. I don’t modify my setups, I don’t add new ones, maybe I should work a bit on holding my winners longer.
I probably pay more attention to my mental state than trading which is now very robotic. Trading must be fun and not to involve tiredness. Number of trading hours must be adapted to individual levels of energy, also trading method must be simple : less set ups the better, less analysis the better. Brain fry, stress, hypercativity (on a trading forum:) are a big NO. I recommend everybody ‘Strategy of Indirect Approach’ by Lidell Heart. It’s a military book, but it tells you about managing your strengths.
ps
I think that your problem isn’t ill-timing, but maybe technical parameters of your entries.
Iv got 3 SPX auto short under 2000 level, I’m wondering if they will trigger anytime soon.
I still have two ftse longs going but very slowly
Overnight action in gold:
Hey John,
I already mentioned it before but I m more and more convinced that the central banks are doing anything to keep the dollar up and press the gold prices down to keep faith in the system and to protect the petrodollar…wich is part of the coldwar with Russia and China
So the stockmarket and gold markets are manipulated by buying futures short (gold) and ( long) on the stockmarkets…It’s the only logical explanation why things don’t fall apart…
The big question is how long can they play this came…
Europe is already in recession but we are tight to the US (just puppet states)
Cheers
Now this type of action is definitely overwhelmingly bullish. A spike down overnight to establish a new 52-week low and then a sudden reversal on its way to making higher highs than the past two days.
Overnight gold was down over $9 and now I see it up over $11 at morning open. This is quite volatile and insane action.
And in 2000 it bottomed out (Secular bottom) at the end of October:
Thank John, I will try to shot
Thanks Despe
I don’t trade off very short term charts personally, I maybe should use 5 min charts to judge entry but when I have tried this in the past I seem to get confused by what I call “noise” and end up making mistakes…..
Thanks again for feedback.
J
I know one guy who uses 2m chart as comfirmation for his daily stocks breakout set up :
http://www.traderformula.com/
Chris Dunn is OK, I mean a real trader.
But depending on what you trade, you may consider slight modification of your entries : if you trade flags/reactions, maybe you target too shallow retracements,
if you trade reversals, maybe you need different levels or candle patterns, if you trade break-outs, maybe you should attack the price further from the range or only after a pre-defined range’s length of time. There is solution to everything. Also I think that 60 trades a month are too many for swing trading, or maybe you trade too many markets; personally I think that markets are correlated so it’s better to focus on smaller number of markets and use bigger size instead. Of course, trading is one’s individual bussiness and we all probably must learn through experience and own mistakes, others’ talk is just talk.
ps I don’t recommend 5m charts. It works for me, it saves my time and energy. But one needs proper ‘day type’ classification as filter, and a big collection of intra day charts for reference 🙂
DOW Theory Buy signal,, DJT decisive new high,
Non US markets climbing back quickly and
now entering strong seasonality – that does
not say imminent major falls to me – some minor
pullback maybe before strong year end gains,
May be.
p.s. Tesco hovering just under resistance at 190pish.
Sold all in profit long tranches 10 mins ago, debating whether I should sell the 194.1p tranche at a loss now and reassess…..
Hi All
A word of caution !
We are in the sweet spot in the second press term. That runs from Oct 1 2014 to beginning of May 2015. History suggests the equity markets go higher – maybe much higher – possibly 2340.
Many indicators are stretched but they were stretched in Nov 1998 and Nov 2006. Stretched indicators didn’t stop the equity markets pushing on in those and other cases.
I have said this many times. Year 3 or most importantly year 7 of the cycle will most likely see the climax of the economic policies followed by the incumbent administration. Then the knot unravels!
So what are the general trends in place now?…………
Equities up ……..Precious metals down.
I believe that “general” trend will continue into mid next year. Then it probably gets messy, maybe, very messy.
The weakest point on Obamas first term was July /Aug 2011. Anyone around then will testify that it felt like a true crash. That period in 2015 should be watched.
I’m long with a stop and will stay so.
In the PMs – presently no position, but I will look to buy lower once this period of over soldness is worked off and they go lower again.
Jay Kaeppel who post on McVerry has a raft of bullish items as well:
1. 40 week cycle turned bullish 10/30 (he has graph last decade of this
cycle and it works)
2. Bullish 18 months of decade started 10/1
3. Sell in May and go away is over
4. As long as 50 sma is above 200 sma trend is strong
As I said, always a nee crop of newbies that must learn the hard way… lol.
I see Rydex at 12 & II bears at 15 for equities – both limits to date – and I see gold miners bullish percent at zero and long dollar positions at historic extreme. Add in the topping position in equities and I believe the major reversal in all these assets is right at hand. Ideally I would like to see a further pop on today’s employment report followed by an intraday reversal in everything, with this morning’s full moon being the timer.
I admire your courage and i hope you are right…and see that bradley make it’s inversion again..like it should….so far the the straight line is correct and when it turns arround all hell will break lose…
Here we go yet again!
Is this the buy the dip?
Or roll over Beethoven ?
Aaron
Which instrument are you talking about?
Personally I would be looking to short UKX now, but NFP keeps me out….
IBEX…
The US. But my trigger shorts are below 2000 on the SPX ( 1975 downwards)
I have two longs on ftse, as it’s been dragging well behind other indices.
Not at all sure about NFP, too high of the number of job increase may spell the end any future QE, on par may be sell the news.
Maybe a drop below 200,000 is needed to spark pressure for more US QE
Wtfdik
Will, would tend to agree with your view.
I find it mildly amusing as the next bear market
will the the 5th I have seen, and I can now see the
End game in this bull market cycle clearly.
I refer to it as amusing as on each previous occasion
you see the same comments – from bears astonishment
and disbelief about the duration and strength of the bull
cycle – and from the uber bulls, this time it’s different
stocks will never be cheap again.
There is always a dominate theme, this time it’s CB intervention
and it’s understandable that many are fooled in to thinking
that the the business cycle has been abolished, unfortunately
this will not be the case.
On a personal not I have closed out my remaining stock
position this morning.
John one of the glaring things about this chart is that all the tops are new moon other than Feb’14 and now the current one. Is this part of the ‘cycle inversion’ that is often mentioned by others here? I don’t understand the ‘inversion’ concept at all but if your answer is ‘yes’ then I think I will finally ‘get it’.
Most new moons are tops, most full moons are bottoms, occasionally they invert, occasionally they have no effect at all.
Thx. Is there no discernible cycle for the inversions or no effect ones?
I don’t believe so
Weaker and common partner to new moon tops and full moon bottoms observed is apogee bottoms and perigee tops.
purvez – lunar cycle inversions often occur near major Bradley turns and pairs of minor turns. Probably due to sentiment changing.
Thx for that info Mark. Will check on that.
Edit, may be apathy rather than amusement
is more apt.
The DAX continues to keep us guessing. It managed to close above its 50 yesterday on ECB release but failed at the 200.
So not quite as bearish as yesterday but it has still formed another rising wedge that must break either up, which would be extremely bullish,or down, extremely bearish if it also follows through and breaks 8900.
http://stockcharts.com/h-sc/ui?s=$DAX&p=D&b=5&g=0&id=p76934563944
The Hang Seng continues to weaken and is reaching a critical level and many HK stocks also appear to be lining up similarly.
I am still watching HK closely because I believe that something is brewing. What or how I have no idea, but history shows that triggering events to major sell offs usually come from left field and totally surprise markets.
32 tanks entered Ukraine.
So it finally happening, tbh, 80 pieces of milliarty hardware, is not much of an invasion.
Unless there have the numbers wrong and real figures come out over the weekend
http://news.sky.com/story/1368812/dozens-of-tanks-enter-ukraine-from-russia
Oddly all concern about terrorists, protests, war, and pandemics has evaporated.
…and no concern about record cold temperatures either.
thanks john. i agree with your analysis here. pouring over my own charts the last few days and i see the potential for about 10-12 points of upside pop on jobs, but no room beyond that. i think if we hit that high we could get a sharp intraday reversal that would play nicely into next week and through november. i dont think this next leg down will be the waterfall decline, but we should test spy 1700s before a low volume retrace into the end of the year. added puts yesterday, so let’s see how this plays out.
Sky is reporting 32 tanks have entered Ukraine from Russia…..nothing on BBC yet.
NFP , at 214k,
I think estimates was 235k,
$/y lower high – baby steps
Seems like NOTHING can stop the USDJPY….. at least for now.
Megaphone from 101 seems to have contained this parabolic move for now. Lower bound 107.
Peter, please send me an e-mail. Sorry for butting in here.
By way of light relief… AAPL looking fairly squeezed – another retest variation sell also: http://scharts.co/1zAcqlq
John et al. I presume you all have seen this:
http://time-price-research-astrofin.blogspot.nl/
In it is says that the current SC24 looks very much like SC1 and on that basis it says: ‘a trailing off of activity cannot be anticipated anytime soon.’
Would this explain the continued bullishness?
Hard to compare magnetically, due to non existent data of sc1, but current cycle mean polar magnetism has flipped marking smoothed peak. If north polar field sorts itself out here then max is in. http://www.solen.info/solar/polarfields/polar.html
I don’t know much to comment at that level. I was hoping for John to say something along the lines of ….yes seen that but it’s not relevant in this case because….. etc.
Otherwise to the untrained eye it seems like the Solar Max may yet be ahead if I’m reading their chart correctly.
Pink line, solar max, lies near black dashed line, mean magnetic reversal, in last 3 cycles. Since current cycle has reversed, solar max must be close to it.
Someone else brought that up. The SC1 analog shows an anomalous solar cycle to the norms. We have to allow for an anomaly but SIDC, Solen, NOAA, IPS and polar switch argue the smoothed max is behind us, and cross-referencing the stock market data adds to that case, so I stick with that until evidence shifts.
Wave 1 of this bull market started on Oct 4, 2011 with SPX 1074 and lasted to Oct, 27, 2011 with SPX reaching 1292. Advance of 218 points.
If Wave 5 started on Oct 15th, 2014 at SPX 1820 then SPX should reach 2038 today as Wave 1 = Wave 5 is common relationship.
VIX should find support at its rising trendline which crosses around 13.
If this really is a final move then reversal in next weeks should be devastating. USD and Gold seem to already have reversed.
Good point!
well vix collapsed but bonds are rallying – this is most unnatural – 2035 will be interesting
http://stockcharts.com/h-sc/ui?s=RSP:$CPCE&p=W&st=2013-09-02&en=today&id=p22704594053&a=374850542&r=1415373893961&cmd=print
how this divergence works out eod will offer insight
vix is really the key to the topping
divergence on AD lines is getting burned off so if this is going to top we need to see the internals weaken again – its about 50/50 right now…
the chart that never lies (but that IS open to interpretation! lol) says this is going to rollover…I think! roflmao
http://stockcharts.com/h-sc/ui?s=$NAHL:$NATOT&p=D&st=2014-05-16&en=today&id=t74316398351&a=369189956&r=1415378587821&cmd=print
So is the huge reversal in gold overnight due to news of Russian tanks rolling into Ukraine? Just trying to get a sense if this is just a one or two day pop or a genuine swing in trend.
Markets just look like they want
higher levels, let’s see if next week
brings some sort of retrace.
??????????????
vix bounce
bond bounce
rate drop
the improvement in the AD is being confirmed by the NYA so maybe this is real but so much feels forced here
Good eyes. Major indices are mostly flat while NYSE repair continues… not supportive of a crash now scenario.
yeah but there is so much weirdness under the surface here – look at the chart that never lies
AD is improving but everything else whats to roll
and the NASDAQ AD line is not improving at all and the small caps and tech are in a bear market whether price looks like it or not…
just too many distortions to be a real uptrend
remember that all crashes happen FROM ATH’s…lol
http://stockcharts.com/h-sc/ui?s=$NAUD&p=D&st=2014-05-23&en=today&id=t96472988025&a=374043886&r=1415381522828&cmd=print
There is no perfect rally/correction and there is always something bears/bulls hang their hat on.. In the end, price rules.
the meme of price is ridiculous as price is always high until it isnt
it’s like saying someone is a “survivor”. sure until they arent.
human narrative left brain confabulation
no hat hanging going on at my place – I DONT WEAR HEATS! lol
the numbers are saying that the rally is exhausted
a drop below 1995 will be the first of a series OR a bounce at that gap will mean one last ATH that will reinforce your price meme for you
I also dont wear HATS! roflmao
absolute breath is indicating that this is the beginning of the end of the rally – could have a short pullback with a silly bounce and then the drop or could just drop hard here
if long at least set a firm stop at around 1995
if the gap at 1995ish breaks then down; if bounces then rally will die somewhere between 2035 and 2050
either way there is a pullback in progress to at least that gap
Sunspot group 2205 has just released an X-class flare (17.20 to 17.40GMT). This group has recently been releasing CMEs with its flares, and is moving into an earth facing position. Any CME could reach us (depending on its exact direction) early next week…
we are in the drop window here – it will be a series of drops and failed recoveries I think that then leads to what will be seen as a crash – 10% fall will create margin pressure
Thanks for your comments and charts. Much appreciated.
NDX has formed beautiful triangle over this last week, it may want to burst up in its last final spasm towards the end of the session.
vix is definitely on your side right now…let them all spasm as final odes to ATH’s!!
the spread on the keltner and the BB’s are not in your favor tho
The fact that VIX has been absolutely crushed but the RUT has gone nowhere is evidence that the usual bag of tricks is no longer pushing the markets higher. They will need the Central Bank of Mars to issue a “whatever it takes” statement, as the BoJ and ECB are all in and and already bleated their usual spew about “whatever it takes” to save central banking from itself, etc.
I agree BUT it is also evidence that the Pattern Busters are suppressing the vix artificially – it’s easier than directly messing with all the indices
113.5 $/y has been triggered – decling horizontal triangle bust – this is a start for a meaningful top hopefully
this market just refuses to die! shorted the $/yen earlier but been waiting for the go ahead signal (i.e. equities roll over) to go ‘all in’. so freakin’ frustrating
Same here. At least we have seen a parabolic move which is very rare in a major fx pair and usually is associated with a major top such as in 1990, 1998, 2002, 2007 and hopefully 2014.
Hi ! Perfect set-up to buy IBB and QQQ for the next rally. oh, do yourself a favor and short more GDX on this rebound.
So, it looks like BBE and his “chart that never lies” will get caught again with his pants down.
i’d never want to go toe to toe with on stock picking or market timing
or ball busting on a forum
but
IBB is a pretty perfect looking top
and
GDX is an ok looking bottom
to me…
http://stockcharts.com/h-sc/ui?s=GDX&p=D&st=2009-10-22&en=today&id=p98121172165&a=374053711&r=1415387426826&cmd=print
11.50 on GDX is likely – unless you get a good retest and support at the gap 18
the technical damage need to repair in reasonable fashion IMO or down to 11.50
ibb is weak but needs to break 290 or it is still in uptrend
it is close to breaking tho
can someone explain why the Nikkei is staying elevated while the etf, EWJ has given back all the gains since BOJ announcement?
Must have something to do with currency movement since last Friday.
There is just no way to read this clearly now. I have gone back and compared this move with others before crashes and it is very similar but it is pushing the limit. Moving average bands are starting to turn up. It has to turn down hard and fast to keep momentum down. if not a retrace is a buy.
38 percent retrace is still a move to 1960 or so. In this market that may not even happen as the PPT does its magic. Just be stupid and go long is the continuing tactic that works. I despise it.
The dumb and ignorant are winning. Just awful
Yup, I tried to think for myself, I agreed with prechter’s thesis, dismissed all the FED talk and pressure from family to just load long. and it cost me dearly. Just be stupid and buy. lol
The PPT saw the crash set up and erased it. Of that i am convinced.
Consolidation of economic power. if I print one dollar in my basement I go to prison. These sociopaths can print trillions and CNBC kisses their ass. I got laid off during the 2008 crash. 18 of us ! we were told it as necessary due to the crah. of course you do not get called back when the market hits new highs.
wicked negative RSI divergence on weekly chart. something is going to give soon, either an irrational blowoff top or tank bigtime.
Do you have a chart?
Pull up a weekly chart of SPX and use RSI 14, you can not miss it
that being said, neg divergence can be “burned off” by new buying pressure, so watch the price action from her. If we retrace a bit and stabilize, we could go higher, as stupid as it will be.
bluestar i appreciate your comments
i think that is what the guy at greedometer has tracked over the last few years pretty well.
i thought we had already reached the peak of central banking power
i ges snot
just wait – the gasping is on the lips of the fatcats
Greedometer Blog
Loaded for Bear
Published on November 7, 2014 by admin in Investment Calls
I topped up my short position on the SPX today when it was in the 2030s. My net avg weighted buy price is 2020. I’m loaded for bear and have the largest tactical short ever in client accounts.
Tagged in stock market crash 2015, stock market top 2014
I watch what Jeff (Greedometer guy) writes with great interest. He sure appears to be all over this. He called the correction and bounce back last month with impressive accuracy. He’s wrong about gold though. (He thinks it will get hammered when the stock market does, but he’s wrong.)
zero is the new green
ANDRE, ANDRE, , will you post Sat. or Sun.??? , A little help please..
Tomorrow I’ll tell you what’s rolling through my head right now.
New green = No US reversal .
Always next week, or we may just
continue to melt Up.
hahahahahaha! the cry of evermore and never again!
again Phil it depends on which index you look at and the breadth of those.
but headline is all that matters until the one stock holding up the dow dumps!
Great posts Elvis
Just an observation and not a criticism:
Going long IBB and QQQ and shorting GDX would worry me and my own risk/money management. Basically going long at highs and at the same time shorting something else at ATL (or thereabouts) seems to me to be a situation that could go very ugly very quickly….? How would you hedge that scenario?
Paul Tudor Jones has its rule for building a super reversal portfolio. He would short stocks that are both above the 25 day and 200 day SMA and long stocks that are both below 25day and 200 day SMA. Under his rule, GDX would be a buy and the IBB and QQQ would be short candidates when the pocket between the 25 and 200 day SMA widen to the point it is unsustainable.
Elvis, I do not believe in evermore our
never again, my posts refer to that as
being illusory, the next bear market will
be the 5th I have seen.
I do not expect that until Q3/4 2015,
at the soonest.
For nicola2910 – and other interested parties- my weekend update.
Starting with the bad news : the gravitational trend is up into January 2015.
I see 5 cycle levels here:
1) multi year (=6,2 year?)
2) yearly
3) multi month momentum cycle (3-4 months)
4) bi weekly apo-peri cycles
5) weekly tidal cycles.
This is the only analysis that explains the market for the last 6 years. And this analysis – instead of declination – clearly pointed to the 6-18 october period for a significant low. And now the 3 longest cycles are up; whether you like it or not.
So for the next months, all we have to do is look at the tidal- and apo/peri cycles
Every apo-peri cycle can either go with the flow or fight the trend. And the same applies to the tidal cycle.
From October 16 the 3 longest cyles are up. That’s why the market keeps setting ath’s- as expected. And the 2 shortest cycles simply can’t push down the market that much.
The October low was supported by a negative momentum cycle, as in February and March. But this cycles has turned up.
The current apo-peri cycle is up from nov 3 to nov 15. The tidal cycle this week was down, so the tides fought 4 longer cycles. This only produces a downtrend when momentum is building. Tuesday gave a roc-extreme or a peak in momentum. This gave the Tuesday low. When momentum falls while fighting the trend, the market snaps back.
The regular low was Thursday/Friday. (indicator reading flat). This produced a consolidating market. That’s why the vix was – 4% on Friday.
Next week : all cycles up. The tides give November 15th, exactly matching the apo/peri timing this time. As this is a Saturday the high will be Friday or Monday in early trading.
So there’s not a lot we can do; next week is up. Thursday a roc extreme, so Thursday will be volatile with a w3 top and a w4 low and friday 14 a low volume w5 up into the weekend. After that we will see a correction as apoperi and tides both want down. But this will be a retrace in an uptrend.
I am sure there are longer cycles above the 6 year. But for the next few months this is irrelevant. The real fun comes in 2015. The moon is simply drifting away into December. And this will be an extreme distance, producing the early 2015 top. This extreme distance won’t be surpassed until the end of 2018. So 2018 will produce the low for the next bear market. And we have all the time in the world to look closer into this timing once we get there.
Cheers,
André
Little addition :
1) the average apo/peri distance sets a multi year high between nov 27th and dec 12. This should produce a high, but it is inverted. This inversion will turn the high in a december low and push the high into 2015. With a high on nov 15 chances are we will go down from the 15th (=14/17) into early December.
2) Matching the tidal timing with apo peri timing I noticed something weird. Once every 110 days the match is perfect (same day). This makes me think about the 109 day cycle I talked about last week. The weird thing is that deviations between the tides and apo peri must be solar, as sun and moon together give gravity. So this 110 day cycle must be solar. And nov 15 will bring this exact match. The last time was in july. Have to work this out, but it must be significant to see this cycle emerge from the data and not from a theoretical construction.
109/110 days also fits in well with 4 completed rotations of the moon (27.25 days) and the lunar Anomalistic cycle (27.554551 days)
Steve, I know. I had seen this cycle in the declination table. For the first time I see that synchronicity between tides and apo peri show the exact dates for this cycle.
Nov 15 shows this event. Counting back we get oct 18th, just two days after an important low. The tides gave a sharp timing, but the timing is too close for coincidence. Next date December 12, what will be the december low I talked about.
It’s one thing to know a cycle exists; it’s another to know when it started. I think I have both now.
Interesting that Mercury retrograde happened every 120 days which is three time per year. The Nov 15, and July timeframe are both after Mercury retrogrades.
Andre,
Thanks for very informative post. 🙂
Thanks
Andre
Are you trading this analysis? How?
I use this to get a feel for what the market wants. I have an operational cycle model to trade with. And with the analysis above I try to fit an eliott wave structure. The Thursday/Friday consolidation produced 3 waves down. It helps to have an expectation at this level. It is simply a 3 or 5 (or 7 with extensions) wave cycle.
And it helps in reading the tides; knowing if the tides go with the flow or not gives another timing. Knowing what to expect helps in reading my cycle indicators and timing. In addition; knowing what cycle is coming you can decide to let the trade run for a few days. Thursday/Friday this wouldn’t have worked as the market was consolidating. Now the focus becomes day trading. But swings with the trend (the w1,w3 and w5) are better suited for swingtrading.
And it helps me to relax. Reading other analysts – with all due respect – drives me crazy. Mchugh expected the crash in 2013 and now talks about late 2015. All the while the gravity trend was plain and simple : up!
Hope this helps.
For inspiration a little mindgame on apo peri.
We have to understand how the moon moves. The moon can’t make a v-turn; it’s to heavy for this. So approaching apogee, the relative velocity – as seen from earth- goes down. So I take 2 days before and 2 days after apogee as a phase where gravity is more or less flat.
When the moon approaches earth it enters into an orbit around earth. During this orbit the distance from earth is more or less stable. Technically perigee is the shortest distance, but the orbit is much more relevant. That’s why I take 4 days before perigee and 4 days after perigee as a phase where gravity is strong but stable.
This week the perigee period ran into Friday. So the uptrend was kind of consolidating as the real distance didn’t do much. From today the moon has left the orbit and is truly adding miles to the distance. This supports my analysis that next week is up. Thursday we enter the apogee phase. This marks the top of W3 that I see in my roc extreme. So W5 goes up without much gravitational support. How’s that for a divergence? Tuesday 18 we leave the apogee period and start racing towards earth. This will increase volatility.
Thanks Andre’. Great posts, your work is very interesting and informative.
Thanks 😉
I have noticed a trend that apogee is weak every month from one trading day before to two trading days after. The trend is so reliable I think I am going to cash each month during these three days. I would say it is 90% time market finishes lower or flat during these days, and sometimes the down moves are huge. Do you have any thoughts on apogee weakness in the markets and why on a tidal, gravity, or electric basis apogee would be weaker? Interesting that some tribes only plant seeds at apogee and never at perigee, and avoid fishing at perigee cause the fish get into deeper water (electrical)?
Steve,
Not sure I understand your question. What do you mean with apogee is weak?
OK. How to test. Print a 12 month chart of DJIA, SPY, QQQ, IWM etc.. Look up apogee dates. Place a (-) sign on the date of apogees. Observe the price behavior one day before, day of, and 2 days after apogee. See if the price is not weaker at the close 2 days after apogee than it was at the close 2 days before apogee. If you look back 15 years, you will see apogee exhibits weak prices and many of the 5 – 8% quick declines are during or after this 3 day time frame.
Steve,
Interesting observation. I’ll have a look at this. Although I’m sure the tidal timing combined with the apo/peri cycle gives the same insight.
Everyone thanks for responding.
https://stockcharts.com/h-sc/ui?s=$INDU&p=Q&b=5&g=0&id=p46721842861&a=349076472
hi
very long term DOW charts. volume keeps going down. MACD not turning yet though. Slope trying a double top. it’s 50/50. too much CBs intervention visible or invisible. a political crisis in the US is possible and gives uncertainty. and possible another gvt shutdown and debt issue again. Europe is on path of further deflation and euro collapse in 2015 ( finally) with Greek default and German DBank in serious trouble. 2008 Lehman, 2015 Europe. Can’t comment on solar cycles, no experience. But why gold and miners started a move this week? are they telling us something ? right now I’d feel safer in cash and some money invested in good REITs who didnt move during last 2 months volatility but pay juicy dividends. as for Japan DXJ is better as it is unaffected by yen moves. but it was a much better play at $30.
notice a white Hammer ( short body, long lower shadow/tail) as in 2001 and 2007
but needs a confirmation ( ie, what candlestick follows).
in 2001 and 2007 right after this hammer, stuff happened suddenly.
Anyone that shorts PM metals or stocks on this reversal deserves all they get
http://stockcharts.com/h-sc/ui?s=$GOLD&p=D&b=5&g=0&id=p35551000307
Hang Seng headed for what appears to be collapse
http://stockcharts.com/h-sc/ui?s=$HSI&p=D&b=5&g=0&id=p22364037121
And Martin Armstrong contradicts himself in just one paragraph:
“The decline in the metals is in line with the global economy. Come on – look at oil !!!. The metals will rise. They are NOT perpetually suppressed. The time is just not right. What would the banks, who care only about the next quarter’s trading profit, keep the metals suppressed without profits to pay regular bonuses? EVERY manipulation they have EVER done with the metals is to make fake rallies because they KNOW the gold promoters will talk everyone into buying. To many – reason flies out the window. This has become a religion to perpetually hold rather than trade. The manipulators get to sell those rallies and make a fortune.”
So let’s see Martin?
The metals are not perpetually suppressed, just enough to create a sell off so shorts can can profit at expense of longs, upon which the whole thing is repeated?
Is this guy losing it?
Yes, he is. I can’t listen to the guy any more. Good catch, Allan.
Great observations Tom. Hard to argue that cash position is a smart move right now. Direction wise, it is hard to tell if the firework in the US SM will continue, or stall and drop from here. John has built a solid case. However, the markets are stubbornly chugging higher, with bad and good news.
For the bear case, I think the next 2 weeks would print the last chance for the crash scenario. If nothing happens before Thanksgiving, it is more likely that the SM will continue to be strong until 2015 imho.
My EW count results in an imminent drop, but obviously that is NOT what is happening now.
erick
yep, flip a coin but better be safe than sorry I guess and miss another 5-10% on the indexes. the public is not back yet and that pisses pros who have inventories to unload. this market is also so much about stocks buybacks that alterate the PE ratios. insiders are net sellers in 2014 also. this is not the artificial bottom of march 2009 ( it would have crashed further without CBs intervention).
the Hammer in fall 1996 was not confirmed and the market kept rising. if one just looks at a candlestick indicator. there is a black hammer in end of 2000,confirmed, market drops, same end of 2001, confirmed, market drops. same in summer 2007, confirmed and market drops. we wait for a confirmation here again…. speaking of valuation it is FACT the Buffet PE indicator says market is NOT cheap.http://www.advisorperspectives.com/dshort/updates/Market-Cap-to-GDP.php
Gold will continue general downtrend probably until 2nd half of 2015 when more QE will be deemed necessary to help faltering global economy. Until then gold is likely to trade in a range of 900-1000 euro/us$ that has held for gold all year.
Recent bounce is off 900 euro bottom, 1000 euro will probably be top. Both are fighting the rising US$.
http://stockcharts.com/h-sc/ui?s=$GOLD:$EURUSD&p=D&yr=1&mn=0&dy=0&id=p22993123412
Hi Andre
Thank you for that post, I hope I am not misunderstanding you, forgive me I know very little regarding the Moon, but you feel it’s up next week, and the trend will carry on into Jan /March 2015, I think P White also see this, and a few others too,it does sound very plausible.
But I’m struggling to comprehend this but also very excited if that’s what plays out.
If I use the SPX as an example rather than the DJ which only has 30 companies.
The SPX has risen this year from 1800 in Jan to 2030 Nov about 13% without any correction apart from a correction on 10/15th Oct 2020 to 1820 (10% decline)
A powerful V correction occurred from 1820 to ATH shy of 2040 in 3 weeks (13% increase)
But you a some others feel the market will carry on rising for another 3 months? I’m not arguing that point at all, in fact I am extremely excited.
The reason being I have layered short well underneath 2000 on the SPX
From what I see(not from here) the medias most extreme bulls are calling 2150/2200 as the top before a massive collapses. That’s only 5%/6% away from where it is now.
So as it climbs I slot in more auto shorts 4% below current, any 5% fall will only trigger one position, if it climbs up to the mother of all heights without any correction the fall (when it happens) would be tremendous and trigger every short installed.
I’m sure I’m not the only one thinking this.
Unfortunately I cannot see the market making it that easy for me.
I fear a healthy correction will occurs now for a bulls Xmas rally.. (5% correction now to 1920 then a fast hard push to 2150/2200.
If that happens I’ll close all auto shorts prob lose a bit being to slow to react or B/E
I will be be watching the next 10 trading days closely on the SPX, no correction and a continued melt up up will fill me with so much excitement.
I’m not expecting a reply, just airing my thoughts.
Let’s air some back.
I simply believe gravity is the major driver of financial markets. Strong gravity means markets down and visa versa. And this gravitational trend – that I analyze on multiple levels, is still up. So in my thinking the market must go up. I expect a higher low early December before the last leg up. Gravity gives timing and direction but not price levels. Still, the ultimate all time high in jan/feb is certainly possible.
erick, I would agree with that view on the
next two weeks, if markets remain strong
until then anyone short after this is likely
to be crushed.
I think the crash window has closed, other than
a full scale Ukraine invasion, however there remains
some scope for a downside retrace given this
Incredible rebound.
Tom & Phil. I’ve been 100% short since August. Had made a tons during the correction on 10/15, and given back a tons the past couple of weeks. Honestly, I am mentally reaching a point of capitulating on my short positions after the firework in the SM the past few weeks. And I am as confused as ever. This is probably the strongest ever corrective move that I have ever seen in my 15 years trading experience.
The movement the past 2 weeks has crushed my previous EW count. I redid my count, plus the cycle and geocosmics study. My conclusion is that there will be no crash in 2014 (I am hoping I would be wrong, since I am very much buying into John’s great study of the potential crash). My count shows a sell-off during the next 2 weeks, which will present another opportunity for buying on dip. The markets then will bounce back strong for one last time before a devastating crash some time in 2015. I applaud those who stay in crash. SMART MOVE I have to say. Over the years, I’ve learned to trade NOT to lose money, not to trade hoping for home run, then the profit will very much take care of itself. I believe that 2015 will be a terrible year being in the stock market. However, precious metals, or oil, or natural gas would be a better places to invest. From the risk management standpoint, after the blow-off phase later this year or 2015, it will make sense to begin short positions in the SM.
Correction: Misspelled. I meant I applaud those who stay in CASH position.
Interesting commentary on the Solar Cycle as it relates to Natural Gas.
http://majormarketmovements.com/natural-gas-price-chart-patterns-suggest-major-run-upside-underway/
Hi Andre
Thank you for that post, I hope I am not misunderstanding you, forgive me I know very little regarding the Moon, but you feel it’s up next week, and the trend will carry on into Jan /March 2015, I think P White also see this, and a few others too,it does sound very plausible.
But I’m struggling to comprehend this but also very excited if that’s what plays out.
If I use the SPX as an example rather than the DJ which only has 30 companies.
The SPX has risen this year from 1800 in Jan to 2030 Nov about 13% without any correction apart from a correction on 10/15th Oct 2020 to 1820 (10% decline)
A powerful V correction occurred from 1820 to ATH shy of 2040 in 3 weeks (13% increase)
But you a some others feel the market will carry on rising for another 3 months? I’m not arguing that point at all, in fact I am extremely excited.
The reason being I have layered short well underneath 2000 on the SPX
From what I see(not from here) the medias most extreme bulls are calling 2150/2200 as the top before a massive collapses. That’s only 5%/6% away from where it is now.
So as it climbs I slot in more auto shorts 4% below current, any 5% fall will only trigger one position, if it climbs up to the mother of all heights without any correction the fall (when it happens) would be tremendous and trigger every short installed.
I’m sure I’m not the only one thinking this.
Unfortunately I cannot see the market making it that easy for me.
I fear a healthy correction will occurs now for a bulls Xmas rally.. (5% correction now to 1920 then a fast hard push to 2150/2200.
If that happens I’ll close all auto shorts prob lose a bit being to slow to react or B/E
I will be be watching the next 10 trading days closely on the SPX, no correction and a continued melt up up will fill me with so much excitement.
I’m not expecting a reply, just airing my thoughts.
Sorry everyone posted it twice in error. Sorry
John, how can I post a chart here? tia
Peggy
To all: post a web link to the chart in a new line and it will appear. If you don’t have a web link you can send me the chart and I can upload it.
Aaron, I have no great TA knowledge or any
all seeing system, so my views are based on
my best guess only.
Unlike many who post here I do not trade either
an index , commodities etc, I trade LSE listed stocks
and never use margin.
I like and admire John’s work as he utilises so many
different indicators, the effort John makes is incredible.
Why I remain more bullish than many here,
Is a firm believe that the US business cycle has to
be about to turn before a bear market begins,
even allowing for the market being a discounting
mechanism I see no clear sign of this, yet.
You can have rapid sentiment swings within a continuing
bull market, as with October’s price action.
Currently we lack a cathylst for a new bear market,
but ultimately CB’s cannot abolish the cycle and once
that turns the bull market will rapidly die.
guesses and beliefs! bring on the PRIESTS!
ATH ATH ATH ATH ATH ATH
Elvis, take 2 WCG and call in the morning.
What he said.
Thank you Phil for your explanation, I appriciated your input. Like before sound very plausible outcome.
Just can’t believe the market will let me do it.
I have two ftse longs running, so hopefully catch the upside of those, in the short term.
I agree This site is one of the best iv seen in years, John work is extremely informative, and he tell you as it is. I like his open minded veiw of both sides.
DJ, I am convinced he is going a bit off the deep end. He tells anyone that talks of gold manipulation that they have S&#T for brains and that thereis no gold manipulation and then comes out with that jargon.
Agreed. Gold manipulation is obvious and easy to prove if you study the gold market as long as I have (thousands of hours, at least). The only way someone can believe there is no manipulation is to be unintelligent or willfully ignorant. Since Armstrong doesn’t seem to be the former, he must be the latter. In fairness, Doug Casey, who has taught me more about investing than anyone else, also says (at least publicly) there’s no manipulation in the gold market.
I have a secret to tell anyone who believes the gold price isn’t manipulated: EVERY market is manipulated. Why should gold be any different?
The FTSE chart, along with CAC and the DAX look quite sick to me…….but good luck! I will only go long the FTSE if we clear the 6610 resistance area on at least one close preferably more or on momentum – until then I sell the rallies which is what the price action has been doing at times each day for the past 2-3 sessions….on the DOW it has been the opposite in the same period.
imho
J
regarding Europe it would not be unwise to wait for a collapse of the euro or at least a default by GREECE. check the chart for NBG and also Deutsche bank. UGLY. DB carries a record EUR 55 trillion in derivatives… the stock has lost 50% over last 60 months
i say 2007 started in the US, 2014 or 2015 will start from Europe.
as for gold it could kiss $800 in a technical aspect. the CBs are of course doing all they can to avoid a 2007 part II. but can they succeed ? we are running on fumes or are we FOREVER with zero interest rates or almost between the CBs and the bnaks ? total deflationary currency war ?
the safest approach now is cash especially if you have hundreds of percent in gains and some high dividends REITs ( even if taxed as income), which for many reflect the changing housing market in the US: more renters and less buyers.
I went long on ftse just under 6400, so ATM I’m up 180pts, I’m not worried about ftse as it lagging so far behind. If it does fall 200pts there will be a good reason behind it.
It will just chug along on 2 star full, while USA stays on coke till the reds are required.
Just a note on Jeff’s work at the Greedometer site vs. John’s here. Jeff’s Greedometers have greater granularity (accuracy over shorter time frames) than John’s methodology, but John’s analysis is more comprehensive and better in certain ways, his spot-on analysis of gold’s current counter-cyclical condition (vs. the major U.S. stock market indices) being the prime example. Jeff at Greedometer.com believes gold will get hammered this time around, just like in 2008, when the stock market gets hammered. He will prove to be incorrect, and John’s analysis will prove to be superior in this regard.
Cheers DJ
New post is out, thanks everyone