
The most common idea I’m reading on Twitter currently is that the current stock market correction is an echo of July 2007, implying a rally back up to marginal new highs may be next. However, these traders are mistaken in where we are in the topping process.
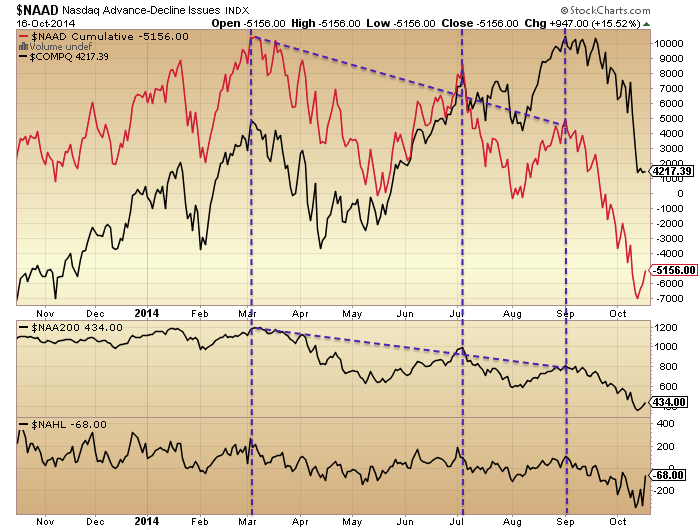
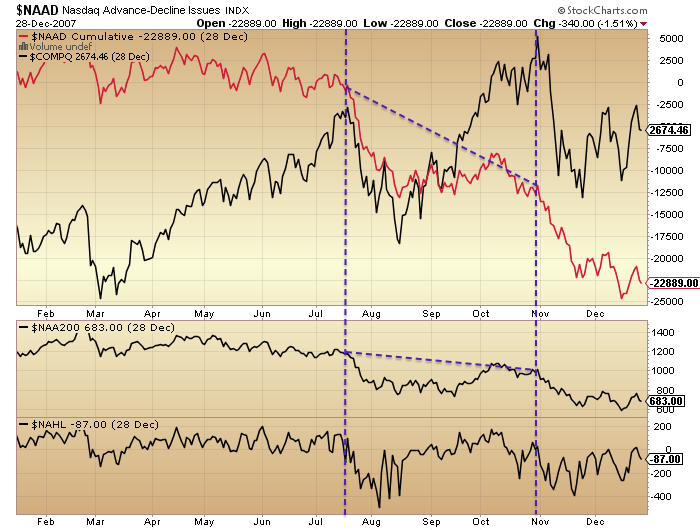
Comparing 2000, 2007, 2011 and 2014 tops, here are two measures of Nasdaq breadth: cumulative advance-declines and stocks over 200MA (the latter not available for 2000). Breadth diverges at stock market peaks. All 4 periods saw a topping process lasting around 6 months with 3 Nasdaq peaks. Over the 6 months and from the 1st to last peak we saw consistent degradation of breadth.
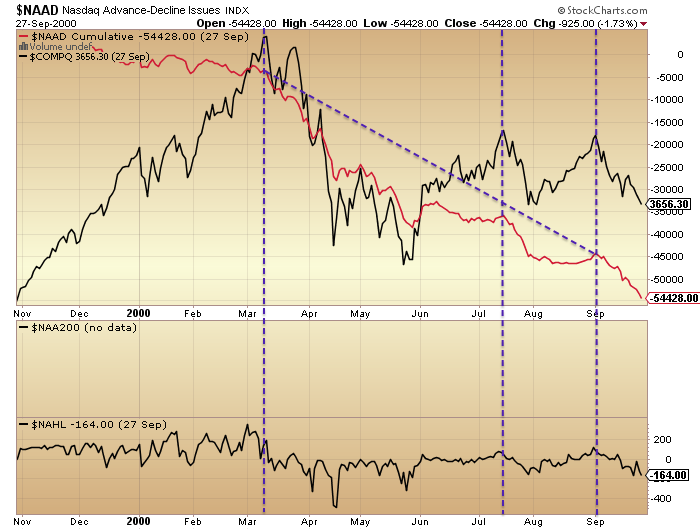
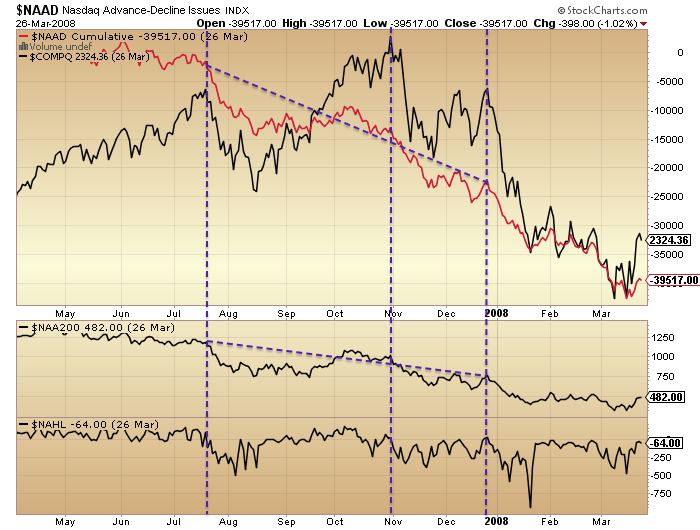
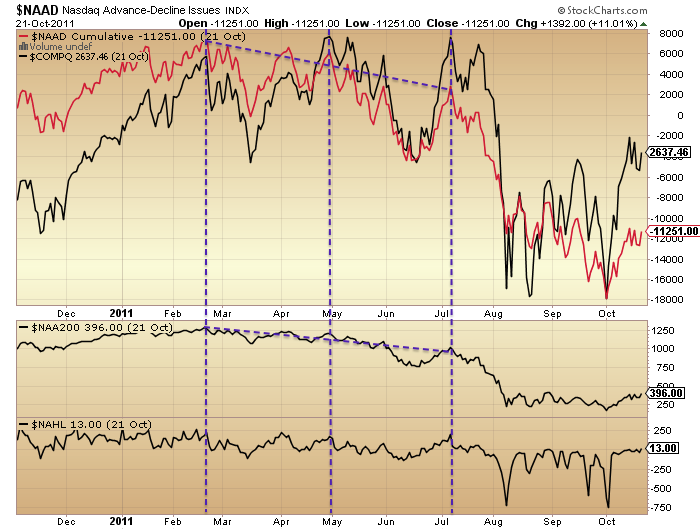
Source: Stockcharts
The last chart shows that here in 2014 we have also seen a 6 month topping process with 3 Nasdaq peaks and both breadth measures diverging from the 1st to the last peak. If we were now in July 2007 then we should be at the start of the topping process, about to begin the breadth divergences. Instead the comparisons put us at the end of the topping process, akin to December 2007.
Next, here is the SP500 versus three different indicators of a market peak: high yield bonds to treasuries ratio (not available for 2000), consumer discretionary sector to utilities ratio, and Dow-gold ratio. They also all typically diverge during a topping process, showing an underlying shift to defensives. Once again we see in all periods the 3-peaked 6-month topping process, and the divergences beginning at the 1st peak and completing by the final peak.
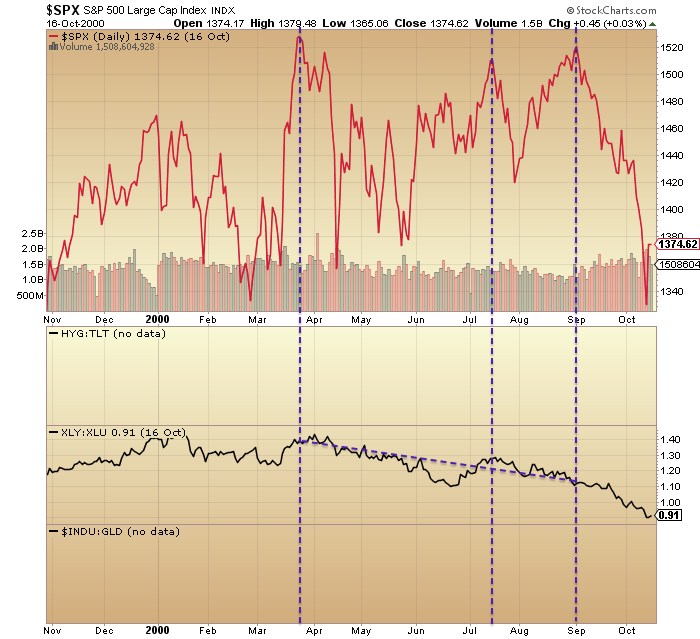
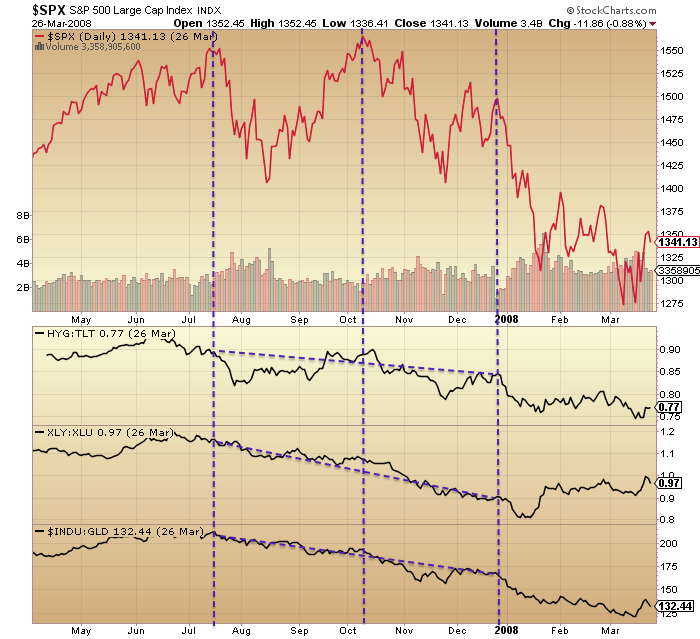
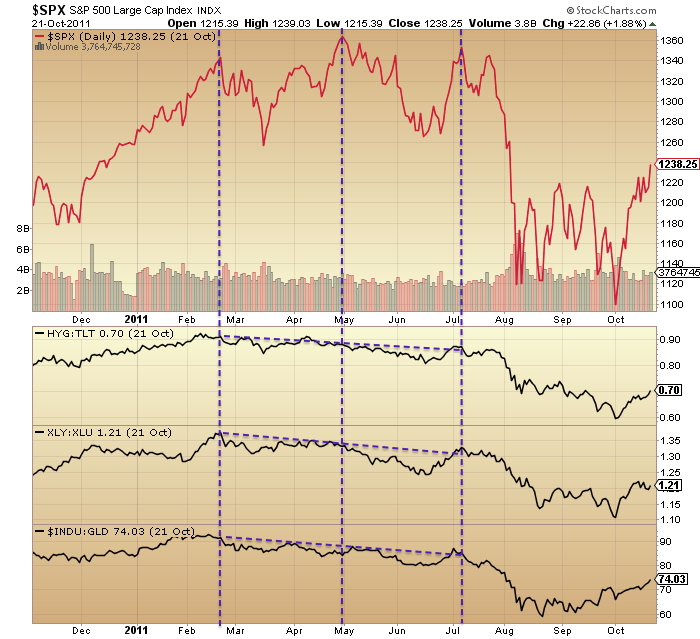
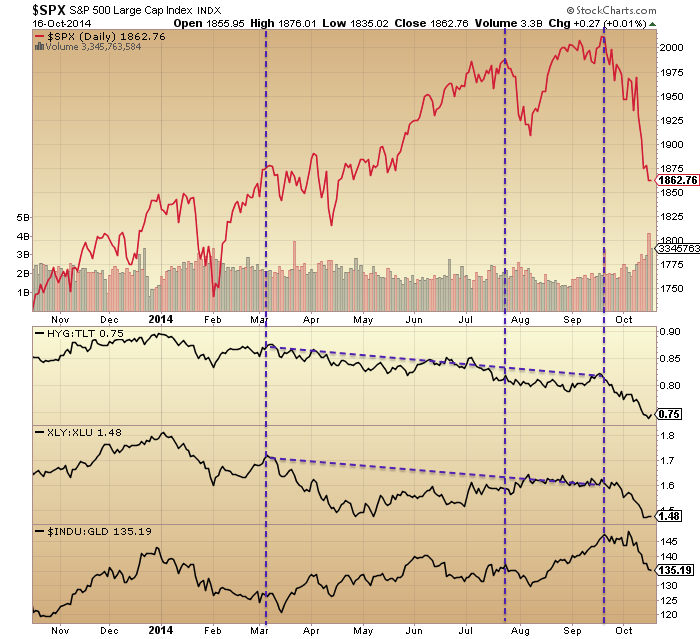 The last chart shows 2014 has produced an anomaly in the Dow-gold ratio (it is flat, rather than down, for the year), but the other two indicators mirror the previous peaks, and again their progression would put us in December 2007 not July 2007.
I’d like to stress I don’t think 2007 is the best mirror (in case you are now studying the action post December 2007). 2000 was a solar maximum like 2014, and shows marked similarities in Rydex and Q-ratio, amongst others. I have made a case that 1937 is the most appropriate mirror from history, but most indicator data does not stretch back that far. Rather, my aim here is to disprove the idea that we are at the beginning of a topping process.
Next, here is margin debt. Whether we measure from real margin debt peak to real SP500 monthly peak, or from nominal margin debt peak to the end of the nominal topping process (the third peak), the range is between 3 and 7 months from margin debt peaking to the market beginning major declines in earnest. So it is another leading indicator, or divergent during the topping process.
Source: DShort / My annotations
In 2014, margin debt peaked in February and given market declines in September and October we can be confident that peak will continue to be honoured. This again makes a case for stocks now being at the end of the topping process, tipping into the major declines.
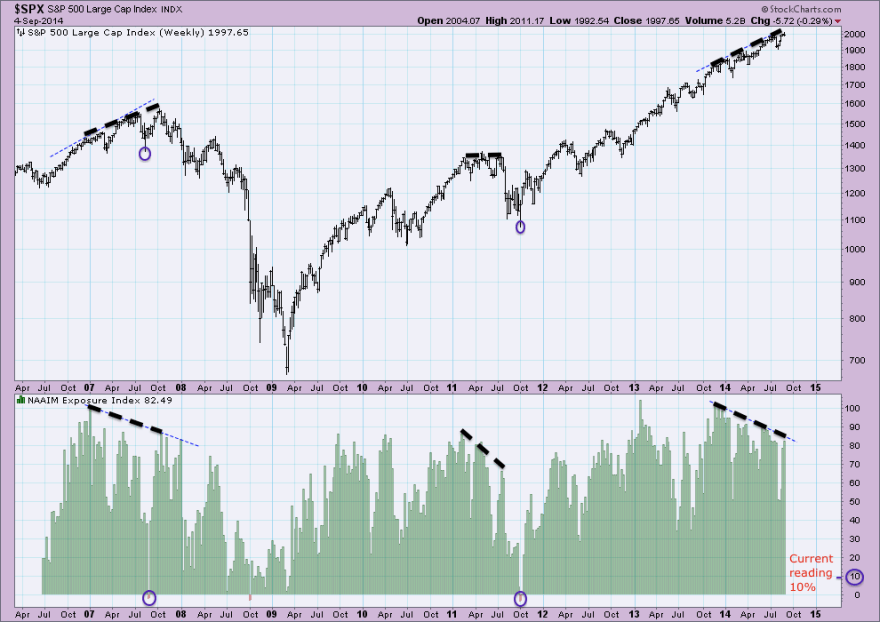
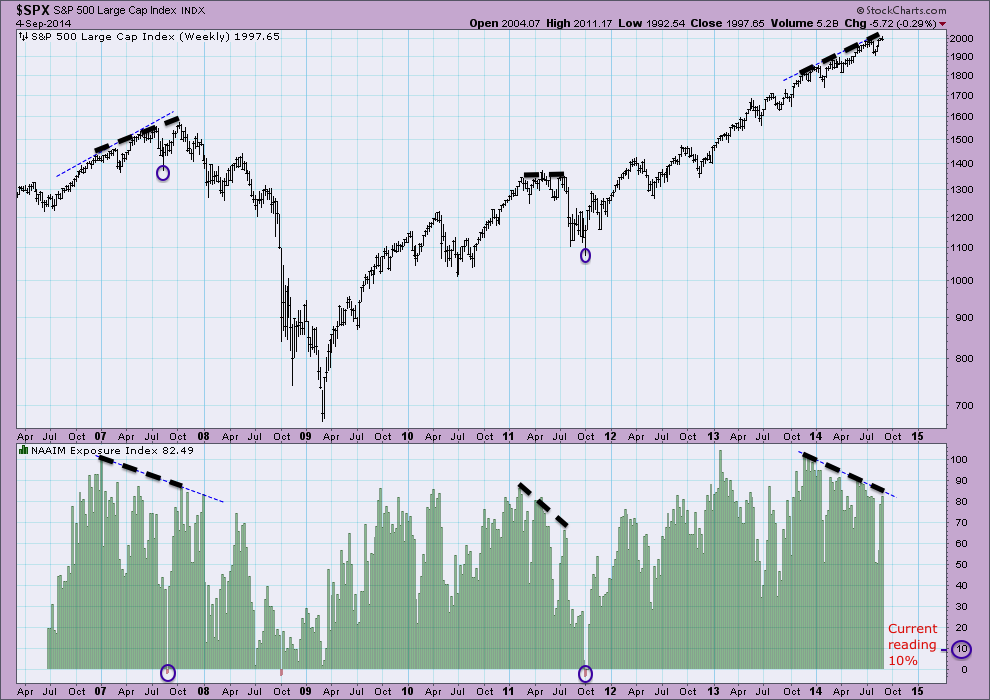
And lastly, NAAIM manager exposure to equities is also doing the rounds on Twitter currently, due to the latest reading having sunk to 10% (note this chart below is from 4 Sept so I have added the latest reading). The chart shows that NAAIM is smart money, or again a leading indicator / divergent during the topping process.
Source: Acting-Man / My annotations
The period of divergence in 2014 echoes that in 2007. Once again, this suggests we should be at the end of the topping process, not the beginning. We can see that NAAIM actually went negative in the corrections of July/August 2007 and Sept/Oct 2011, so lower than +10% is possible, but rare. We can also see that in January 2008, just after the topping process completed in December 2007, NAAIM dropped sharply to just over 10%, and this in fact reflected the true start of the bear market, rather than a washout buying opportunity. Given the other indicators above would also position us in January 2008, and around 40 indicators called a bull market peak this year, then this is also most likely the tipping point into real bear market declines, not a buying opportunity.
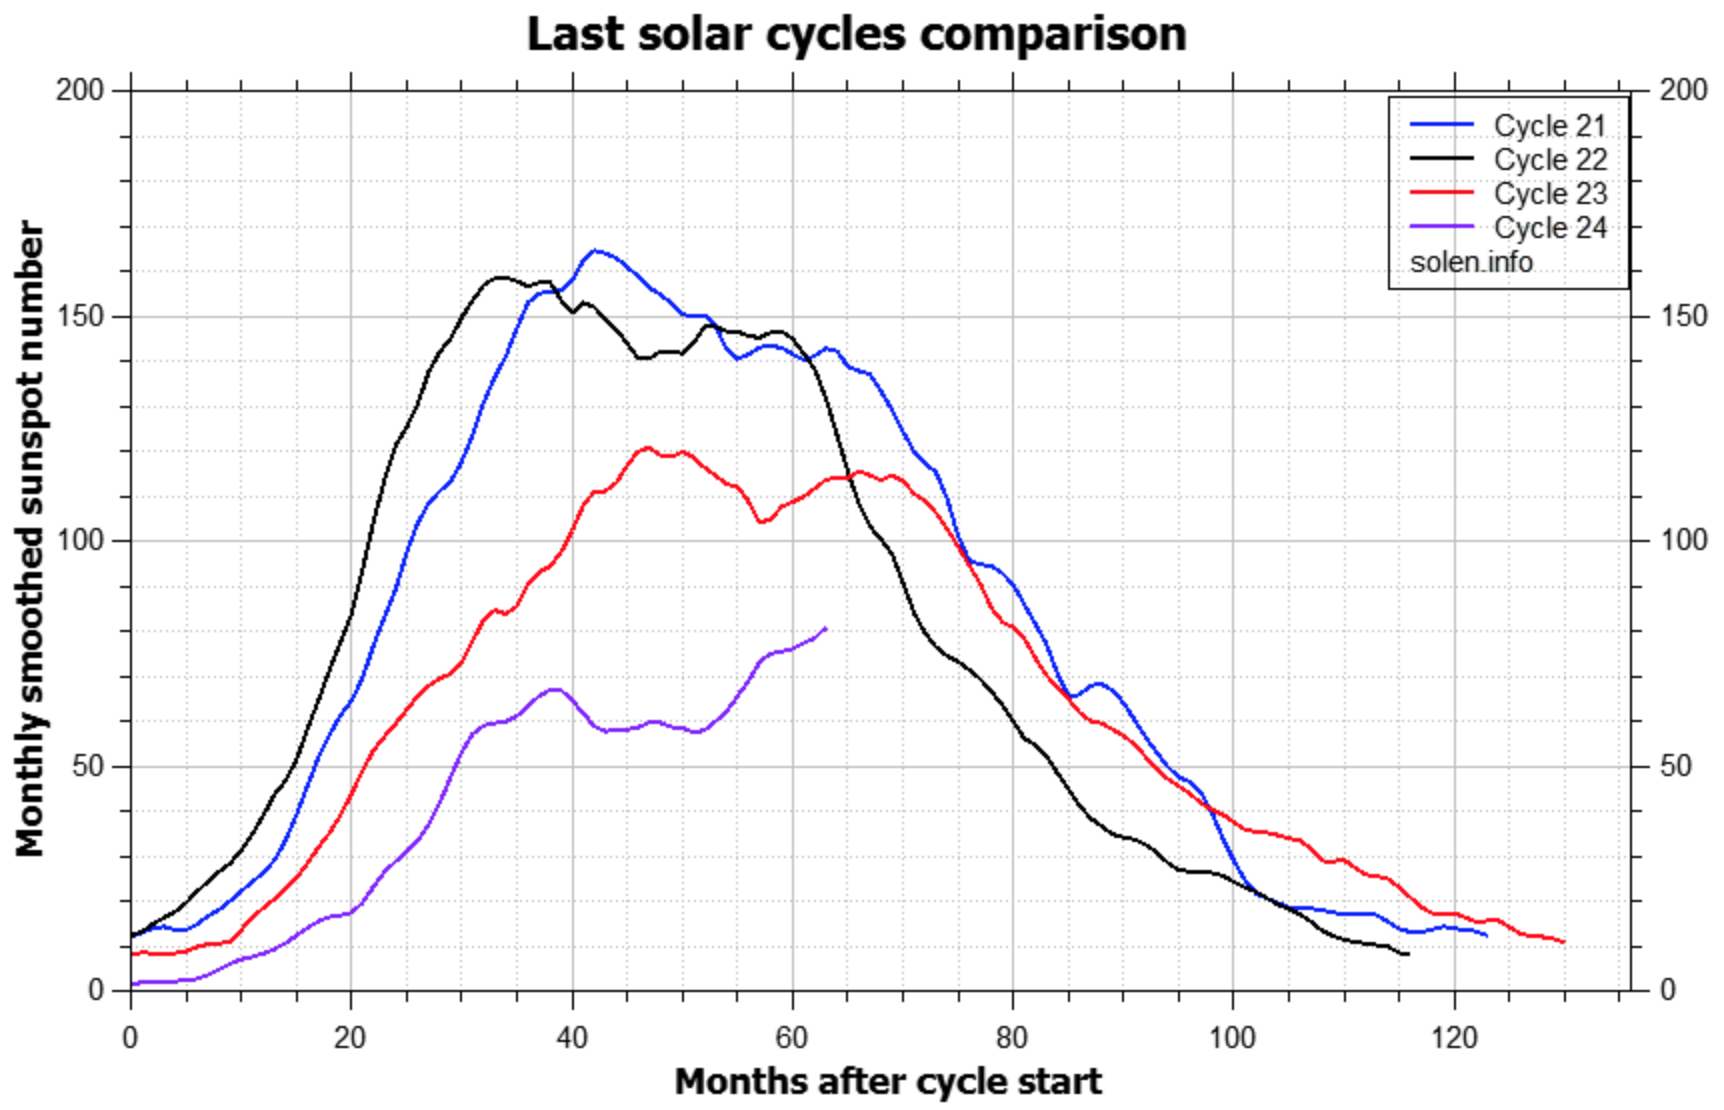
Finally for today, just a quick note on the 64-month bubble idea (this article). Cal referred this latest update to me and WT suggested the same conclusion that I will. The writer claims that bubbles last 64-65 months from start to peak. Having done my own calculations, I argue he has used some artistic licence, because the range of his examples are rather from 36-85 months. Various start dates that he has used are highly questionable. Nonetheless, if we give him some leeway then the range could be tightened up to perhaps +/-10 months around 64, and this broadly fits with the period from solar minimum to solar maximum, or from a speculation low to a speculation peak. Some of his examples are exactly that, e.g. the Nasdaq into 2000 or the Nikkei into 1989.
 Source: Solen
He doesn’t have a compelling reason for why bubbles would last 64 months, and that’s not good enough for me. Whatever the discipline or angle, I want to see a correlation and a scientific or logical reasoning for it. So in short, the data suggests a range for bubble durations, making his quote an average at best, and it fits the solar cycle duration, for which we have evidence of biological effects on humans that cause fluctuations in excitement and speculation. Ultimately, trying to time a peak using a 64-month calculation is likely to fail.
To the markets short term. Yesterday produced a doji candle in US large caps so we roll over to today. The balance of evidence still suggests we are post-second-chance, or post-3rd-and-final-peak in the above analysis today. Therefore, there should be no rally back up towards the highs and I believe we will soon engulf Wednesday’s candle to the downside.
What today’s analysis shows is that the anomaly is in price here in 2014, in that the July and September highs were higher highs in the SP500 and Nasdaq, making for what looks like an uptrend rather than a 3-peaked topping process. But in fact the behind-the-scenes indicators reveal the topping process and that those September highs are equivalent to September 2000, December 2007, or July 2011. Much later in the topping process than many analysts think. What’s also important to note is that those three topping processes all involved a decent correction during their formation, whilst in 2014 a meaningful correction has been avoided until now. That implies we have stored up a mega-correction, and this idea has support from indicators such as Investors Intelligence, Skew and Rydex which have been held at major extremes this year, like highly stretched elastic bands. Therefore, not only are we now most likely already in true bear market declines, but there is a strong likelihood of a crash akin to 1929, 1987 or 2008 at the centre of those declines. Most analysts are going to be completely wrong-footed by what transpires.
Recall that Rydex, margin debt, loan issuance, Investors Intelligence, fund manager allocations, household allocations and other indicators collectively revealed a situation of stock market participants being all-in on equities with totally lop-sided portfolios and having taken on as much borrowing as they could to further invest. Maximum speculation as generated by the solar maximum. I referred to his before in trying to gauge ‘fuel spent’ for the stock market, as it strongly looked like we had reached saturation.
Now here we are in Q4 2014 post-solar-maximum, with people unwittingly less keen to the buy the dip, and even less so at the seasonal geomagnetic sentiment low of October. We saw a change in market character in September, at which point I believe the smart longs got out. The falls in October to a lower low and sub 200MA cemented the new reality and the next level of players exited. The next development I believe is that we see no rally back up towards the highs but instead collapse further and sharper, at which point the remaining dumb money will be scrambling for the exits, resulting in a crash. Because, the point is, all those indicators collectively showed that we had reached effective market saturation: no bears left to convert, no more fuel to buy, and tremendous lop-sidedness. With a demographic headwind, the market needed the steep increase in leverage to push it higher, but this has to be fully repaid and history argues by way of forced redemption panic selling. Who will step in to buy and shore the market up? All those indicators plus collective demographics in the major nations suggest the queue to buy the stock market is now fairly empty. Therefore, the current trickle over to the bear camp, to selling and shorting, has very little counterbalance. Stock market declines should therefore come easy, and once the trickle becomes a flow, the market should accordingly crash.

JOHN, if you are proved correct, i salute you, and this post will be your finest yet.
Thanks Robbie, we’ll see
John,
Thank you much for your EXCELLENT analysis – truly amazing! I’m a newbie here and so glad I came across your website. Really appreciate your work.
Thank you Kent for setting Allan straight on Gold going nowhere.
Another good reading. Thanks!
The bounce in the markets is actually taking place. I agree that there will be no second chance at this year highs, but i see at least retracement to 190x (at the time i am writing this, bulls are fighting with 23,6% fibonaci retracement line).
August 2014 meets with 38,3% retracement level -> that might be next problem.
Whatever we are planning, everything might change if Ms Yellen tells today that QE will be prolonged 🙂
Erudite as ever, thanks John.
Thanks both
Thanks John, my greatest admiration as always, but unfortunately this time I disagree. i think we are not yet post second chance as yesterdays strong reversal in the DAX and strong performance of Biotech and R2k also indicate.
Not always happy to be proven wrong but happy to live and learn.
Cheers
I’ll just the only thing I actually disagree on is whether we are post seond chance or not.
On the issue of comparing now with 2007, I have said all along that the best comparison is 2000 and thus that is why I believe that those that expect the USD, gold and gold stocks to perform as in 2007 are mistaken.
Gold stocks bottomed inline with the market top in 2000 and began a tumultuous climb that saw many gold stocks rise 1000% or more.
I believe now prsents as the best opportunity I have ever seen to buy gold stocks. Even more so than 1976 or 2000
If we instead rally back up towards the highs then we will print anomalies in the indicators rather than in price, but because there are several different indicators I have my doubts. We can look at the R2K as a key test. It has more clearly put in the topping process pattern and since broke down. Either it now breaks back up into the range, or it backtests the break and falls again.
John, I think the key here is that we both agree that all along it is the R2k that has most been behaving in tune with the SC and it is by no coincidence the index that looked more like a bubble.
As a consequence of that I would not be surprised to see the R2k top very quickly on this rebound, whilst the other indices continue higher for a few days before following the R2k to reverse back down.
I really don’t know if that is how it is going to play out, but thereversal in the DAX yesterday was very convincing and follow through this morning is confirming it is the real deal amd we know that the DAX and R2 k have been performing in sync.
For that reason I remain alert and open and also notwithstanding the fact that I saw patterns and behaviour emerging on Wednesday that pushed me into cash.
So far it looks to have been the correct move but knowing how big downsides unfold a huge bearish engulfing candle could ome out of nowhere.
Like I said I remain alert and ready to go long VIX again at the slightest sign of reversal.
NO way. Gold is in a long term BEAR Market and will stay that way for sometime. Yes for sure there will be bounces from time to time – but reality is that Gold for now is a dead duck.
joe, there is absolutely ZERO evidence to suggest that gold is now in a long term bear market and if there is please provide it.
May I suggest that you also study the period 1971 to 1976.
Cheers
Ditto to Joe the Truth Teller. As to Allan and no evidence that gold is in a bear mkt. One is gold is extremely overvalued. When adjusted for long term inflation and relative to real estate over long periods of time, it is worth about $500 to $ 600 dollars. Commodities peak about every 30 years at the end of a ten year straight up run, 2011, 1980, 1950, 1920, etc. 15 to 20 year bear market after those peaks. It fits with Gann’s Master Time Factor which is a 60 year cycle as well. The 8 year cycle is due to bottom in two years, and the 3 year in 7 or 8 months. The Central Banks have “printed” more money than in the history of the world and gold is in a three year bear during that printing spree. Deflation seems to be the best explanation to all the phenomena we are seeing in the markets now which should take the market down. The 1930’s saw the government raised the price to get inflation. It is hard to imagine the gov’t’s trying that this time, but anything is possible. Finally, the long term chart of gold looks horrible.http://www.mrci.com/pdf/gc.pdf That triple bottom actually looks like a triangle 4, just like silver which has already broken down. Also commodities have had a huge and clear Elliott wave 5 count up since the major bottom in 1932. I think that means at least a 50% drop from the highs.
There is plenty of evidence to suggest that Gold is in a bear market. Lower swing highs and lower swing lows. That pattern has continued consistently since the high was made at 1900. When that pattern changes to one of higher swing highs and higher swing lows, that will suggest that Gold has moved into a bull market again.
John this post is a MASTER CLASS in analysing the data behind the ‘picture’. Wow….just WOW!!
Thanks.
Cheers
Excellent analysis with clear think John.
It looks like we go up some more because we are oversold, but then down again hard we go because we are not done yet with the collective wave 3s down.
Yes, according to the wave count, we are at the end rather than the beginning of the topping process. Expect a crash, at least big scary down days by the middle to end of November. Looks like the long awaited crash is now coming. And folks think all the charts look nasty now, wait a few more weeks to see when everything throws up.
Thanks Mae
Hi John, at what SPY/RUT level you exit your short? In other words are you targeting 1600-1650 SPX level or even lower? Thank you for the thorough market analysis! Best to you!
Looking for a min 18% in large caps, and expect RUT to be more than that from the peak. But cross-referencing with indicators. So if the true washout as shown by indicators comes before the 18% I would take some profits. What’s missing from Wednesday’s low: no Trin spike, no positive divergences (one-legged declines so far), no washout in Investors Intelligence, no small caps participation in the falls.
Thank you John for your prompt response… market is currently flying high as if the QE cocaine addicted big boys already know what Janet is going to say in the morning.
You do write great articels, John.
Without questioning your thesis, a few points:
-Chris Carolan’s work argues the window for a crash closes after october 20.
-Call-put ratio is very high, meaning the ingredient for a big a short covering rally is already in place.
-In 2007 governments where totally unprepared. These days they have proven to use whatever it takes to prop up the stockmarket. Swift may turn into a grind lower.
-With so many stocks already in a bearmarket, a bounce is not out of the question; a few big names bouncing can push the indices firmly higher from these levels.
-When the DAX is testing it’s neckline (H&S), it might give more clues on how the US indices will sail on from here.
Governments are ready? The governments are like keystone cops, have you seen the reaction to ebola. Luckily it is hard to spread or we would be in a real dilemma already. The Secret Service, on top of that. Obama care web site. They are unready.
The trannies yesterday broke back above its 200 dma and also above the neck line of an inverse head and shoulders that can be seen on the hourly charts that zi was keping a close eye on yeterday.
The neck line was just under 8k and the head at 7.7k so the target is 8.3 k.
That would concidently(not), target the 50 dma. As a consequence I suggest the SPX will also test its 50 in the days ahead.
http://stockcharts.com/h-sc/ui?s=$TRAN&p=D&b=5&g=0&id=p21954037561
Excuse my spelling again. It’s getting late here after a long week.
Amazing:
The longest sustained fall in real UK wages since records began in 1862
http://on.ft.com/103pEZh
that’s what’s keeping corporate profits high: slave labor
Opex today, by the way —
I read a lot things on internet but John synthesizes all things beautifully. Give me 3 months more to enjoy your blog before subscription offered. I have canceled my subscription of sentimentrader.com which good in terms of data but fewer and poorer comments and analysis.
For day trading, today is a buy day according to The Taylor Trading Technique. Meaning we can long or short both hands. At opening, if Sp going up then testing yesterday high, we can short at that high. However an inside day usually leads to breakout. So if Sp going down at the open, looking for long at 75-100% of yesterday true range added to yesterday close. All depends how SP behavior in the first hour of the US session. Other markets got inside days as well so breakout trading preferred
John,
I am continually amazed at not just the quality, but also the quantity of really good analysis you put out. As you can see from the comments posted over time, your analysis is highly regarded by both bull and bear, initiate or graduate. Thanks,
SC
Great post John….I love it!
In terms of Yellen, some commentary about the economy from a very good asset manager, Marketfield:
Of course the forced unwind of injudicious trades tells us much less about the
state of the economy or corporate sector than a decline which is driven by
multiple data points. Indeed going into this sell off the majority of US data
remained in comfortably positive territory and if anything was signaling a
modest acceleration in overall activity. Unfortunately we are still too early in
the earnings season to see if this has been reflected in corporate results but
there have been few signs of problems thus far.
If this is accurate, why would the Fed feel the need to extend QE? The data doesn’t support it and surely the Fed doesn’t target stock prices…or does it?
And to John’s point about engulfing Wednesday’s candle to the downside, if market participants are really counting on Yellen to suggest another QE program is in the offing today, then we really do have the ingredients for a huge reversal should she indicate such a policy shift is not in the cards.
This correction will go on for about 3 months IMO.
Thanks for the nice comments
“The Central Banks have “printed” more money than in the history of the world and gold is in a three year bear during that printing spree.”
This conveys a deep misunderstanding of what CBs have done and the monetary transmission mechanism. By this logic of the Fed “printing” money, we should then be seeing runaway inflation, which we’re not.
I would point readers to Pragmatic Capitalism and Cullen’s analysis of all things Fed/how the monetary transmission actually works in practice.
That is why I put the ” ” around printing. Many PM bulls state this as a bullish factor. I read Roche, also. Thanks
Kent, I understand you to say that since gold has been in a bear market during the Fed “printing spree” it is prima facie evidence the PM bulls are wrong, i.e., with so much printing going by CBs on gold prices should be much higher.
I am saying that logic doesn’t hold for reasons the Fed has not engaged in a printing program but rather an asset swap.
they have printed. they have bought treasuries with money that does not exist. that’s printing. What was formerly US Treasuries is now cash.
But printing alone doesn’t do doodly if the newly printed dollars are not getting into circulation. It’s my understanding that those newly created dollars are either sitting in banks’ reserve accounts at the Fed or that it’s made its way into the stock market. Another metric that affects inflation/deflation is velocity of money. Velocity of money has slowed way down which adds fuel to the fire of deflation.
If the Fed had printed and then helicoptered the money out to you and me, that money would have gotten into circulation immediately and velocity of money may have increased as well. That would likely have been inflationary. QE has certainly not been inflationary.
it’s not an asset swap because an asset swap would be trading one asset for another. when the Fed buys Treasuries in the QE program they are not trading money that they already have for those Treasuries. They are literally creating money out of thin air to “buy” the Treasuries. What they are doing is essentially monetizing US debt.
Kent, to wit I say, everything you state is circumstancial.
Gold remains in a long term uptrend, endof story and the decline from 2011 remains a correction.
Mate with utmost respect the deflation argument being bad for gold, or the reverse ie., inflation good is just not the case. Look at what happened during deflationary pressures in 2000.
Like I said, show me evidence that gold is in long term bear market?…..there is none.
Everything is in a long term uptrend. But as I said to my super goldbug friend, can you wait 20 or 30 years to the next upleg. He and I are getting too old for that.
Mate I am not a gold bug just as I am not a perma bear or perma bull, however the trend remains up and the same conditions tjat propelled gold in 2000 are in place now.
Two weeks ago nearly everyone was telling me that if the stock markets took a big hit gold would tank and the dollar would fly amd what happened?…..the exact reverse.
Cheers
how do you define “trend”? Looking at a weekly chart of gold, in my opinion it’s been in a downtrend since late 2011. More than 3 years of declining prices. And it’s not over. We could see $800 gold in the next 6 months.
THREE DAY HITS. I have observed that big declines have 3 day moves. Gann said markets correct over 3 day, 3 weeks or 3 months. Wednesday was the low. Yesterday was up (inside day), and today will be the third day. Many times the reversal or engulfing John refers to should begin today. We”ll see.
well ive added to my already large RUT short at 1195
JOHN, when I look back at other market peaks in terms of price action only (looking at the chart) I cant find any that start like we see in todays chart, basically they all start with a wave lower then wave 2 up before the real selling kicks in wave 3. But what your saying is that we just keep falling from here (your preferred scenario)
I’m guessing John is looking for that Wave 3 to the downside to start any time…
He’s not calling it a Wave 3, but if/when it occurs, I’m sure the EW’ers will….
Also, up to 83% net short as of this AM’s open…
Will short more at higher numbers….
Dow still hasn’t had a 10% correction so this is likely a bull trap. FED cannot go and increase QE as it just sends a message that without QE the global economy will be ruined. Hoping dissapointment from Yellen will drop markets heavily and the selling can continue next week! U.S. earnings still looking good but will they be in the coming quarters. I’m not so sure…
There is an anomaly in either price pattern or indicators. My case is that several indicators have to be wrong, so odds are price has the anomaly.
John, Trendline chart service by Standards and Poors. has published the % of stocks over their 200 day moving average since at least the 1970’s. The chart had a dotted line at 70% and 30%. When it fell below 70, it would usually drop below 30 and when it went above 30 it would usually go to 70. Actually, a good medium to long indicator. I hope your great research abilities can find it.
This has been an adage employed for years by Tom Dorsey of Dorsey Wright.
Kent, Do you have a link? THX
Are you saying you can’t find it now but once could?
I used to get Trendline chart book (in the 70’s and 80’s) from S&P which printed the data in their indicator section, along with A/D, short term oscilator, etc. Do not know how to get on line, as S&P wants big bucks for everything they have. I was hoping this could narrow your search as you access an incredible amount of data. Sorry I could not be more helpful.
The strength of this move up in junk (not to mention credit markets in general) is disconcerting for the bears
Gary it is exactly what was needed to lead to the next huge drop IMO.
I agree but I would like to see a sell off in the Dow before close. Going into the weekend so positive would not be so great for the immediate bear case. It may suggest a bigger retrace than anticipated.
I understand, Allan, believe me. Since I am a believer in the “credit guys are the smartest guys in the room” adage, I just would like to see a little less enthusiasm here, that’s all, lol.
great post John. Thank you!!
Prediction into year end is for $ up, Euro down, Yen up, Commodities down, Stocks down, Treasuries up.
Anecdotal evidence from where I live noticed 5 houses for sale or rent at a near-by road crossing. Believe we have to understand de-leveraging here as it works itself through the economy. The recent move down in commodities and up in Treasuries certainly caused margin calls. The 2 heavy weights for the wealth effect are the stock and housing market. Once you see liquidation in those 2 markets (estimated at $35tr in value for the US) it will depress the economy as well.
I also went back to John’s post on the 1937 analog.
My conclusion is that the market behaves quite similar here. According to the 1937 analog the retrace of the first move down concludes around 1914 with the 3rd wave down finding support around 1625 or supporting what John concluded above.
We’re into the 1895 point, which I was hoping we’d see…
My next level I was thinking is 1918, which is close enough to your 1914…
Works for me… 🙂
137% net short here…..
The market looks like it’s getting everybody all bulled-up for the weekend….
Perfect… 😉
Looking for VIX target of 18 at which point I go triple down.
yen in uptrend versus both Euro and $ and at channel support versus the latter would not support a further retracement higher in stocks here is my view
I’ve added short here
What is your main thought about the last four days, just oversold bounce with a short squeeze back to 1,900? Its been an impressive 70 handle rally. Bulls have definitely fought back. Russell is lagging after leading the last three, perhaps a turn coming…
Just per my pieces of analysis this week. Unlikely to be a v-bounce back up – should see at least a retest of the lows on positive divergences. Unlikely to head back up towards the highs, per various indicators. So expecting this move to fail.
me too but only small positions and bought some bonds tlt BUT this is pretty dangerous both ways
have a number of short term positive divergences and buys like ADX setting up
but this is a perfect place for a fail as the internals are barely getting off the floor
http://stockcharts.com/h-sc/ui?s=$NYDEC&p=W&st=2011-10-24&en=today&id=p24043346724&a=371782288&r=1413561251847&cmd=print
John, what’s the view on gold miners now ?
Thank you
For gold, we need to see equities tank. When it’s beyond doubt that the dip isn’t being bought then I expect gold to short squeeze. Gold miners isn’t clear – ultimately they should rally counter to stocks, but whether they can escape a initial panic sell off in stocks we will see.
Re-entering short position. But frankly, I am ready to accept this will go even higher then 50 DMA at S&P 1906 and this is small bet. On the other hand I prefer to stay short for the weekend as there is always chance we will finally have Black Monday..
By the way, ES contract is now at 1890, exactly 38.2% retracement of 200 handle move from 2014 to 1813.
watch the VO and the AD here
Very tenuous for the bull case BUT since we are above 1887 resistance is now support on 60 min time frame
http://stockcharts.com/h-sc/ui?s=$NYUD&p=D&yr=0&mn=7&dy=11&id=p68897809979&a=367854604&r=1413561505578&cmd=print
http://stockcharts.com/h-sc/ui?s=$SPX&p=60&yr=0&mn=1&dy=21&id=p48588965182&a=371540783&r=1413562082747&cmd=print
1877 is my new revised bull bear line due to a review of the 4 hour charts
a very interesting gap is there
1877 is very important on a number of time frames – this 2 day chart shows
why I think
looks like this is going to reverse pretty good but if 1877 holds the short term will flip green until end of next week?
BBE, the intraday charts of SPX are showing a possible complex inverse head and shoulders, neck line @ 1900.
If it breaks we are headed for 1980 whuch is more than coincidently close to the 50 dma.
My concern about going short too soon is the above and that the trannies is targeting its 50 dma based on a earlier inverse head and shoulders and also the strength in IBB.
Just to add, I would anticipate a pullback here to roughly 1880 SPX before taking another hit at 1900.
Sorry one more thing to add. If the SPX inverse head and shoulders unfolds amd the SPX targets its 50 dma that could form the right shoulder of a rather large head and shoulders top that could prove extremely telling.
http://stockcharts.com/h-sc/ui?s=$SPX&p=D&yr=1&mn=0&dy=0&id=p46774812131
again I dont see any inv hs patterns on spx time frames – could you post it?
and as for the big potential one that is like finger painting with your own blood! one day at a time…
I dont see the INvhs – on what time frame?
1877 looks to be comin up
if it blows then WCCG for everyone! all weekend LONG!
Whipped Cream Canned Gas?? Is that right?
I can’t stop chuckling here…. 🙂
!!!!!!!!!!!!!!!!!!!!!!!!!!!!!!!!!!!!!!!!!!!!!!!!!!!!!
thank you John for your reply. Russell 2000 is barely up, on a +300 point-day for the DOW. That’s a divergence….
IWM is hitting the resistance I highlighted yesterday it is the canary that was first poisoned
The big boys are announcing earnings next week. Earning has been mixed in the early inning of this quarter. Waiting for earning suprises on the downside to test this rebound rally.
Good point. I have always thought that companies with good earnings to announce want to get those out as early as possible while those who have bad news to report want to bury it by announcing later in the season. Understand I’ve not empirically tested this thesis, but if true, and early reports are only fair to middlin’, it would argue that surprises to the downside are indeed in the offing. And that, in my opinion, is what will take us down in the scenario John envisions.
Governments are using our future tax dollars to buy assets at the peak of a bubble to prevent it’s collapse. We’re in good hands.
like I said, finger painting with your own blood! lol
https://twitter.com/TheCharmSchool
We are making younger generations poorer, who in turn are less optimistic and less likely to start a family. This is a long term spiral that is just beginning.
The market rallied much before US open so SP doesn’t have much room to go further. If you long after the first 30 min red candle, you get 15-20 points. Not bad for Friday which usually get a narrowest range
I pretty sure people have the scoop their own poop and eat it gene embedded from
our decline into the split brain…this gene is reinforced through epigentics and repetitive cultural paradigms so that shit sandwiches are seen as nutrition.
this could be an epic reversal day leaving all the poo eaters finally with a bad taste in their mouths! roflmao!!!
Come on Elvis, stick to fried peanut butter and banana sandwiches. PLZ
got a recipe for an organic version?? SERIOUSLY!
bbe I love your humour…….oh and your charts. But it’s your humour that I like more.
http://stockcharts.com/h-sc/ui?s=$SPX&p=60&yr=0&mn=1&dy=21&id=t67720762015&a=371540783&r=1413563714889&cmd=print
60 min is failing at my original rally target – dont trust it though as everything is an attempted ambush here from both sides.
1877 is my short stop
UI on WLSH 2 hour is suggesting the bounce has legs – more sh…. on my bread please!
the rape of the retail left brains –
EPIC I say
Looks like a 38.2% R2K Fibonacci retracement and reversal? If so, might head straight down from here.
posted without even seeing your post directly above. any good resources WT? thanks.
Sorry, just used a chart tool on my trading platform. I am anticipating Fib reversals as confirmation of a one direction crash.
Implies to me that it is just short profit taking before reloading, and not buying the dip. The opposite of long profit taking reversals on the way up.
yeah, iwm failed right at the fractal 109 that I said yesterday was its doom
anyone have a good twitter resource for s&p fibonnaci analysis? thanks in advance.
Thanks John!!! As always great analysis. Hope you don’t mind me sharing my view of a possible scenario in the attached chart. Not to dissimilar to yours I would imagine. Cheers! http://bit.ly/1we4O3o
Russel is rolling over, Russel has been leading the broader market for the last few months
just noticed that Daneric has the same pattern on his 30 min that I’m using on my 60
agreeing with Daneric makes me nervous@! ha!
OMG!! OMG!! (twice is extraordinary for me…so you get double credit for that) You are fighting Daneric….where do I go to ‘double’ my bets on you? Lol
I remember daneric on the SKF boards back in 2008. Hasn’t he been calling for the drop since 2011? 🙂
http://stockcharts.com/h-sc/ui?s=$VIX&p=W&yr=5&mn=4&dy=0&id=p92114800193&a=371542335&r=1413571327507&cmd=print
I think VIX in a bear/topping market behaves differently than the bull market spikes in the chart. Might not be the buy signal that worked before.
http://stockcharts.com/h-sc/ui?s=$SPXA50R:$SPXA200R&p=D&st=2014-05-22&en=today&id=p98095160952&a=370507910&r=1413571839775&cmd=print
http://stockcharts.com/c-sc/sc?s=%24NYA&p=M&yr=18&mn=0&dy=5&id=p17242290911&a=213366018&r=572
Amen…
The Economist - Germany should invest money in infrastructure, not worry about balancing its budget http://econ.st/1F8bMga
???????????????????????????????????????????????????
more finger painting in our own blood
lol…japan has been doing that since 1990….only thing it’s done is triple its debt to gdp…it’s called deflation……the deflation monster has decades of debt to eat….
Actually, it all depends on how the money is spent. Here in America there are plenty of worthwhile projects that could be funded with ZIRP cash.
But if you think government can do nothing right then…
Infrastructure and city design is all based on cheap combustion fuels which are dwindling and not replaceable. The key is to give people incentive to stay put and stop scurrying around like manic cockroaches. If people have cheap food and heat they will be fine. I’m betting that governments will continually make wrong short-sighted decisions. When it pays off, robots can have my shitty job.
finger paint fantasies with your own blood not mine!
AAPL also hit a 50% Fibonacci and reversed.
the fail is failing! lol the cans are all empty and my hands are shaking!!!
Monday, Monday
With barely 15 minutes to go, it doesn’t look as there will be WCCG for everyone! all weekend LONG.
I knew a family who had a dog, a very nice creature. Every new year the owners changed his name into the dictator that was most popular at that time. The ruling of Rolf or Mao was long over, otherwise for sure they would have called him after..
so why wasnt the dog named Elizabeth?
this is actually a pretty good place to short with a tight stop
http://stockcharts.com/h-sc/ui?s=$NYUD&p=D&yr=0&mn=7&dy=11&id=t10267991670&a=367854604&r=1413564210350&cmd=print
What is this WCCG?
Who knows. I lost count. He was called Bouterse, Marcos, Ghadaffi.
but not queen mother? lol
If the sun goes docile this weekend, I just might have to go all in short on Monday.
This sunspot could cause a sharp increase in solar activity over the weekend. Earlier this week, while it was still hidden behind the southeastern limb, the active region unleashed several M-class solar flares and hurled a massive CME into space. Considering the fact that the blast site was partially eclipsed by the edge of the sun, those flares were probably much stronger than their nominal classification. Now that the sunspot has revealed itself, X-flares may be in the offing. Solar flare alerts: text, voice
http://spaceweather.com/
I just read that too. Scratch that plan.
do we have data on how these flares affect market participants? Do they fuel speculation and lead to buying frenzies or do that make investors nervous so they hit the sell button?
For any bears looking for good news, the CPCI (put/call index = smart money) spiked today to 1.70, the highest I’ve seen in over a year. Last two highs were 1.58 at July top around 1980, and 1.54 at the end of Aug around 2010. Soros must be buying more SPY puts.
Eclectic,
Continuing re “A Roadmap of Time”. A couple of follow on comments from my observations at the end of the October 16 post.
Apparently Shelby Maxwell wrote a book (paper?) with James Ralph Puckell – “How to Speculate and Profit”, perhaps around 1939. I am trying to find, so if any one has this, can find, or point in a direction, I would appreciate.
By early 1936 Maxwell was very familiar with, and extensively used, the Lunar Wobble in his analysis.
Focusing on Chapter 2, when he refers to ‘var. of var.’, he is focusing on the rate of change of the rate of change. Or second derivative. From my own work, I too believe it is important. Indeed, I believe this analysis should be applied to everything. He describes this in a couple different ways, e.g. the elevator description, or it’s not point A or point B, but how you get there. This applies to more than just ephemeris generated points (Solar Fire calculates the speed as an output, but you have to calculate the change of that speed), but also tides (using absolute value to normalize the total change and eliminate sign changes).
Related, it appears to me that Maxwell viewed atmospheric conditions as tides in the sky.
To be continued, SC
John,
I believe you have convincingly argued that the current market is mostly comparable to 1937 (Solar Cycle 17?). However, I am curious how you feel about this Solar Cycle 24 and SC 23 in comparison to Solar Cycle 5, 6 (late 1780’s?) which I believe was the beginning of the Dalton Minimum. Of course, different absolute levels, but in your opinion, are there any comparison structures that apply to current Solar Cycle. Thanks in advance, and sorry if you have analyzed this in past, maybe you could just give link,
SC
SJC:
http://www.worldcat.org/title/how-to-speculate-and-profit/oclc/11869325&referer=brief_results
Peter,
Thank you very much, will get and review,
SC
Great post John. Fantastic work over the months. I really enjoy your reads and have put into place all the necessary stops for a declining market since topping. I’m in the Black heavy thanks to you
Best Wishes
Mat
Elvis, sorry mate I just saw your earlier. Being on the other side of the globe I pretty much crashed just after posting mylast message.
I can’t post my normal charts as I have tried before on photobucket but for some reason I never seem to get the link right.
This is the next best thing below.
It is a 5 min chart and shows quite clearly the Inverse HS on SPX but there are similar patterns across the indices.
Just to add I was tiree andI think I stated that the Trannies also had a broken Inverse HS which is wrong, I meant to say double bottom.The target is fir that is 8300.
I will add that thete is nothing to say that the SzpX pattern will be fulfilled but given the astoundingly strong reversal in the DAX and strong moves in the Tranny and IBB it is foolish to ignore them.
Also the gold stocks reversed hard down, which have been running counter cyclical to the broader market.
I maintain that we are likely to head higher for at least a week possibly two and form a larger head and shoulders or even a double top.
For this reason I will be holding off on any new VIX longs unil I see a reversal. i sold my VIX longs into strength on Wednesday and will hopeully buy back double or the next week or so.
The chart below should picture it very clearly
Cheers
http://bigcharts.marketwatch.com/advchart/frames/frames.asp?show=&insttype=&symb=Spx&x=36&y=15&time=3&startdate=1%2F4%2F1999&enddate=9%2F13%2F2012&freq=6&compidx=aaaaa%3A0&comptemptext=&comp=none&ma=0&maval=9&uf=0&lf=32&lf2=4&lf3=131072&type=2&style=320&size=2&timeFrameToggle=false&compareToToggle=false&indicatorsToggle=false&chartStyleToggle=false&state=10
And a word of warning to those that think the R2k has rolled over. It has from my perspective actually formed a near perfect bottoming formation on the 60 min chart and yesterdays weakness was merely the forming of a bullish flag as it readys itself to break a double top.
The target from that break would be 1060.
Sp500 just barely bounced up from 10% of correction.According to The Taylor Trading Technique (TTT), Monday is a sell day which you can not short but long. However Friday is a breakout day from Thursday-the inside day so on Monday SP500 could be back a bit, so we can short at Friday high. There is a gap of supply and demand from 1899 to 1905 level. All in all, short or long depends much on the first hour opening of US session. Statistically, the forth week of Oct mediocre for Sp500 whereas the last week very positive. Stay put
For a change my weekend post on Saturday.
I want to talk about lunar declinations and the Metonic cycle. First last weeks forecast. I said I saw an inversion until Wednesday, and expected a choppy market. The inversions are more powerful than I thought and they pushed the Friday low into Wednesday. I said Friday a high, which is consistent with what we saw the last few days. Next week the tides say down again but my lunar filter is neutral.
So I have to explain the metonic cycle first. Many analysts see this cycle, but the question remains : where are we in this cycle. What I have found is that you can read it directly from the declination table. And what I saw is that the 19 year cycle is turning in 2014. I saw a rate of change extreme in January 2014 and the potential turn in January 2015. So John’s divergences were a manifestation of the 19 year cycles that is turning. Since January momentum is declining, accounting for the flat year that we see.
The theory says that within the 19 year cycle we should see a sub-cycle that alternates between 8 and 11 year, roughly the golden ratio. And we do see this cycle in the declination table. Next major event is 2025; exactly 11 years after 2014. And then 2033 again, 19 years after 2014.
XXX And I don’t assume anything; I just read it from the table. XXX
What does this tell us?
1) 2014 is a pivotal year and we are in an historic timeframe. When the turn is complete we’ll go down at least into 2018, but chances are real this is just the first part of a much longer bear market.
This same analysis gave a declination turn in September 2006. The apo-peri cycle was up into December and the 19 year cycle was still up. So the high came mid 2007, what was to be expected in an uptrend (right shift). The 2007 decline caused a global financial crisis, and the 19 year cycle was still up! Now the 19 year is really turning, so heaven knows what to expect this time.
Anyway, this confirms John’s analysis and the only remaining issue is what to expect the next months. Last week I said I saw one more leg up into January. I still see January, but with the massive loss of momentum ATH’s are doubtfull. What’s more, short term trends in declination are in conflict with short term apo-peri trends; not a sign of force.
So I have 2 scenario’s :
1) September 2014 was the top.
Arguments :
a) September 2014 is exactly 8 years after September 2006
b) in a period from January 2014 to January 2015, the golden ratio points to August/September
In this scenario January 2015 will be a retracement; a lower high in a down trend.
2) The other scenario is that we will see a double top in a truncated W5 that peaks in January 2015 or even ath’s on wall street. Argument : both declination and Apo-peri point to January; that’s confluence.
In any case; after January 2015 the turn is final and the first low I see is march 2018.
What I am not sure about is what the 11 and 19 year cycles are implicating. Could it be we will see a bearmarket into 2025? What is missing is the 54 year cycle. My declination table starts in 2001, so I don’t know how to read this K-wave. This will be key in forecasting the next decades.
Anybody any thoughts on the 54 year cycle? I could use some help 😉
Nice weekend to all of you.
P.s.
Reading some other sites I understand the last 54 year cycle started in the eighties.
Counting back from my 2033 19 year ending , the 54 started in 1979. Counting forward from 1979, half a 54/56 year cycle gives 2006/2007.
So this should complete the picture; we are now entering the last 19 year cycle into 2033, and we are in the 2nd 27/28 year sub cycle. So 2018 could very well be a major low. First time I do this analysis, so I need some practice.
Cheers.
Sorry; ignore the last post; have to redo this.
3 times 19 year is still 57 years. The last 57 years cycle presumably started in 1976 and will bring us to 2033. This means we are in the 3rd 19 years and the second half of the cycle. That seems to imply 57 year momentum peaked around 2005/2006 and is now declining.
I am not sure you have the starting point right. The end of an octave is not necessarily the peak or trough of the sound/market
I couldn’t find the data before 2001 and I’d love to do some more research on this. So if these data are available I am very interested.
Cheers,
André
daveg,
I am not sure I have it right. I feel confident about the 19 year cycle and the 11/8 structure. But one level above this is where the guessing starts. So you may be right.
André
Your detailed analysis is fantastic Andre. Thanks for bringing another great angle in addition to John’ solar cycle approach. Much appreciated and enjoy your posts.
Thanks 😉
André
Andre’
What do you mean “My declination table starts in 2001”. Do you need data before then? I can send if you do.
SC
Steve, my reply jumped up a bit; see above.
André,
Try this:
http://www.mmacycles.com/articles/articles/geocosmic-correlations-to-stock-market-cycles/
“What is the greater cycle to the 18-year cycle? If we multiply 18 by either two or three, we should be able to identify that greater cycle. Therefore we have to ask: is there a 36- or 54-year cycle to U.S. and/or world stock prices? And if so, was 1987 the bottom of one of those cycles? Well, it is easy enough to figure out by simply subtracting 36 and 54 years from 1987, and see if that comes close to something like a stock market crash. The short answer is 54 years, which subtracted from 1987 gives us 1933, which is close enough to the bottom of the Great Depression, which occurred in July 1932, as measured by U.S. stock prices. Thus it is very likely that 1987 was not only an 18-year cycle, but also the start (and end) to a longer-term 54-year cycle.”
http://www.tradersnarrative.com/benner-cycle-the-18-year-cycle-of-secular-stock-markets-4593.html
“The Benner Cycle or the 54 year cycle of stock market returns. This simple pattern shows that major market tops form in a recurring cycle of 16, 18 and 20 years concomitantly. If you add those three numbers, you get 54 years. The average then is an 18 year cycle (54 divided by 3). The Benner Cycle looks to be a more granular definition of the familiar 18 year or 17.6 year cycle.”
Thanks
Andre’ I admire your persistence. I have thought hard too on these issues and would like to be helpful but can only beg the question. Adding 18 years, then 19 years (averaging 18.6-the declination cycle) to the year 1792 one arrives at 2014 as your analysis suggests.
http://mlloyd.org/gen/macomb/text/amsr/020.htm
This would seem to confirm Kress’ work on cycles.
http://www.silverbearcafe.com/private/11.12/kresscycle.html
Perhaps I’m still deluding myself to believe that one can come up with an answer to the riddle of predicting the non-periodic equation of cycles as expressed by planetary movements by testing various natal charts. Here’s an example on one of my favorite markets.
https://adenforecast.com/believe-it-or-not-golds-8-year-cycle-still-on-track/
Now, if we look closely ‘under the hood’ at the sisters work; the cycle can be as short as 6-yrs, 5-months or as long as 8-yrs, 6 months if one uses dates when the directional moves upward occurred. (Jan, 1970, March, 1993, and other possibilities for the low in gold: Aug, 1999 or Feb, 2001)
That results provides a rather wide time range of a low from March, 2015 to April, 2017. Not very helpful to say the least.
And that Metonic cycle of 19-years? Well, look at the bear in gold that began in January, 1980. It lasted longer than 19 years depending on what date you want to use as the final low: July, 1999, August, 1999, February, 2001 or April, 2001.
Meanwhile, back to the lab; but keep up the good work.
http://amorebeautifulquestion.com/einstein-questioning/
What I have seen in the lunar declination table is that the 19 year cycle is very stable. I wonder if anybody has tried this approach yet. This is all lunar and tied to gravity. Astro is something else. I decided to concentrate on the moon. Thanks for your response.
André
Andre’
Agreed, it is very stable. On March 29, 1995 declination was at 0.24*, and on March 29, 2014 it was 0.57*. I also like the fact that Apogee Cycle aligns to within <1 day, and of course the Lunar Phase lines up exactly.
At some point I will be seeing how some of the more important astro cycles align (since I believe there is an electrical component at work also). The Lunar Nodes have past by their exact alignment, but to be off by 4 months and 20 days after a 19 year cycle (~2%) is good enough for an imaginary point. Mercury synodic cycle with earth is 12 days of exact 60 cycles, while Mercury Venus will have done exactly 48. The point I'm making is that a lot of important wheels align after 19 years, the Sun's energy, with the gravitational/deflective position of the moon upon the it ecliptic rotation of the Sun, and in the same alignment with the position of two potential dischargers of the solar electrical capacitor. Whew, makes my head spin.
Right now I have my model set up that I want to use initially, but requires so much price data. Going much beyond 20 years is not easy for some markets (natgas, crude). It will take a while.
SC
Interesting point. At the end of the day, apo peri is dominant as it it is the actual distance, and distance determines gravity.
I now understand there are sub cycles that combined produce the net distance. Declination is one of them. There must be others. Who knows they are astrological. My guess is it’s solar. Ultimately, gravity is 1/3rd sun. Lunar declination is 100% moon. So the difference between 18.65 and 19 must be the sun. The sun gives declinations too. Maybe this solves the riddle.
Anyway, declination extremes produce inversions in the market; very accurately. So including declination in my research is another step forwards in our quest for the holy grail.
This correction may have had the feel of a panic. Sure, there was some. But it has been one of the most orderly sell offs I have witnessed over a long time.
As for the Dow, in time it was perfect 2×1: using the hourly chart, from the high 19 september to the first low, october 2. The same distance in time forward is the low made on the 15th -a method borrowed from Jenkins. If you divide the whole downleg into 3 equal parts, drawing horizontal lines, and go one level lower (meaning 1/3 lower) you find the the february 2014 bottom with the august & october bottoms in 2013 only a fraction lower when you go to the next 1/3-level lower.
This is consistent with my second scenario and my apo-peri analysis that indicates October is an important month for a low.
Thanks,
André
Steve & Eclectic,
I haven’t read the book A rodmap of Time + lacking both an astronimical and math-backround, so this may be way off topic and a not such a smart hunch. i post it anyway, because I gave it a lot of thought lately.
Steve mentioned the Lunar Wobble. On the internet one of the descriptions in relation to the Lunar wobble is: “How long a Moon Wobble and Moon/Solar Wobbles lasts varies according to other planetary factors that can trigger the point of Moon Wobble earlier or prolong it turning into a Moon/Solar Wobble.”
I searched on the internet, but the paper I looked for (PDF-format) is no longer avaible, the spare links are dead. This paper describes the panics during the Pluto-Uranus squares, illustrated with charts from 1745 on, when charts came available.
In this paper panics occur in 3 stages:
I quote:
1) The Setup: Uranus establishes a 90 degree aspect to Pluto from a geocentric perspective.
2) The Activating (Translation) Event: A conjunction by Mercury, Mars, Venus or Sun to either Uranus or Pluto. Financial Astrology defines this aspect as a “Translation” (a faster moving body entering into an aspect to two major planets which are already in aspect).
3) The Trigger Event: Mercury, Mars, Venus or Sun move into a 90 degree aspect to either Uranus or Pluto, often after the Activating Event.
The Trigger Event is the final stage of the process, producing manifest financial, economic and social consequences, with the most obvious visibility occurring in the financial markets. This Trigger Event is the key component in the progression of the crisis. When a Retrograde or Direct Station of Mercury, Venus or Mars is positioned to form the Trigger aspect, the adverse effects are magnified far above those effects produced by an aspect formed by a direct motion transit and the crisis in the financial markets becomes acute (just happend october 8.
Eclectic wondered, referring to var. of var. “If so then, why aren’t all market turns during lunar phases Immediately before or after the moon’s perigee; when the tidal influence is the greatest?”
In my own words, to conclude this: perhaps the Lunar wobble -making aspects?- is the trigger event you need in order to..
Peter.
Peter,
You have articulated better than I ever could what has been rolling around in my mind. What you describe are the ‘wheels within wheels’ that have been described so poetically in the old testament, as well as by Gann, and Bayer. For me that is the key to understanding the markets, and most everything else. What is Time? Is it really 24 earth hours, everywhere and always? Who is the great Cronicator of time? Or is it Khronos. Perhaps it is fascinating that The Temple of Saturn in the Roman Forum housed the state treasury.
The speed of Saturn-Uranus is always of interest. I have mentioned this before, and beginning this past week it entered its fastest period of the year, until November 18 (most intense the last week of October). On the 16th/17th WTICrude was at the same Point in Time as last April 16/17 when it was at $105 (only Sa-Ur speed was maximized going in reverse). Perhaps Maxwell was on to something with this var.-var. thing.
Finally, while I generally agree with the wheel within wheel set up above, I believe there is a forth wheel that is smaller but critical, and a background framing consideration that is key. The forth wheel is Lunar Movement. That is why Andre’s work is so important. It takes timing down to a more precise level. It is said that towards the end of Gann’s career, he focused primarily on Lunar activity (and LOV). Of course, he had a wealth of knowledge built up by then in other areas. All of this is within the framework of the Suns energy, which is the electrical capacitor of most importance, hence what John is doing is the main act.
Just the BS roiling around in my head,
SC
Sorry for my grammer mistakes, I’m tired.
SJC,, I sent an e-mail to these folks and will let you know.
http://wallstreetbookstore.com/
Thank you for this lead and for your thoughts and comments on ‘var of var’; and the lunar wobble.
Back in the day there was a place where one could get used WallStreet books, but I can’t recall the name. I did find this though.
https://www.facebook.com/pages/Wall-Street-Book-Exchange/189123494453083
Cheers.
Eclectic,
Thanks! Those site references look interesting. I’ll explore too. The reference to Bonnie Lee Hill below is an important resource.
Regarding some other thoughts expressed in other posts:
For orb for astro events I prefer 3 degrees, or 3 days, whichever is greater +/- of exact. A total of 21 days (10+1+10) is too much for an astro event that occurs about 4 times a year (Lunar Wobble is Sun every 0*, 90*, 180*, 270* to Node).
Gann (and Bayer) utilized the Node, especially to the Natal U.S. chart. The Lunar Node of 18.612958 years fits in nicely with the important 19 year Metonic Cycle and is 55.8 years after 3 trips. I believe (can’t prove yet) that these cycles are normalized at some point in time per Peter’s comments above. And it is the Moon activity that resets every other cycle (that is in ‘orb’ to an event) – hence the importance of Lunar activity to as reflected in the Nodes, Wobbles, Metonic,….which is why Andre’ work is so important.
SC
http://www.opednews.com/articles/Uranus-Square-Pluto-and-th-by-kirk-gallaway-120305-949.html
Peter, this looks like your referenced link.
http://www.signe-astrology.com/moon_wobbles.htm
Another and more precise definition regards duration to be found here.
http://www.elliottanzer.com/astrology-moon-wobble/
Degree of orbs? A good question.
Moon wobble history at bottom of ‘Lunar Activity’ topic.
http://www.bonniehill.net/pages/astronomy.html
With the rise of the $nyad over three days in a row and the turn up of the 10 day ROC of the summation index
http://www.financialsense.com/contributors/tom-mcclellan/summation-index-rate-change
there can be little doubt, that the bottom of the correction is in or will be shortly at slightly lower levels.
Schaeffers Monday Morning Outlook is building a compelling case for a 10-20% rise of the SPX within 3 months. Such an outcome would be consistent with the targets of Eisenstadt’s econometric model, one of the most reliable forcasting systems, Mark Hulbert has ever met
watch.com/story/get-ready-for-sp-500-at-2150-top-market-timer-says-2014-08-27
Waterfall declines didn’t manifest in spring and they won’t over the next months
This would be inconsistent with the following:
January First Five Days Down
First Quarter 2014 violated Dec 2013 low
No XMas rally of 2013
Combined these have 75% predictive value and say market will be
neg. for the year.
This may not require a waterfall but at least it will bounce along until the end of the year. With peaks on 11/2, 12/2, 12/31 (end of Oct bounce, Txsg Rally, Xmas Rally). No way I can see a rally between here and EOY more than 10%.
In addition:
Solar Cycle Peak already
Kitchin Cycle pointing down from Oct 1
QE ending supposedly
There is always doubt the bottom of the correction is in:
http://www.seeitmarket.com/nyse-composite-deeper-stock-market-correction-16101/
Eclectic, I did exactly the same without knowing you did too. I asked for a copy in PDf format. I will never be able to solve this riddle (no knowlegde of the various areas you mentioned in your outline), but curiosity didn’t kill the cat.
Thanks for the link, I will delve into this.
I’m sorry to read André dismissed your input, I think a two way approach is more fruiteful as I’m convinced gravity is just another piece of the complex building but I have to acknowlegde to know all the planetairy movements and their influence on the stockmarket is a 3x lifetime job,although Bayer proved it can be one, when you have the brains.
By the way, I can sent you the paper I mentioned, if you are interested. Just drop an e-mail in this box: annekeeerden@gmail.com
Peter.
Peter,
For the record; I appreciate any input and don’t dismiss anything. I just focus on solunar cycles, that’all.
Cheers,
André
IMHO, I have figured out the 19.5 year cycle. We are in a 19.5 year cycle which started 9/01 and will end 9/13/2020. Previous 19.5 year cycles were:
9/81 to 2001 Up cycle DJIA up 100s of %.
1962 to 1981 Down cycle DJIA down 50%
1942 to 1962 Up cycle DJIA up 100s of %
1922 to 1942 Down cycle DJIA flat
Each of these cycles correspond to Jupiter Saturn conjunction. Jupiter and Saturn are the Ying and Yang, the Increaser and Restricter, etc. so it kind of makes sense that their passing close by each other in the sky would be of the utmost significance astro energetically.
Interesting. Jupiter and Saturn are the largest planets in the solar system, dwarfing the size of the earth. If Andre’s theory that it all comes down to gravity is correct, then you could make a case for these two planets playing a part. Even though they are far from earth, their massive size relative to earth should make their gravitational pull be noticeable. When they’re in conjunction, the gravitational force of each of these giants would be pulling in the same direction. Halfway thru the cycle when they are in opposition, the gravity of each would be pulling in opposite directions.
I have no idea how this works just intuition that since their passing each other happens about 19.5 years and there is a 19.5 year market cycle that they are related. It could be coincidence buy I am going to add this to my research list if for no other reason than that it is interesting. By the way, every year when Saturn “the restricter” either conjoins or opposes the earth the market either sputters noticeably or outright falls for a month or two. Like clockwork backtested to 1990’s. I really do this somehow Saturn is one of the main keys to market prediction, in addition to Solar Cycles, Moon Phases and Declinations, and Merc and Venus Retrogrades. Certainly will be interesting to see how this plays out over the next 6 years.
primaCanyon,
I do believe that Ju & Sa play a roll, but not gravitational. Their gravitational pull can be calculated, and even combined, it is less than 1%. And then, how is tiny Pluto, Ceres, or even certain imaginary points in space (Rahu/Ketu) able to correlate with market moves. Just my opinion, there is at least one other impactor – Electrical Universe (perhaps another – can you imagine if you were transported 600 years ago and tried to explain to someone that there was an invisible force called gravity that prevented everything from flying out to the heavens!). Jim McCanny has argued strong for that model that explains the action of comets. Just a thought that there is more than one impactor on the animal spirits.
SC
Go team Electric Universe. Quote from David Talbott: “Sol was a name for the planet Saturn, Helios was a name for the planet Saturn, even the alchemists said Saturn was the best sun”. Apparently, Saturn played shall we say a more central role in the earths predeluvian skys than it does now.
I agree. I think there’s something much more subtle (but more powerful) going on than just gravity or even electromagnetism, something we haven’t yet “discovered”. But the effects of that subtle “energy” can be observed in how it affects gravity and electromagnetism, so even though we don’t know what it is or how to measure it, we can measure its effects thru the things that we can observe.
The exact conjunction dates can be quickly located by using: http://www.theplanetstoday.com/ .
“Peter, this looks like your referenced link.”
Yes, it was. Not the most scientific resource, I know. It was the word ‘trigger’ used on this website that kept running around in my mind and later on linked the input of Steve to this Pluto-Uranus-square-paper, which I read about a year ago. As stated, it is only a hunch.
I was immensly impressed on what Bayer wrote about future turns- to the day- based and related to signs/configurations a year, or 80 years earlier. We tend to look at marketmoves in the present, and when for instance a crash happened in the past we look for the same signs in the sky, assume the same thing will happen again when the same constellation is upon us. That’s not how it works. Not always at least.The astro-seeds may have been planted a year before it happens, without anyone noticing it unless familiar with where to look and what to look for. Bayer did though.
What I liked most about this paper are the 3 stages. That does not mean astro- influence on the stockmarket is immediately visible or a panic must occur on that specific day, it opens the window and the charts from the past show that it is indeed often a turning point, taking it’s time to unfold.
Steve, I use the same cycle, only mine ends november 2022.
I will have a hard look at my notes.
The Planets Today shows Jupiter and Saturn lining up on about 10/1/2020 although that is just the beginning of IMHO what will be a 19 year bull run, it may not start until 2022 as usually the first two year of each decade are slow.
Eclectic, wrong @, if interested: annekeeerden@hotmail.com
For some reason my posts aren’t appearing? Will wait until tomorrow maybe?
Eclectic,
I have your adress, Hotmail refuses to load the pdf file for some reason. So I have to take another route, but it takes some time.
Eclectic,the transfer is done. If I remember well (a long time ago since I have used this) you will receive a link in your box, sent to you from annekeeerden. Click it and you can downlowd the file. If not, drop a line and I will try again.
Steve S, I looked the cycle up in my notes. Yes, I used a slight different approach, not based on the planets and I was in doubt if it was slightly alternating, because I lack a good reference to a 1922 date.
Just go to “The Planets Today” point and click and you will have your positions going as far back and and as far in the future as you want, it is an interactive solar system with a date drag feature that allows you to move the planets by dragging the date forward and back.
Steve S,
I wonder if this astro-based (not saying it isn’t), but how come there are two of them active? Take a look: may 19, 1947/ july 3, 1967/ august 25 1987/ october 11, 2007? There is more to this cycle, but is far too late.
I look for reoccuring patterns based upon planet positions not try to match planet positions to market events. Just cause I am more interested in the planets than in the markets. I look at the markets moves as a direct causal effect of planets the moon, the sun which compliment seasonal factors(the Xmas and US Thanksgiving rally, the April 15 to May 2 Tax Day rally) which are obviously calendar based. The real useful item tho’ IMHO is the combination of a seasonal chart (Equity Clock.com) and trading the Lunar Edge combined with going long S. Lunar Declination and going short N. Lunar Declination if they are not during positive seasonal or Lunar Edge times.
by “lunar edge” are you referring to the lunar cycle that begins 4 days after New and goes till 4 day after Full and then 4 after Full till 4 after New?
Yes, the “lunar edge” really works, buy at full plus four, sell new plus four. According to “Lunatic Trader” website who tracks this strategy on a monthly updated format, this is a really effective way of getting most of the markets gains with only being in the market half of the time.
I have his software. Might be worth buying for your research because it not only plots the lunar phase (new to full) but also plots declination, apogee/perigee, and latitude. The plot makes it easy to see max/min of each of these on one graph for a month’s time.
Thanks!
Larry Williams comments this week on SP which could be down one more time before going up next full moon Nov 6 . The reason is about small speculators buying too soon. 4-day %R over bought.Dan trader also mentions the possibility of SP500 testing 1800 again.
Thanks all. I’ve used a couple of your links in the new post, so thanks. New post out.