
I’ll cut to the summary: there were some signs of capitulation yesterday, but that was not likely the bottom. I’ve kept all my short positions, here’s the analysis:
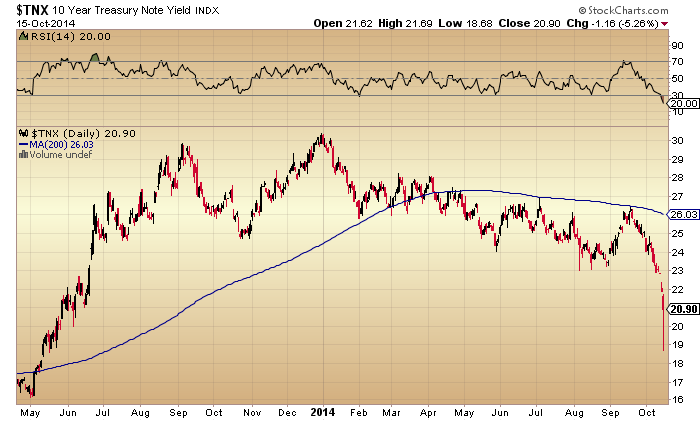
Capitulation signs: high volume, intraday reversal hammer candles on stocks and treasury yields:
 Source: Stockcharts
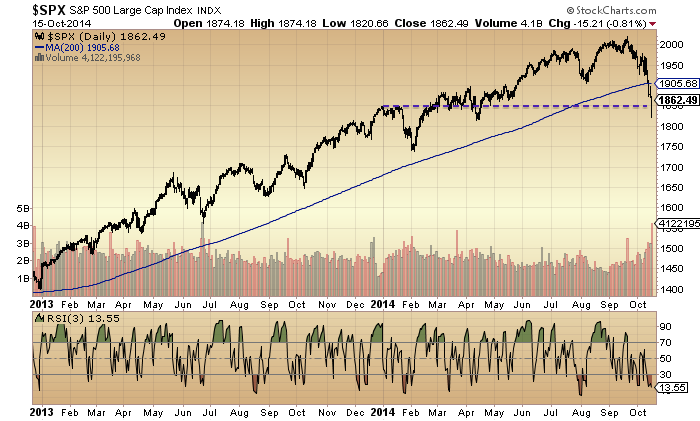
The dotted line on the top chart shows the YTD progress. The SP500 dipped negative yesterday and almost hit 10% down from the September peak, but closed at around 9%. By the range of my analogs, we should see a minimum 18% correction, so that’s not enough.
Rob Hannah’s capitulative breadth hit 19, an extreme level associated with bear market bottoms. The initial reaction to that is that it sounds like a golden opportunity to go long, but the considered reaction, IMO, is that given we are just 9% and 1 month down from all-time highs, this time is clearly different. He doesn’t reveal his formula so the analysis has to stop there, but we can look at other indicators for more clues.
Yesterday’s selling did not appear exhaustive as small caps held up well. As the highest risk equities class, this runs counter to previous capitulative sell-off examples, such as in 2011. That suggests there should be another sell-off ahead in which small caps participate.
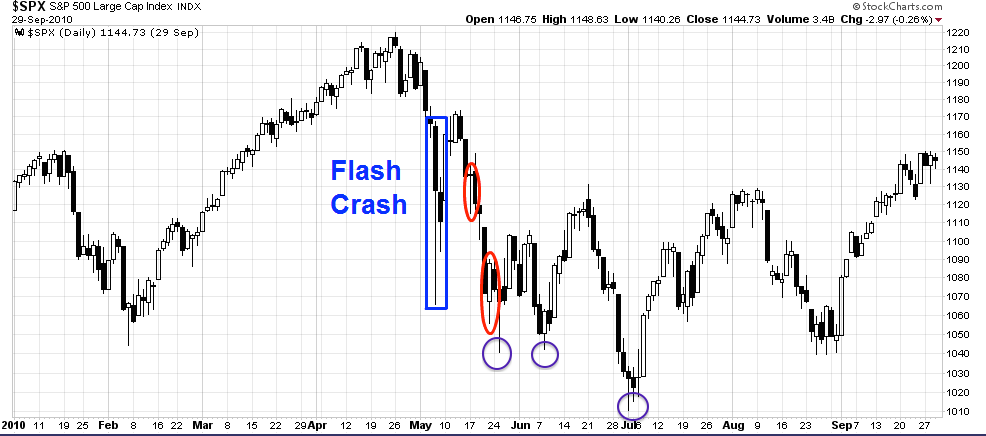
Drawing together 2010 and 2011, we can see that intraday hammer candles did not necessarily mark the bottoms in equities (red circles). However, if yesterday’s hammer was indeed a bottom then we should be heading for a retest and likely lower low on positive divergences as momentum wanes (purple circles).
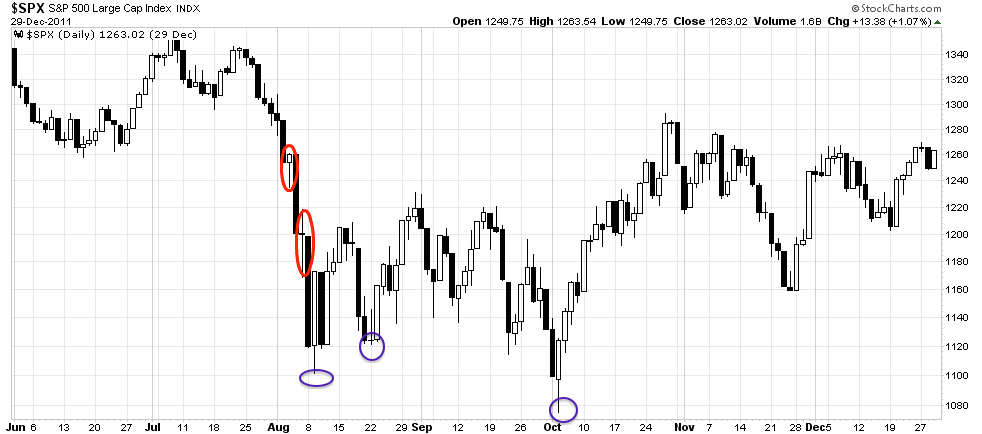
Source: Cam Hui / My purple annotations
If we look at the 1929 analog and assume we are not post-second-chance but at the purple circle, then a few days’ bounce before rolling over again would mirror not only 1929 but also the action after the first purple circles in the 2010 and 2011 charts above.
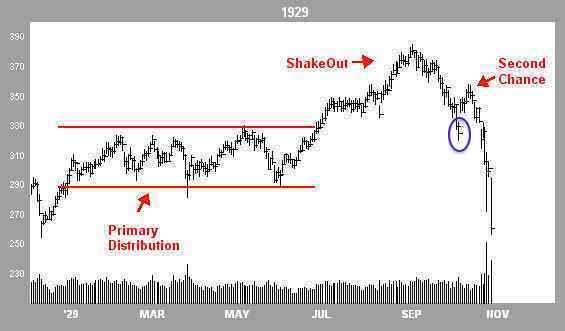 Source: Financial-Spread-Betting
Evidence, however, suggests that we should be post-second-chance, and so far, the steepening downtrend in price is supportive of that. If that is so, then yesterday’s candle should be quickly engulfed and a much bigger panic sell day should come to pass within days.
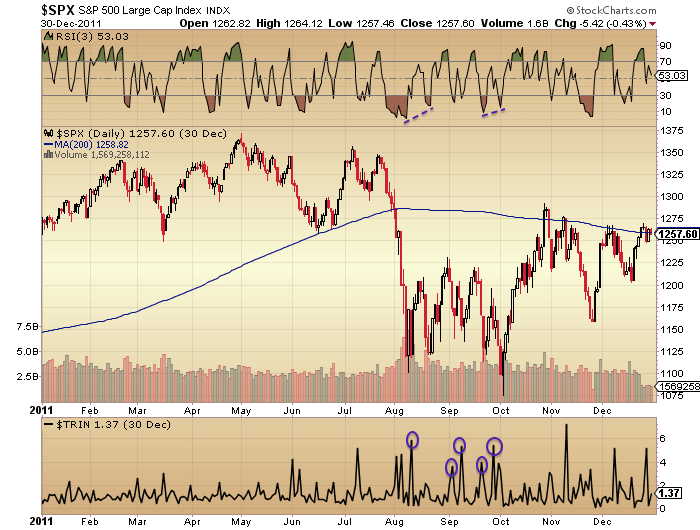
Putting that crash scenario aside, stocks typically need to stabilise and generate positive divergences after a sell-off such as the last few days. They do not v-bounce back up to the highs. For example, below we can contrast the positive RSI divergence in 2011 and the levels of Trin washout compared to now, i.e. both are missing:

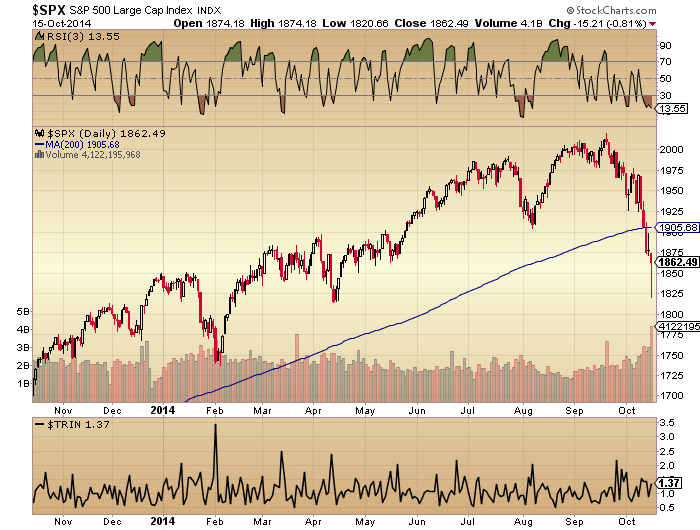
So, either yesterday’s hammer candles are quickly engulfed over the next couple of days, like the red circles in the 2010/2011 charts or post-second-chance in 1929, or we rally for a few days (perhaps into the October 23rd new moon) and then turn down again to the lows, like the purple circles in 2010/2011/1929. A v-bounce back up towards the September highs would be anomalous and only have support from the CBI, which itself has produced an anomalous reading.
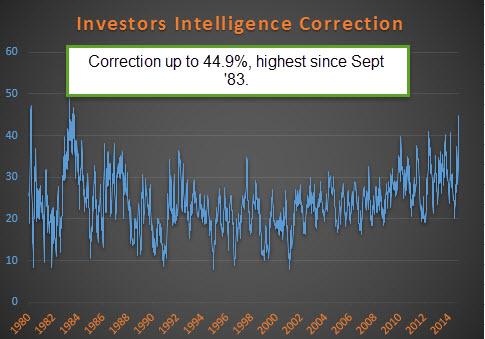
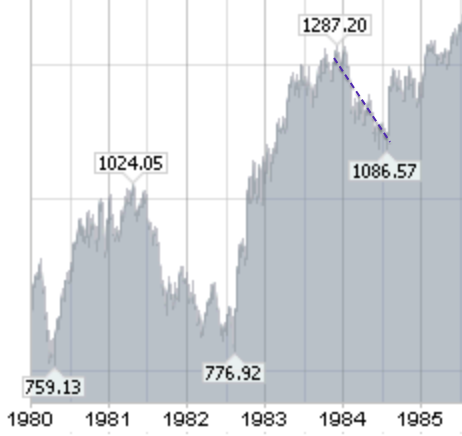
Continuing, the Investors Intelligence spread has narrowed, but still needs to neutralise some way further before we could argue for capitulation. Bears are still at just 17%. Interestingly, the percentage of respondents predicting a correction rose to an extreme level last seen in late 1983:
 Source: Ryan Detrick
We can see that reading was indeed followed by a correction, so was not contrarian:
 Source: Stockcharts
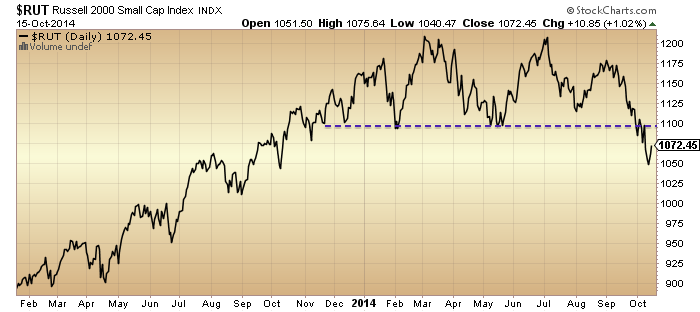
The Russell 2000 outperformed the last couple of sessions, but has broken down the most of the indices overall. It would need to quickly recapture the 1100 level to keep any consolidation hopes alive. Otherwise, the bears are in control.
 Biotech now looks to have been turned down at a double top with February.
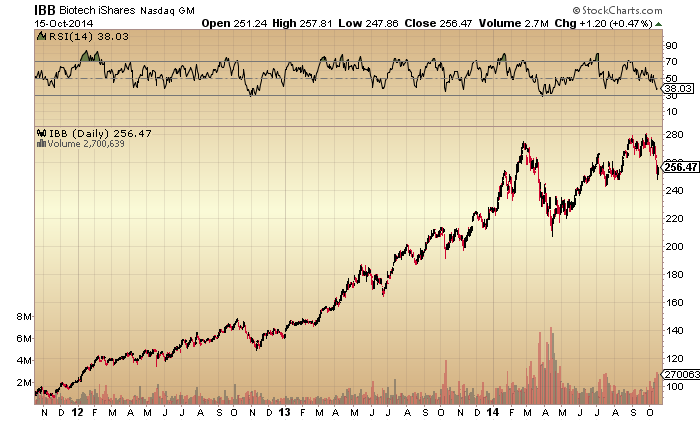 Apple tentatively broke down from a 6 week trading range yesterday, but the pull up into the close keeps it tentative.
To sum up, the most bullish scenario is that we rally for a few days then retest yesterday’s lows again on positive divergences. The most bearish scenario is that yesterday’s range is swiftly engulfed by the bears over the next couple of days and a much bigger panic sell-off ensues.

Hi john,
Hope you are doing fine these days with your shorts and doing even better next week. Finally! I can imagine it was a long, long stressfull time.
Peter.
Thanks Peter
John, thank you for your update. My personal take is that there could be a short term bounce but the fundamentals are so week that the long term sell off is just starting. Yesterday was a mini crash, in my experience is that the markets usually bounce off of it but always return and take out the lows of these crashes. In our case that should lead to continued decline as at that point all long term supports on al lmajor indices will be broken. And did I mention that the fundamentals do not support these lofty valuations?:) Many thanks!
Cheers
Looking for a similar candle in 1987: my two circles, same two scenarios result:
(chart by traderassist.com)
Looking at this chart of 1987, the higher low came in december 4.
The decennial cycle: december 9, 1974 Low; 10 dec 1984, 9 Low, december 9, 1994 Low. December 2014? Something to keep in mind.
Oopas, something went wrong in this sentence. But you get the picture.
Here is interesting piece for those who has time to read:
http://www.ritholtz.com/blog/2014/10/sea-change/
I see these type of messages regarding the change in mentality more often nowdays, that is that people realize that we have not gone too far from the problems that plaqued us back in 2008 and the CBs have just postponed the inevitable. Interesting that the timing is coincidental with what John is pointing out, i.e. the solar cycle change. 🙂 Doug Kaas who is a pretty savvy investor calls it the “Aha moment” and it could be upon us.
To the point of the world problems being streched to the limits abd that its gotten worse since the 2008 crash:
Morgan Stanley calculates that gross global leverage has risen from $105 trillion to $150 trillion since 2007. Debt has risen to 275pc of GDP in the rich world, and to 175pc in emerging markets. Both are up 20 percentage points since 2007, and both are historic records.
Say what?:) Ah, no problem, we have a solution- more debt!:)
I have not been following the oex-call-put-ratio long enough to maintain, yesterday’s 6,2 : 21,4 is an unrefutable indication in situations like this, but I wouldn’t bet an Euro even on one upday to follow. Instead I’ll renew right at the open the small part of my shorts, that I sold yesterday. If the 1946 Dow-chart continues to be the template (with retardation), there won’t be an upday above 15700.
Meanwhile the DAX is confirming the oex-put-sellers. Hopefully it doesn’t break away completely before the US-Open.
sorry, … the oex put-buyers.
Think it will be a short squeeze.
Isn’t Draghi speaking today?
doesn’t he always crash the market?
Biotech double top could also be the beginning of an inverted HS =)
Inverted head and shoulders at a parabolic top? Inverted head and shoulders are at bottoms. So whatever happens, it is not an inverted head and shoilders. Incidentally, that is one of of the things gold bulls called the “triple bottom” continuation triangle at $1550.
Long in NQ future at retest of 3700 level with tight stop. Either crash today or strong move up.
Thanks John, diligent as usual. Futures currently down substantially and looks like a lower open although a lot can happen in 3 hrs.
I still can’t help but think we have not seen the second chance peak and need another decent bounce to really suck in the rest of the retail investors before they get completely destroyed, but hey, the way things look at present it is getting uglier by the minute. 50/50.
@traderx, a short squeeze here would not surprise me in the slightest. The intraday charts yesterday looked solid to me in the final hour.
Cheers
The crash would just be too obvious… Does anyone know if there is any correlation with FOMC speakers and crashes? Coming up something today and tomorrow is Yellen. Would be interesting data. Many thanks.
Statistically bull markets open down but close up on the day. Bear markets open up but close down.
Also high tides at 342PM today imo day will end with lower trend.
Illiquidity in the markets is disconcerting and coming home to roost. An example:
TJM Investments Managing Director Tim Anderson told Benzinga that numerous people brought it to his attention when shares of Intel Corporation (NASDAQ: INTC) dropped from above the $32.50 level to $31.50 last Friday.
“I don’t know what exchange that traded on,” he said. “Clearly, it was very, very low volume.”
He said he thinks that some people who sold the stock are going to have to complain to the exchange or whoever handled that order.
“It clearly went out as a market order at a very weird period of time where there just wasn’t a bid and hit a bid on some tertiary exchange somewhere that really shouldn’t have happened,” Anderson said.
Looking at the one- or two-minute chart, Anderson said that fewer than 1,000 shares traded down.
“It’s a perfect example of a breakdown of Reg NMS,” he said.
The Securities and Exchange Commission created the rules in Regulation NMS to make price execution more fair, according to Investopedia.
When asked if he felt the market is too fragmented, Anderson replied, “Yes, definitely.”
“At one point in time, the regulators felt, well we don’t really need a primary market,” he said, “you know, hopefully they’ll be taking a closer look at that going forward.”
You could sense that something changed yesterday
morning, at least anyone reading stock boards could
as some panic began to creep in.
The buy the dips comments began to disappear,
replaced by the this looks serious.
There are times when my contrarianism is a curse 🙂
Well, to be fair, there was a 8+ bounce in the futures overnight..which lasted about as long as it takes to read this sentence.
Thanks Gary……..I think? 🙂
My prognosis of the Expanding Leading Diagonal is on extremely shaky ground with this morning’s Pre-Market action (approx 2 hours before bell).
Genius update John..
Still following the bradley the geo&helio where spot on (turndate Okt 15) so now we see things speeding up in the graphic and this has to be the capitulation..
Weaker countries like Greece here in Europe are facing the same problems again (2012….
My best guess is still calling for a bottom end of Okt or the 4th of Nov..
Keep up the good work..
All the best
Carpediem (John from Holland)..
https://encrypted-tbn3.gstatic.com/images?q=tbn:ANd9GcQHXaFFQGlj-wuWNHhwkpYn8HOdky5okkX2Q56apzBdM67oOBg_ug
What is this graph?
Yield on Greek sovereign, I would guess
Yep… (zerohedge)
Bradley siderograph
Andre,
Can extremes in ROC apogee or perigee invert? For example, in 2014 the extreme negative ROC for apogee was on March 11, which was a intermediate high in the Russell and Nasdaq.
Looking ahead to 2015 I understand you are expecting a high in late January (extreme ROC of perigee) and a low in late April (extreme ROC of apogee). Could this invert and see a high in late April?
Thanks.
One other question Andre:
You said that you use negative extreme in ROC of apogee or perigee to get your low/high window. I compiled the data and why not use a blend of the negative extreme ROC reading of apogee with the positive extreme reading of perigee.
Looking at the summer top for example. The negative perigee reading give 6/15 while the most positive apogee reading gives 6/30 which was much closer to the real top of 7/3ish
Thanks
thanks again, john. i dont think youve mentioned this here, but what are your thoughts on the range of a single day decline given halts and the ability of the exchanges to break trades? is another oct 19, 1987 day out of the question in your opinion?
If “energy” from the sun affects market speculation (it does) and perceived prosperity, then most markets are about 20 years overbought. Japan is in tune but the rest is an over-inflated bubble. Good morning, http://www.solen.info/solar/images/comparison_recent_cycles.png
Also from the above chart, that guy that stumbled on the 64ish month cycle has something, since that is when the cycles begin to accelerate down.
NFLX– of all the algo’s I trade. the red line green set is unique in my archived examples in that the probabilites only extend the the medianline itself… once there.. the probabilities diminish.
http://stockcharts.com/h-sc/ui?s=NFLX&p=60&yr=0&mn=9&dy=0&id=p81233772806&a=224489297&r=1413465996483&cmd=print
Rusty opened just under the ML: http://scharts.co/1rf67dR
Interesting to note SPX at 61.8% retrace on the year: http://scharts.co/1sVqC52
This just doesn’t feel right. There are now multiple analysts saying that markets are going significantly lower. They turned way too qyickly.
Happy I cashed in yesterday.
If you look at the sentiment-scores at sentimentrader.com, you can’t maintain, that the mood-change of analysts already influenced the public to a high degree.
theo, the public have no influence on market movement short term, so that is a mute point.
Analysts on the other hand, either employed by or not, advise fund managers institutional investors and thus have much more influence on market movements either directly or indirectly.
Actually let me clarify that. The public do not determine direction.
“Public” is the wrong term, as sentimentrader is trying to measure both the sentiment of the small guy and institutions.
agree Allan. Don’t see what could have been called the second chance yet.
CME on Monday Oct. 20 http://www.swpc.noaa.gov/wsa-enlil/
Thanks Peggy. That’s a great visualization, I have not seen that before. A great explanation of the flow of charged particles bathing the earth.
I took profits across the board yesterday afternoon, and expect “some kind of boun ce” here soon.
Just better opportunities to “re short” as the next leg down should be vicious.
FK, I agree. A bounce is needed to set the stage for the next annihilation. It will be brutal.
Great work, John. I find this is the most stressful time as the capitulation bottom is so much lower than after the rebound. And if you miss it , it is a 3-6 month wait for the double bottom and any premiums are much smaller. One tactic I like is to put in a ridiculous bid good til canceled just in case you’re out or get too greedy just when you should cover. This is 20th day from the top. The initial drop in 1929 was 24 days. The new moon and solar eclipse on the 23rd would be 25 days. That is my plan for now.
14 year low in new jobless claims! Lowest since Apr 2000. The DOW had topped in Jan 2000. Most of the other indices , ie the tech bubble, had topped in Mar. Not one word on CNBC of the negative implications of this top correlation.
A slight up day today should be followed by that engulfing day you are talking about, follow through hit on Monday and turnaround Tuesday. Next week should be exciting.
wow – sad I sold my short positions BUT very happy I didnt go 25% long like I was going to – looked like an ambush at yesterdays close!
http://stockcharts.com/h-sc/ui?s=$INDU&p=120&yr=0&mn=3&dy=0&id=p03242657149&a=368958338&listNum=1
as it turns out this was an accurate short signal yesterday
OR NOT! lol – crazy action – sidelines in cash is just fine with me today!
Huuuge reversals in Europe. Happy also to sit in cash BBE.
watching Euro/Yen closely as it broke big descending triangle overnight with baseline around 135.70 – that is what caused futures to swoon in early trading. We now see a backtest of this break. Once complete the waterfall can continue for another 1-3 days before a bounce – 1775 back up to down-trend line off the top around 1935/40 before lower into 1570 as major support being the first Fibonacci support from the equity bull market of 1980-2014.
thank you Pegasus – fwiw square of 9 pricing for eclipses: 10/8 lunar eclipse price = 1965 and 10/23 solar eclipse = 1800.
thank you Peggy!
Re Gravitation:
It seems to me that Andre’, Peggy and Steve’s (et al?) work on ROC for apogee and perigee is providing them with answers on this topic. Don’t your calculations automatically imply using the same data as Maxwell (moon phases, ‘var. or var.’ of velocity (roc), and longitude) to arrive at timing?
In this connection, I’m still wondering how the sun is involved regards, ‘var. of var’ of apparent right ascension, apparent declination and radius vector for the earth?
The NA is used by sailors to determine location for navigation purposes. (Simply stated, in order to determine a destination; it is first necessary to determine present position.) And the planets listed in the NA are chosen simply because they are the most visible.
Thanks for any feedback.
Eclectic,
I just finished Brad Steigier’s book. A very interesting read on the cycles impact on civilization. However, from a traders perspective I believe that Chapter 2 is where the meat is. I will come back to my thoughts on that chapter, as I don’t want to occupy too much space on this site at one time, but there are a couple of other observations in the book that might be relevant to trading.
First, pages 231/232 +/- is his assertion of using barometric pressure to monitor mood swings. Well, why not? If gravity/tides are reflective of external forces that impact behavior, would barometric pressure also be a potential measure. Maybe, but I have enough to research without adding this, but it is an interesting thought.
Second, page 154-156 is an interesting harmonic sequence that was applied to earths climate change. To the extent that nature, both living and non-living, is express in fractals, it might be interesting to apply that sequence to the markets to find that which have a related vibration. LOV requires a more solid foundation than what I have right now, so this is research for another day for me.
Besides Chapter 2, these are the only areas that I am able to use, although if you see something else, please alert me to it.
Finally, although I was not able to find additional references related to this subjects, there is one potential. Selby Maxwell wrote for the Chicago Tribune (and another paper), and I have started to research his articles. So far I have found little of use, I just started. However, On Monday, January 15, 1923 he states in an article that behavior is impacted by weather, which is impacted by the Sun, which is primarily impacted by the Moon, and outer planets, specifically Jupiter and a planet beyond Neptune (Pluto was unknown at that time!). This is similar to another recent post on outer planets that impact the sun. He also gives an explicit weather forecast. So far no insight into your good questions. I will continue with my thoughts on the Maxwell/Wheeler approach.
As an aside, on the date mentioned above, did you know that it was reported that Russia warned that the French Seizure of the German Ruhr Breeds the specter of War?
SJC: I also own and have read the Steiger book and have more information on Maxwell, and would be interested to continue discussions.
Couldn’t stop myself…. 23% net short position just now….
It’s a “starter” position, and ideally I’ll be losing money on it as I layer on short positions at higher numbers….
My trading system is still 100% short, so trying to pick my spots to catch back up to it a bit….
GL to all…
Mate I will be joining you in the next day or two 😉
Sounds like a plan… Got my rally cap on… 🙂
Trannies have been a good tell here –
Long. Balance forming.
HS bottom forming on 5 min
Bulls and bears may have found a short term equilibrium. A bounce and a re-test would be the dream come true for the smart bulls. Be patient.
the very definition of BEAR MARKET
can there be any doubters at this point?
http://stockcharts.com/h-sc/ui?s=$NYA&p=W&yr=2&mn=0&dy=0&id=p98743992394&a=370927705&r=1413473850066&cmd=print
Plenty and I am one, the mid term presidential cycle low is essentially in, and the 20 Years cycle bottomed on time. Possible retest over the next week or so, but this market is going up baby
UUP- inverse of the NFLX example… this special case red line green set is what I have taught for a number of years as the ”double barrel shotgun” where the redline connecting the first two pivots hits overlapping 1.27’s, in this case to the penny….as always, it only forecasts the probability of hitting the medianline…. after that other geometry is required to stay with trade….analysis is based on almost 2k archived examples over many years…
http://stockcharts.com/h-sc/ui?s=UUP&p=D&yr=1&mn=11&dy=2&id=p01215706936&a=370190465&r=1413473568222&cmd=print
SPX- thus the redline green set that triggered at the all time high only gave the probabillty of move to medianline… after that other geometry triggered the move lower… for me the entry is everything… simply will not enter trade with tight stop unless based on algo i have done my own research and archiving…..
http://stockcharts.com/h-sc/ui?s=$SPX&p=60&yr=0&mn=4&dy=21&id=p98437361296&a=247870051&r=1413474517357&cmd=print
A lot of selling into the SPX 1860 area.
I suspect we mount another challenge at that area soon as that level intersects with the 5 day upper trend line and the bulls will want to break it.
there is A LOT of resistance there going back to the consolidation from april/may – a break above that would lead to the 1887ish bounce but this chart shows why no buy signal is likely
http://stockcharts.com/h-sc/ui?s=$NYDEC&p=D&b=5&g=0&id=p96408434935&a=368972370&r=1413477151826&cmd=print
too much technical damage
on the other hand Allan if 1860 holds then the failurte of the shorter term charts indicates more SHORTS! WCCG on the way to HELL!
Allan not more than usual. Locals have been two sided so far today. Fed speaker in 15 min.
well the bull patterns are busting – there is some possible positive divergence on shorter term charts, the VO and on THE CHART THAT NEVER LIES! LOL
this is looking like a bottom is trying to coagulate!
http://stockcharts.com/h-sc/ui?s=$NYUD&p=D&yr=0&mn=7&dy=11&id=p68897809979&a=367854604&r=1413475585525&cmd=print
the internals are shoring up as well across the board so if this continues tomorrow is a bounce and probably up to 1887ish but I doubt the internals will improve so much then as to give buy signals – just work off the oversold situation
for those familiar with Terry Laundry’s work, there is some interesting stuff being done by Jeffery Young using Terry’s principles. I dont agree with the broad application across indicators that Jeff uses but if you look closely some of his applications are pretty good.
http://stockcharts.com/public/1649458
Looks like a child’s painting.
John – Please censure this individual. he obviously skipped grammar school today
and is using his Mommy’s computer.
1860 as per Allan – may lead to 1 day play to upside
Looks like a lot of folks here are on fence…me too. Russell and Biotech have been strongly against downtrend the last 3 days. Anyone have any thoughts on that? Is that a signal of a interim bottom? I know John is still short, it just seems that without those two leading down it signals a stalling point in the downtrend. Several also have said if waterfalls don’t come we could retest highs…not sure I believe that one though…
Bullard just said they may keep bond buying due to inflation expectations??? Will the QE “experiment” continue despite their stating it will end for months? They have no clue the damage that has been done.
small cps entered a confirmed BEAR before any other sector so they bounced first is all
no sign of healing to be sure
Zero Hedge reported on this…because the hedge funds that are blowing up have been covering their shorts…hence the price stabilizes or rises
Broke out and HS or cup and handle complete… Shorts gonna get squeezed…Impossible to say how far but a bear market needs a lower high and then go down. If there is not a lower high or we stay in balance things are going to squeeze. Guys in the pit have been calling for a flash crash but then one old local guy said. When everyone wants it – IT NEVER HAPPENS.
Russel has been divergent and that is not normal.
this is an original from Jeff Young
http://stockcharts.com/c-sc/sc?s=%24SPX&p=D&yr=1&mn=3&dy=0&id=p48243300604&a=350221808&r=833
and a whispered promise of more booze keeps the DT’s at bay! lol
the is a gap on IWM at around 109 that corresponds to fractal resistance so if IWM rallies to there and fails it may indicate that spx will fail at around the 1887 target I have
the 2007/8 IWM chart looks virtually identical to now
Yellen speaks tomorrow and I bet she will say that they are delaying end of QE and then you all squeeze and your patterns will mutate. =)
“we all” and “my” patterns?
ouch – sounds like a mass butt crack wedgie!
yeah she might delay but hey I’ll be long EOD today and then I’ll be out and short when her words freeze in the coalescing storm and shatter in shinny pieces on the ground!
yellen is a clay demi-god and the masses are but empty worshiping asses
roflol
tx – this IS a BEAR MARKET and if anyone thinks that the FED has anything left to pull a 2011 outta their bottoms then they should just buy Rydex DOW 2X and sit tight and wait for heaven on earth!
Traderx, I don’t believe she will.
What I do believe is that James Bullard has diminished the credibility of the Fed by coming out today and saying additional QE might be necessary. The next thing we’ll see is him in front of his Bloomberg day-trading for God’s sake. Wall Street is not Main Street and Bullard needs to redirect his attention to the latter. Contrast all this with the very good unemployment claims number report today – now which metric is more important to the Fed or should be? It’s hard to know listening to Mr. Bullard.
The narrative of an omnipotent Fed is crumbling…
http://stockcharts.com/c-sc/sc?s=%24NYUD&p=D&yr=1&mn=6&dy=20&id=p81533095900&a=350221810&r=399
JY again
bbe, perhaps an impolite question, but some of your charts I can see and others say I must ‘visit stockcharts.com to view the chart’.
Any suggestions on what I need to do as I DO VALUE your charts a lot.
Thanks for all your input.
the ones that want to visit you need to copy the link and paste it into your browser then it will pop up
Oh ok, thx.
what has been confirmed by the NYA and the IWM is soon to be confirmed by the DOW, the SPX and the WLSH
that is why the FED mouth demi-gods are putting flower petals under your fearful feet!
chart –
http://stockcharts.com/h-sc/ui?s=IWM&p=W&st=2000-11-10&en=2014-10-16&id=t88978999164&r=1413482484779&cmd=print
if they are hinting at 9% corrections, sh*t must be really really really really bad. It’s so very comical. Yesterday Yellen says US Economy is fundamentally sound and can withstand European worries, literally next day Bullard says we’re open to pump…..like a bad comedy.
no buy signals and plenty of resistance and no short trigger yet at the HUGE volume hole
as I said yesterday, you dont always have to take a position – cash is ok
Is it safe to say commodity super cycles is over once the oil price breaks the $80 psychological level. $76 to $80 appears to be break even price for most US shale gas producers. There’s plenty of shorting opportunity on this oil price bounce.
http://blog.kimblechartingsolutions.com/#sthash.Nx5orRb1.lhr4PDr0.dpbs
WHAT DOES IT MEAN, IS IT BULLISH OR BEARISH STOCKS?
robbie that looks like the 2 or 5 year treasury chart
if he’s looking for rates to rise i’m guessing he’s stock market bullish
i think he’s crazy all rates are headed down – a lot
So robbie, what’s YOUR guess?
this is too funny
NAAIM got down to 9% which would indicate a major low in the markets
meanwhile the fly when insanely bullish
and investor intelligence is still 17% bears after all this
only contusion you can come to is that this selloff will go much deeper much longer and much quicker than most bears can even imagine
i don’t care how prepared you are it’s gonna be something that nobody will be better off than where we started
water will be KING!
Specie, so are you suggesting that we are all wasting our time here? Chill man, at least John will be prepared to take his slice off the table. I’m beginning to think he might be a BOT. Lol!!
Why are not commodities rallying if this is a bear market in stocks?
deflation
Do you see each 4 month SP get a big volatility ? Oct, June, Feb, last Oct, last June…..That idea from Welles Wilder of Delta Society. He said the markets moving with the moon. …So for the coming time, SP will get 2 times of bottoms: Oct 20 and Nov 7. Cyclically, the up cycle starts from the last week of Oct.
Wells Wilder is great, but Delta isn’t much in my book. It called the 2009 bottom, but it seems to be an alternative version of cycles. Sometimes they work and sometimes they don’t.
That may be, but it could also be related to the synodic cycle of Mercury. Very eccentric, and unstable.
SC
Just updating… Added shorts at close… 53% net short now…
Hoping to add more at higher numbers tomorrow, but feel better being closer to being re-aligned with my trading system now…
Hi John
Once the sell off has finished what would you see as the index to lead the recovery?
I’m assuming it would be tech, biotech & small caps as high risk plays.
I’m asking this in view of Tony Caldaro’s EW count that we’re in Piv down on S&P500 with, at some point, the final wave V up to end the super cycle.
Judging by your estimated 2-8 week length for crashes based on history, which we’re halfway through, was thinking what the best long play would logically be.
Thanks
Small caps have outperformed large caps since 2000. I think they will be the worst class going forward. I don’t agree with that EW count. I believe we see 2-8 weeks crash, then 3-4 months partial retrace / stabilisation, then a long bear market. I believe short-and-hold will be much more fruitful than trying to play the long side at any point. But in any retrace of the initial falls I would expect defensives to outperform.
Thanks very much for your insight & view.
Note that Caldaro’s Primary wave 5 up could fail. Another of the many catch-22’s with EW: In a 5 wave impulse, the 5th and final wave can “fail”. That is, it may not extend past the end of the 3rd wave. It’s more common for 5th waves to make new highs (or lows, if the impulse is to the downside), but 5th wave failures do occur. If Caldaro’s count is correct, a 5th wave failure would fit nicely into John’s expectations.
Thanks for the explanations.
I have spent a lot of time on Delta; and I wholeheartedly agree with Kent. IMHO the most important input for Delta is the 19-year cycle. I also think that better ideas have been proposed by the group here on this blog.
http://time-price-research-astrofin.blogspot.com/p/delta.html
PURVEZ my guess is it was the massive spike in price on the treasuries, which would signal higher yields to come and lower stock prices
tim, we are not half way through a crash! we have barely skimmed a correction. nothing else. if price goes higher from here and does not drop another 8% minimum john will be incorrect in his analysis.
no crash coming, don’t get your hopes up, the crash was 6 years ago, this is just a correction and its probably over.
Where is Andre’? His posts led me to my greatest discovery which is too valuable to share. (Just kidding) It is that lunar declinations are the most potent predictor of price movements, more that moon phase, apogee, perigee etc.. When moon is farthest north declination sell and stay out 9 calendar days (with the exception of 4/15 to 5/2, Thxgiving Day minus two trade days to 12/2, and 12/18 to 12/31 which are too strong). When the moon is farthest south declination buy and hold until moon moves north across the equator to the farthest north, again sell. If the lunar edge full plus 4 to new plus 4 coincides with the south to north movement go higher beta or double leverage as this is double strength. Highly recommend googling lunar declinations for a year, plotting the dates for far south and far north on the chart and you will see: price falls N to S, price rises S to N. Buy the way we are moving S until Oct. 28 and will then be moving from S to N, which is not a good time to be short the markets.
Steve S.,
Agree, nice find, declination is powerful. Also be aware of when declination is at 0 degrees. I don’t view it as strong as at max & min, but it works often enough. Also, I believe that Bayer had declination at Max, Min, and at 0 deg.
SC
Thanks SJC. Appreciate your suggestion about 0 degrees. Will include this in my research as a separate indicator.
Thanks for sharing this Steve. You should also look closer at the effect of nuances of the maximum north and south declinations as they do not always hit the same numeric maximums.
many thanks for sharing this!
The Fed’s narrative on interest is changing.
The NAAIM just gave up. Equity exposure down to 9.97, lowest since Sept ’11.
http://stocktwits.com/message/28086930
Is this down leg done? Be adaptive.
I downloaded the NAAIM data and did a quick regression and the correlation between NAAIM and SPX is almost zero.
Did you click my link and see the overlay with SPX in the background? or am I all wet?.Lol
If you want to see SP rebound truly or not, look at 2 commodities which reflect the global market demands. Oil and Copper. Oil could be manipulated to topple down Putin regime but copper not up above 3.00$ soon, SP in a serious trouble
Only a fool would ignore that last candle………..not sure how it plays out but being very cautious here.
http://stockcharts.com/h-sc/ui?s=$DAX&p=D&b=5&g=0&id=p37706680832
And this is my other concern:
http://stockcharts.com/h-sc/ui?s=IBB&p=D&b=5&g=0&id=p68534000977
I still think we have likely not seen John’s “second chance peak”
The other chart that makes me think that this bounce is going to far more powerful than many think.
As many know the rusty lead down along with the DAX and both have reversed very convincingly.
I would not be surprised to see the SPX test its 50 dma yet again.
Once again happy to be in cash from Wednesday. Tread carefully everyone.
http://stockcharts.com/h-sc/ui?s=$RUT&p=D&b=5&g=0&id=p04862536614
John is right about signs of capitulation. I think there will be opportunity to re-establish shorts at higher levels so one should not bet too aggressively on further downside.
Current pattern in ES, NQ and DAX futures suggests that there may be repeat of yesterday’s washout move during European session before substantial advance during U.S hours. But I think significant bottom is in.
It is time for gold to decline. Any further upside means that much more advance in yellow metal is ahead of us and 1180 was important bottom.
Thanks everyone – new post is out
The decline from the highs 2019 to 1820 was corrective; thus bulls were primed that a turn would yield a new high. AS a bear I label the decline as Wave A and the current rise as a continuing Wave B. Bull count from 1820 1 2 (1) (2) (3) thus ready for a pullback (4); the Bear count from 1820 AB 1) (2) (3) now undergoing pullback (4). Either count look for a pull back perhaps to 1926 plus/minus.
Sentiment- the bulls have never been more confident. Much of today strength appear to be panicked short covering given the sharp gains for individual stocks.