
US equities unresolved still at the time of writing, but unlikely for long.
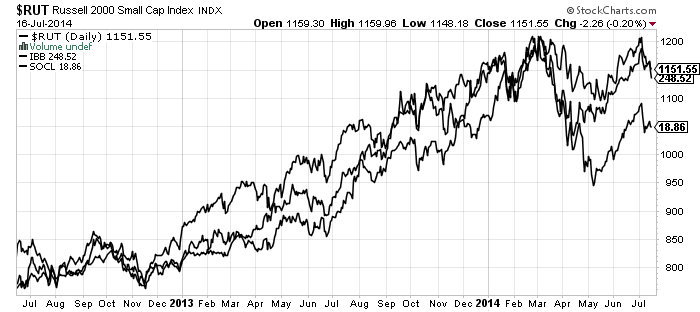
US small caps and European stock indices made a definitive trend change around the start of July, making what looks like second chance lower high peaks. The RUT was just unable to to take out its 4 March closing high, and as things stand the main speculation-excess targets of the R2K, biotech and social media all peaked end Feb / start March along with margin debt and the likely smoothed solar maximum. That’s a very close mirror of March 2000.
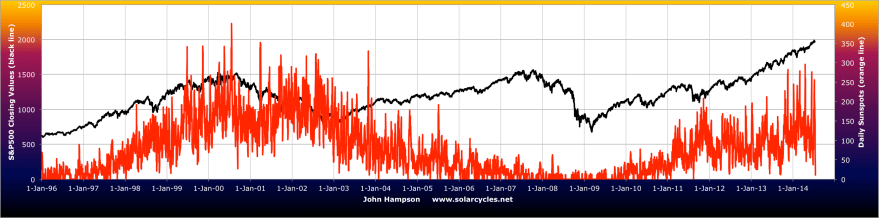
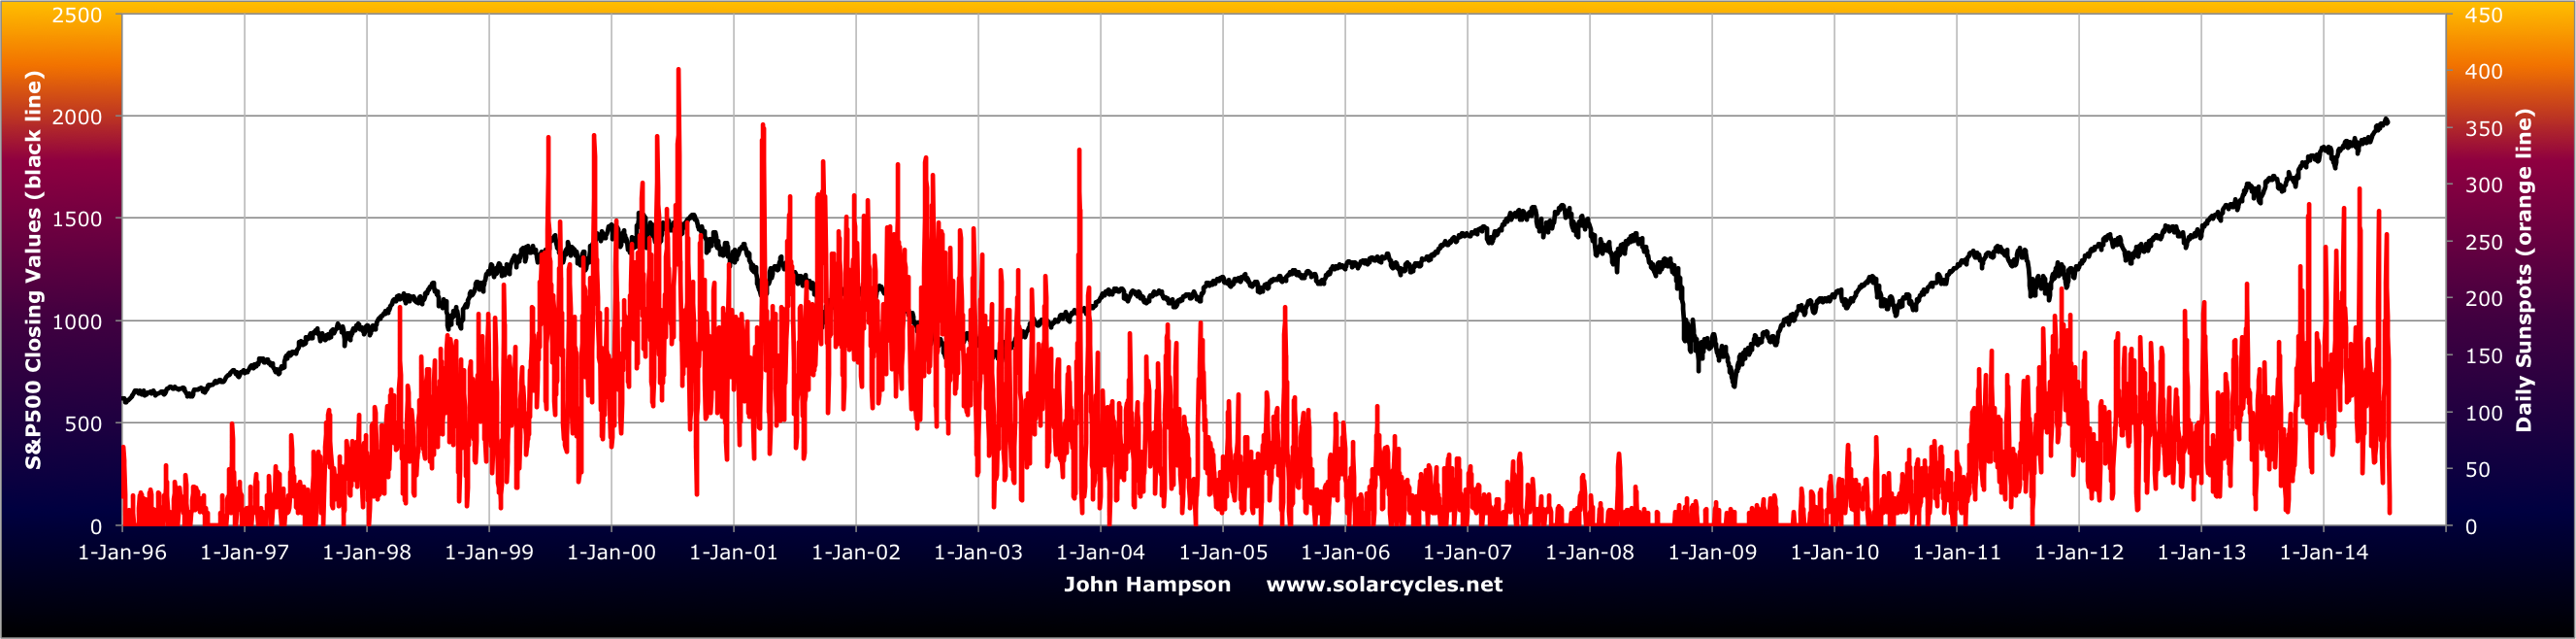 There has been a sharp deceleration in sunspots over the last few days as can be seen on the chart above, which further enhances the likelihood of the smoothed maximum being behind us, putting equities on borrowed time.
Based on the analogs of 1929, 1937, 1987, 2000 US indices and 1989 Nikkei, the second chance peak in these speculative indices and sectors should give way to a fairly relentless bear trend. Since July 3rd, they have indeed been suitably persistently weak, despite large cap strength.
For the large caps, the danger, to the bears, can be seen on the monthly charts. The NDX and SPX are still in accelerating trends:
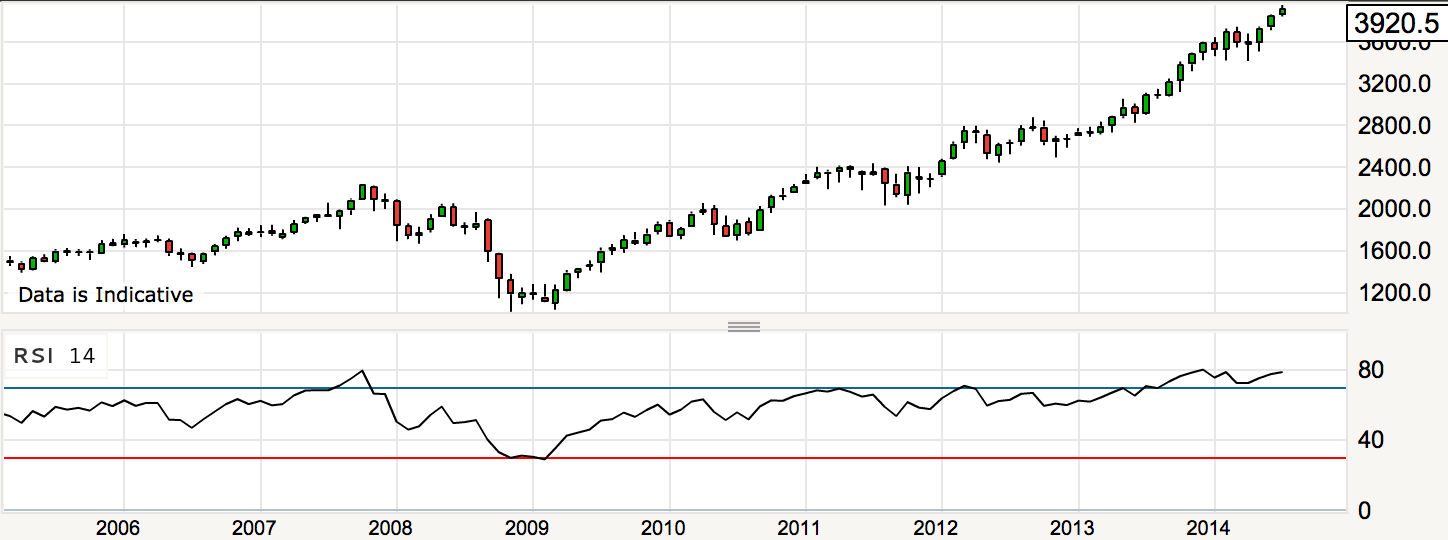
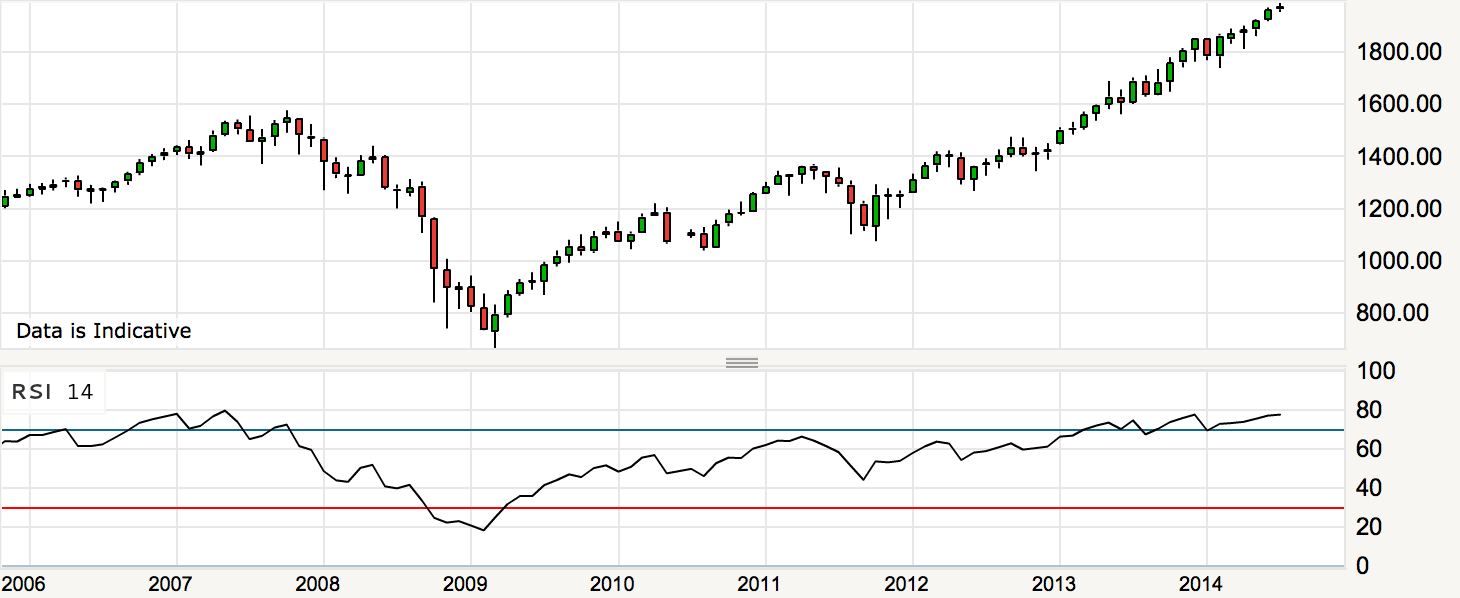 The price action is consistent with the Nasdaq into 2000 or the Nikkei into the end of 1989. On a zoomed-out monthly view the shaping looks to some degree parabolic, but on a daily basis the action was not always up and nor is it now.
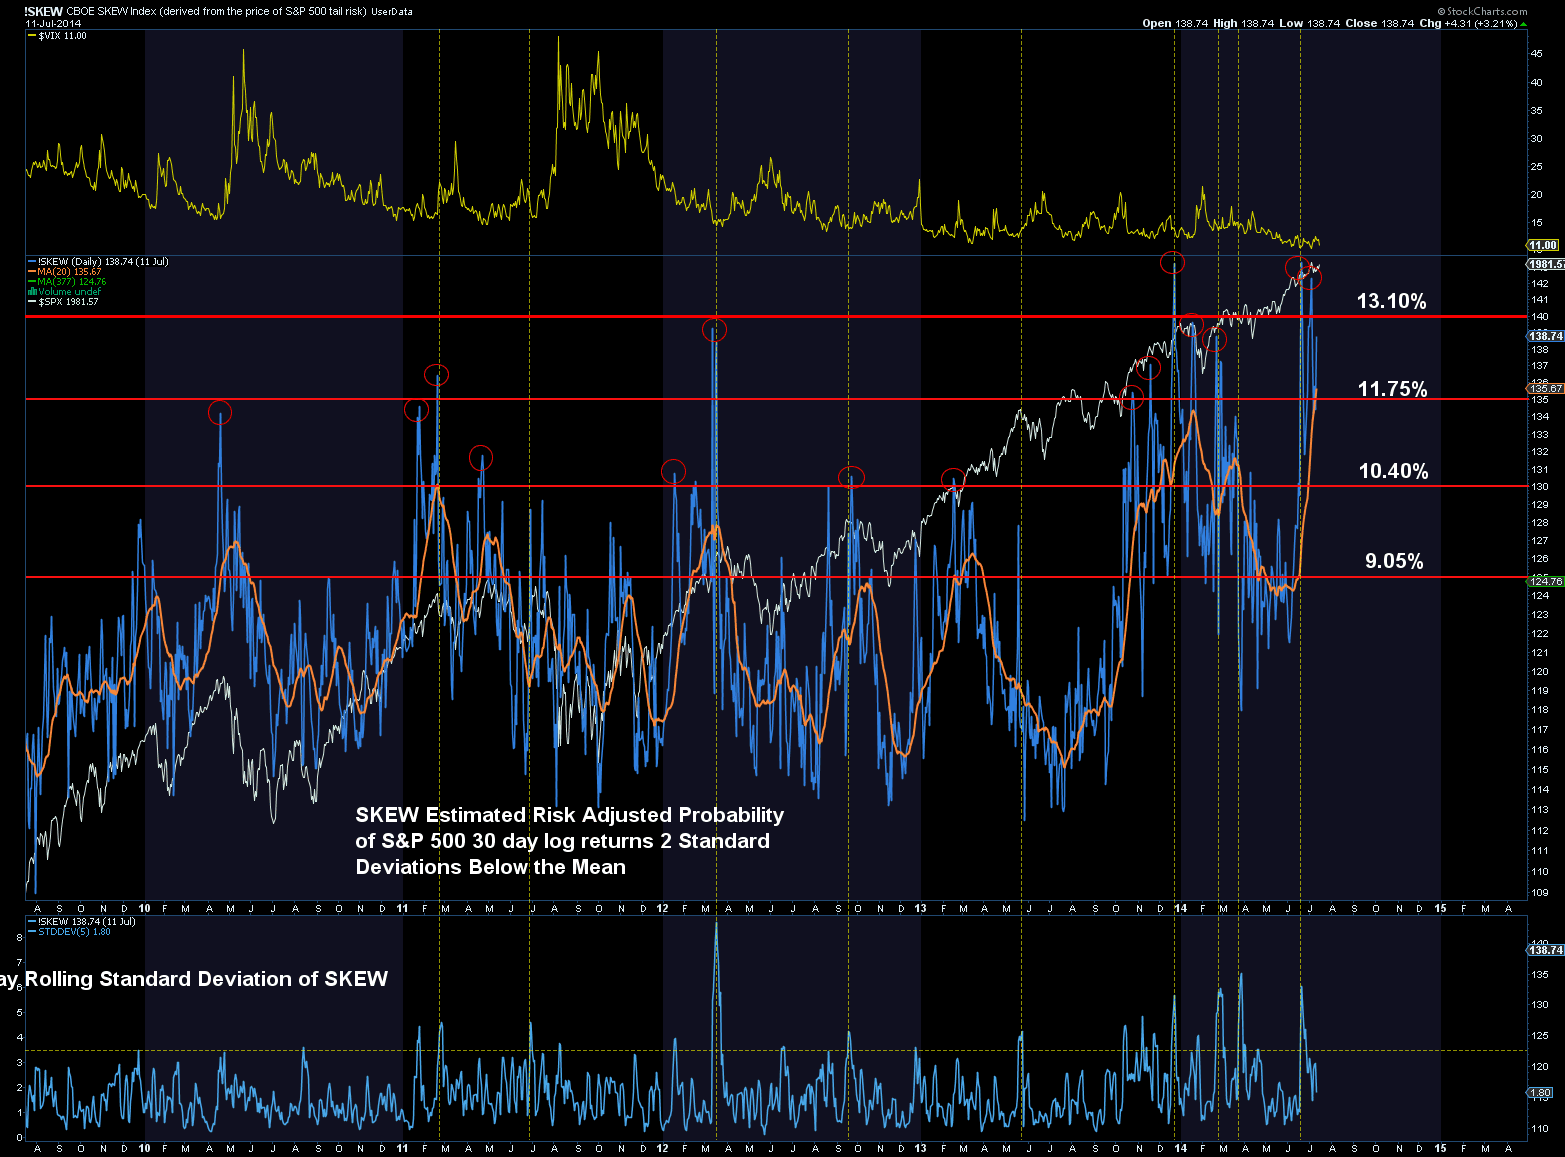
Despite the Dow printing a new high again yesterday, there have been some subtle changes recently. Gaps up have not run but petered out, some gaps down could not be recaptured intraday. NDX, INDU and SPX are all in the realm of potential double tops with 3 July, and volume has picked up the last couple of days. Divergence with small caps and European indices is unlikely to be maintained for long, meaning either they pull up and recover or US large caps roll over. I refer you to my last post and many previous charts as to the compelling case for it being the latter, and here a couple more:
Source: Rory Handyside
Source: Jesse Felder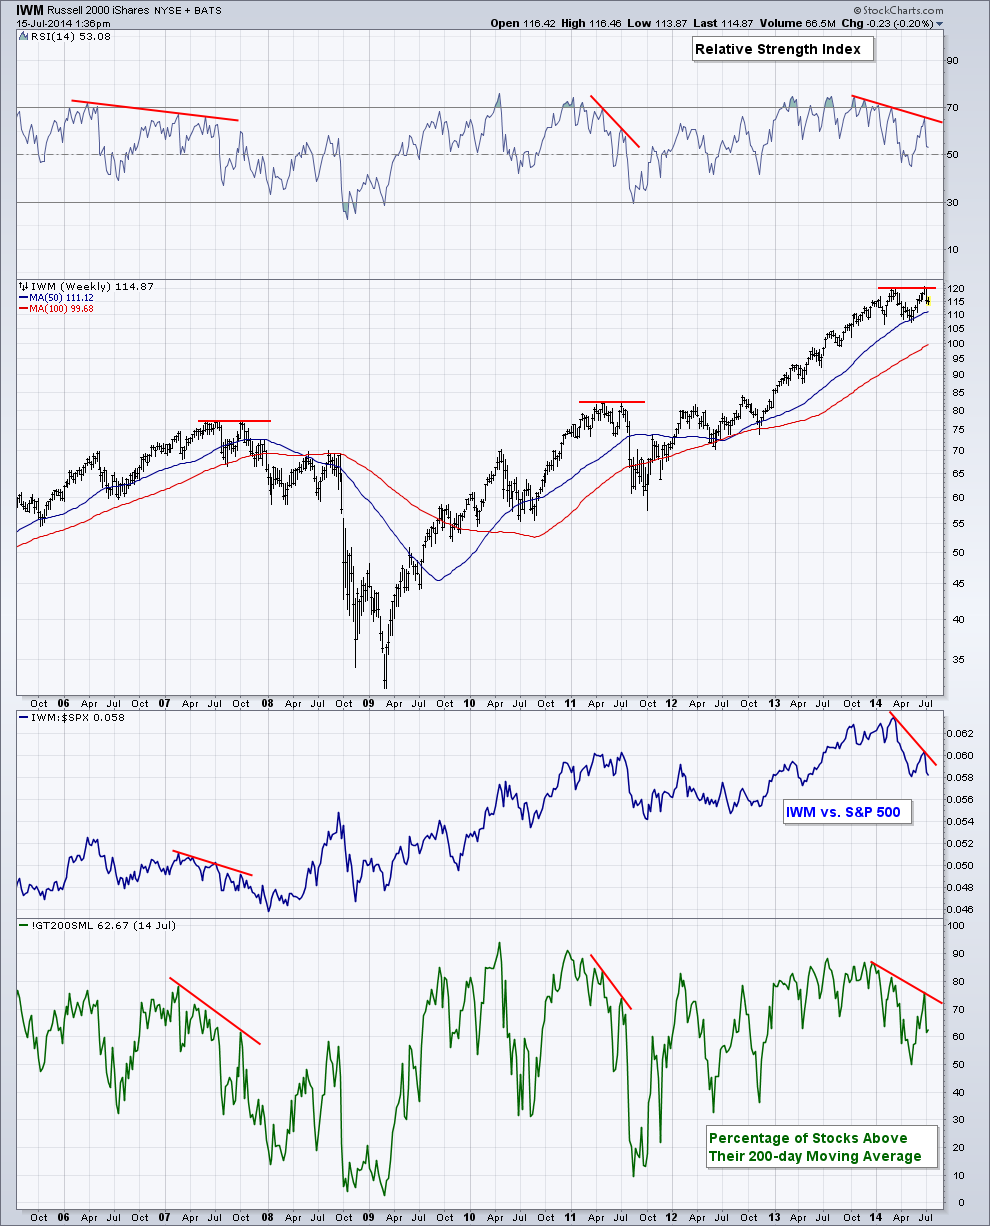 Source: AThrasher
The record stretching of indicators, both in values and by time, means the correction, when it comes, is likely to be nasty. The leverage and lop-sidedness that has been built up suggests there will be a period of waterfall selling. I don’t share the view that the stock market will correct, say, 10% and make a new high into 2015. When US large caps roll over, too many indicators suggest that will be it. As noted above, I believe this is the second chance peak leading to the eventual sharp falls. Unlike 2000 and 2007, large caps have made higher high second peaks, rather than lower peaks, perhaps in keeping with the solar cycle and its unusual higher second peak. But behind these large caps higher highs second peaks, the divergences and indicators have been telling, such as margin debt declining.
What I’m looking for. Those subtle changes, yesterday’s Bradley turn, and the potential double top here: large caps can roll over here and fulfil the last post’s charts warning of immediate decline, resolving the divergence with small caps and Europe to the downside. This is my focus. If large caps do tip over here, I will be back on the attack on the short side. If they do not, I will be looking towards 26 July, the new moon, and the rolling over of the geomagnetic seasonal calendar, as the next potential peak. I still can’t rule out the possibility of large caps continuing to accelerate upwards, but the developments in small caps and Europe and the subtle behind-the-scene changes mean the odds have shifted yet further towards large caps finally giving up. Regarding gold: it could not build up on the recent breakout so was sold-off again. I believe it will take off when large cap equities finally roll over.

I agree. Gravitationally, this week is counter trend; and European indices show this better than wallstreet.
The average monthly distance of the moon will decrease into September, so gravity should increase. As by my forecast, next weekend will give a gravitational low. Next week should thus be down. Certainly fits the bradley date +/- a few days.
Also, the amplitude of the moon – the swing from apogee to perigee- is extremely high between july 28 and august 10. Not sure what that means, but these extremes are seen only once every 12 – 18 months. I’m holding my breath 😉
Thanks John for your expert analysis and generosity.
Appreciated
Also I’d like to add my thanks for your continued sharing & views on what is one of the most unusual markets I guess many of us have seen.
I still have hedge longs against my Dow short position as it’s just impossible to know how the market is going to react & some of these spike ups are quite dangerous.
Will be interesting to see where the Dow gets to. John it sounds like if the big caps roll you’re not going to expect a second chance & a bounce off say the 200 day moving average?
Soul Jester have you any further thoughts on a Dow upper limit for this week. Looks like intraday we weren’t far off 17150 which I recall was a count you had under observation though not a probable one some weeks ago?
Thanks again John, great work & a great forum
Thanks Tim. I think the evidence is stronger for this being (or becoming) the second chance peak, with the anomaly of a higher high on large caps. If so, in all the listed analogs, the falls were then fairly swift and relentless, so we should know soon enough. The 1937 example: https://solarcycles.files.wordpress.com/2014/06/usdjind1937cr.gif
Thanks John.
It would be 4-5 months down then. Do you expect some sort of end of the year rally to end 2014 John?
Drawing the 5 analogs together, the sharp falls should last 3-8 weeks. Then they predict a multi-month slower partial retrace of the falls. I want to exit shorts once the sharp falls have hit.
Some Doctors say about Cancer that Genetics give you the condition and lifestyle is the trigger. About the markets turning down you could say Fundamentals provides the condition yet we still need a trigger to make it happen. I am looking to something in Europe but don’t know what it could be. Maybe the Banks again.?
John I think it will be something from left field. I am leaning to Japan, but…….?
Europe is walking a tightrope with rising wedges breaking now!
http://blog.kimblechartingsolutions.com/2014/07/europe-is-walking-a-very-fine-line-here-watch-the-next-step/#sthash.Hkkc1TLa.dpbs
With OpEx tomorrow, any sell off is likely to ve postponed till next week.
Much sppreaciated John.
Thanks
Thanks for your efforts and kindness. Just to share with you.
China has officially entered recession now, judging from the following latest numbers.
1. GDP 9.1%, Inflation 6.3% (the truth is GDP 6%, inflation 16%)
2. Purchase Management Index : lower than 50 (forbidden to be published)
3. Iron ore piled in ports : 98,900,000 tons.(2008 = 70,900,000)
4. 4 local governments are allowed to go further for monstrous debts.
5. Manufacturing in Southern China has been reduced by around 50%.
Where do you get your numbers? Eg. Inflation 6.3%.
John, only the naive will believe what the government published, especially in China. Ask anyone in China about the inflation they experienced in the past year, nobody will give you less than two digits.
John, apparently you did not receive my last post on gravitation? I hit ‘post comment’ but it never appeared? On another note, I e-mailed Robert Taylor and he stated that all my questions to him are contained within his book: “Paradigm”.
The “7” event of which the IMF spoke of? As in 777.
Thanks all. No, eclectic, not received.
Nicely timed post – daily bearish key reversal on the Dow. Looking back to April for the last one of those: http://scharts.co/1qj0GjP
Rightly or wrongly ….my bears were opened up again on stops at 1959. I doubled up at 1956 when it closed below 60.
Fingers crossed.
Is this the September ES futures? Otherwise it is a pretty tight stop.
I said in regards to a trigger “something from left field”. It couldn’t have been much mre left field.
I would like to ask the more experienced market watchers, do you think yesterday’s price action has now changed the tone & perception if the market or will there be a bounce back?
We need to see follow through now to inflict more technical damage to the large caps. Currently they show an ABC correction off July 3rd, but another significant down day would morph that into something more telling. If yesterday does turn out to be the key reversal in large caps then, interestingly, sunspots dropped to zero.
Many thanks John.
The European indices are definitely in far worse shape technically than the US. I agree John, there needs to be follow through to inflict more damage to US indices before we see a potential major sell-off.
That said, volitility had one of its biggest days for a very long time. In recent times, even on substantial down days volitility didn’t react as dramatically as yesterday so that may be foretelling. On top of that the small caps and biotech that lead the sell off in March failed to make new highs on this rebound. That is SIGNIFICANT IMO.
Bottom line, there’s been some false starts but I think this is it.
If sunspots permanently die away soon while the solar magnetic field remains near zero, then we will be witnessing something new. If it happens, it will give us a chance to narrow-down just what it is from the sun that causes speculation – in other words, is it visible sunspots (ie. facing earth) or is it the solar dipole.
Visible sunspots have dropped to zero, but the far side of the sun is still quite busy. Looking back through 2014, sunspot numbers have consistently peaked around 25/26 days apart on average – that’s remarkably close to the Carrington rotation of 27.27 days. So it seems that one half of the sun (longitudinally) has been much more active than the other.
My view is that the weak dipole is the driver of speculation, and sunspots are merely a visible symptom of that. So sunspots will continue to revive, albeit at modest levels, and this persistence is more important than the level and timing of the smoothed maximum; – this would be comparable to previous weak solar cycles.
A nice map of the far side and visible sunspots.
http://www.raben.com/maps
Excellent. I’ve added that to my favourites.
Thinking aloud I wonder if, given that A) Venus-Earth-Jupiter alignment affects the tides in the sun’s plasma; and B) all of the recent geomagnetic activity has been uncannily directed away from us, is our observation position from Earth actually influencing how the sun behaves and therefore what we see?!
Mark,
I really appreciate your study on sun.
I want to know your thinking on tides or gravity related concept put forth by another good reader Andre.
Andre had pointed equity market movements could be predicted using combination of tide (short to medium term) and sun (long term) ?.
Is it possible there could be combination of multiple natural forces NOT just sun? What do you think?
Jigs – I’ve no doubt that there’s a combination of natural forces affecting us. Each cycle is complex (being driven by a life-or-death struggle for limited resources), but also each cycle is modulated to some extent by other complex cycles. Humans are incapable of understanding the size or age of the universe, so we will never be able to discover all the things that affect us (never mind how they all interact).
I don’t know much about Andre’s work, but I’m sure that gravity does affect us. Some of Andre’s dates coincide with some of mine; like 11 July and 8 August.
Our ocean tides are driven two-thirds by the moon, and one-third by the sun: so there is an inter-relationship there. And the gravitational attraction between moon and sun is significantly greater than between moon and earth. The moon-earth barycentre is below the earth’s crust (about a quarter of the way to the earth’s centre), so it must affect seismic and volcanic activity and climate to some degree.
There are even observations that plant buds develop shapes depending on the moon’s alignment with certain planets: http://budworkshop.co.uk/
And detailed local records of total solar eclipses in India (going back a couple of thousand years) show that they often occur in different locations to where scientific organisations like NASA calculate they should have been. These discrepancies usually happened during lunar standstills: so it seems that tidal changes associated with the standstills have different effects on solid land compared to liquid ocean – causing a temporary and very slight alteration to the speed of earth’s orbit: http://chiefio.wordpress.com/2014/01/25/a-remarkable-lunar-paper-and-numbers-on-major-standstill/
With all the complexity around us, and speculators continuously trying to anticipate and out-smart each other, I’m not surprised that its impossible to reliably forecast anything!
Brilliant thoughts Mark. Really appreciated. Please continue posting your views on Sun and Markets..
I use historical patterns and think 2014 is like 1998 and most likely we will see strong correction in S & P 500 only around Oct end when QE ends. I do expect imp top on 5th Aug but I guess that level may be crossed in fast and furious rally again in Sep/Oct 2014. I could be wrong.
“Any living being is a machine attached to the cogwheel of the universe. Although at first glance, it is influenced only by it’s immediate surroundings, the field of external influence spans indefinitely. There is no single constellation of stars or nebulae, the Sun or planets, in the depths of unlimited space, nor wanderers of starry sky, which somehow do not affect it’s fate – but not in the vague and elusive terms of astrology, but in a firm and reliable sense of the natural Science.”
~ Nikola Tesla
Hi John,
I am in agreement with you, the recent swing top looks like
it will end up as the high for at least a 45/90-day rally phase,
which targets additional weakness into August on the SPX.
a week or two back I posted a few charts, where the cycles
were looking for a July 10th bottom, rally into July 16, here
was that original chart:
http://goldwavetrader.com/page32.html
the updated chart has us lower into early-to-mid week, next
week, which favors the opening strength with the futures to
fail, then lower into the same. Gold I still have down to the
1280’s into late-July, next good low there. here are both
charts, updated to the current action:
http://goldwavetrader.com/page36.html
with that, the stock bears look to have the upper hand, at
least for the coming weeks, though I don’t see an important
peak in place; that should come later in the year, some
focus on the month of September, ‘crash’ type scenario
for the Autumn months.
I still maintain my 2 top scenarios ( for the Dow Jones)
1st> a drop about 8%, like beginning year> 15.7k Dow Jones, similar to ago´07, but this time no new highs in sep´14 and a plunge ( I talked about this point) .
Alternative> A drop 5-10% followed by a huge spike to 17.5K till sep´14 and end if the bull mkt.
Russell and european mkts might be in a down-trend or in best case could reach in sep´14 the prior crests.
@apanalis
Hi Antonio, when do you expect the beginning of the drop?
Another question. Do you have some web or blog? if so, can you share the link
Hi, Jordi, the beg. of the drop likely end jul´14 from the top 17.2.3.4.5K or as said again up in sep´14 in those levels or below.
It could be a mixture.
Anyway, from jun to sep´14, the top, within a mid correction about 8-10%.
No blogs, only on Twitter some clues by @apanalis and in spanish Forum I´m cocacola,
no correction, just bears carnage.
total ridicoulus market today
This market is intriguing. Whipsaw this way & that. Can’t believe we’re only 50 odd points from the record intraday high on the Dow.
Something doesn’t stack with this resurgence. Oh well, 48 hrs in the markets is a long time. Sometimes best to do nothing. Wish I had.
So, this doesn’t feel like next week is going to be a down one IMHO. Hope it is but would appreciate some tech reviews on what’s happened today.
Thanks
Basically, Friday is always up, almost 😉
Bears, I am giving out free hugs today.
(o\—/o)
( , , )
,~~._(_(T)_)_,~~.
|”–“,-“-,-“-.”–“|
| ( hug ) |
| “. ? .” |
| _,-.”._.”,-._ |
‘-(ooO )—( Ooo)-‘
((_) ) ( (_))
“–” “–“
Spectacular waves in what looks like kind of degenerated triangle. Yesterday it was “unexpected” move to the bottom of range in “c” wave. Today, equally surprising “d” wave move. If this theory holds true then we should have one more washout on Monday before final run to S&P 2K or bit less. With that speed of moves final top can happen next week. What happens afterwards will surely be for history books. I hope it will not resemble August 1914
4th wave behaviour is the most unpredictable of all waves. Just know that it has not clocked out yet and abc still in c. Thursday was geopolitical. Friday was options expiration on top. I go on board for 5th on tramline projection point. Expecting 5th of 3rd to equal 1st of 3rd. Then Primary 4th could see John return to solvency. Why Elliott theory has so little support is beyond me, just like these markets would be if I never found out the reality about it.
All this information to contradict and the theory just keeps churning out its own predictions without a glitch. Most of all its public domain stuff. Right there on a plate, but the diners want spoon feeding with waffle and syrup all days long..
Looking for major trendline break on Russell Index:
G-files. part 3
Let’s stir things up a bit.
My forecast said this week would see gravity down so an upforce in the market. It also said that gravitationally it would be a counter trend wave. Those are choppy in nature.
So what happened Thursday? Was that a plane shot down or Israel starting a ground war in Gaza? No. I said it before; news follows the markets.
To explain this one I need to introduce a new concept : inversions.
Inversions are just another kind of analysis on tides. And they tend to reverse the trend – for a day. Believe it or not, but Wednesday night there was an inversion. So Thursday had to be a down day! It was gravity after all. And as the week was still up (I said a gravitational low in the weekend) the market had to go up on Friday. So there was nothing unexpected or surprising about that.
Key thing to understand : gravity is a natural process. It’s not an on/off thing. It has many faces. Simply put; if gravity is a driving force for markets, it must be able to account for all the things we see in the market, like strong trends, consolidation periods, round and sharp turns, etc.
From now on I’ll include the inversions in my analysis.
One more analysis I need to mention : the tidal pivot period. Every day we have 4 tides. And every tide has it’s own extremes. So for every gravitational turn we need to see 4 tidal extremes. Sometimes they come within 2 days; I call that a sharp turn. But sometimes they take 5 days to complete. And still this is gravity. I call this a round turn.
Lets revisit last weekend, using these tools. Thursday we had the full moon (electrical momentum) and I had an inversion. So Thursday was technically the low. But my forecast gave a turn that weekend. So Friday last week was rather flat, as electrical momentum improved but gravitational momentum did not : they balanced out. Monday came an upday, so something changed in the weekend. But the tidal pivot period ran into Tuesday. So gravity was improving but the turn was not yet complete (still one tide to go). So Monday and Tuesday were up but consolidating (Tuesday down).
Wednesday was a strong up day (in Europe 1%+). Now the gravitational turn was complete and pop!. It wasn’t about Chinese growth data; it was gravity. Thursday another inversion and yesterday up as the turn must come in the weekend.
Why do I tell you this? I strongly believe that if we get the analysis right we get a great feel for the markets. Robert Taylor; who wrote Paradigm, claims an 83% accuracy (and charges you 125 dollar a month for his analysis). In all modesty; I think we can do better, as this is the only site that has a multiforce focus.
So what do you think? Would the analysis that I gave above add to this discussion? Inversions and TPP are as predictable as anything else. So I’ll include them in my posts going forward. All we need to do is get the analysis right. Just hope I was able to show that with the right analysis you can really forecast the markets.
Tomorrow I’ll detail the forecast for the next two weeks- including a full analysis.
Have a nice weekend.
“News follows the markets”
So being around ATH makes the Jews kill Palestinians? Or ‘gravity’ causes Boeing 777 to crash, so that Europe escalate sanctions on Putin? Or just the news follow the events – i.e. a rope around USD neck?
http://rt.com/business/173008-brics-bank-currency-pool/
No, gravity does not cause a plane to crash. All I mean is that analysts need to find an explanation. Basically; these events do not cause market reactions; gravity does.
John,
Thanks for the continued coverage of the markets. I certainly find it an excellent resource for technical analysis. My personal opinion is that this bull market is not over. Going into this year I shared your bearisness for a large drawdown but events this year has made me think we are due for a run of the mill correction (based on the fact that margin debt is declining). I find it hard to view the Dow Jones as a second peak because the definition at least from my perspective is that it should be a lower high. I.e. a sign that bulls no longer have control. I think the winning streak without a 10% correction gives the feeling of euphoria. Ryan has put together an article on winning streaks and outcomes that i found interesting: http://awealthofcommonsense.com/stock-corrections-long-streaks/
Time and Price have converged:
http://www.traderplanet.com/commentaries/view/166851-s-amp-p-500-price-and-time-have-converged/?utm_source=newsletter&utm_medium=email&utm_content=7&utm_campaign=1986
Boeing 777, flight MH17, 17:?? local time, 17th 07 2014, that foolish IMF video about number 7 makes Christine Lagarde look fishy.
Wow
Slater9, where are you? Was that an 88 on Friday?
How much time and money lost by bears in these years…savings, life, work, destroyed by Goldman Fucks and central banksters who laugh watching these idiots shorting the ridiculous market going vertical…how many set ups or events or coincidences or ugly facts have been token by really no smart traders to encourage theirself to sell short this bubble that has no limits…or maybe has one limits when these traders will have no money left in their pockets. 2500 3000….what is the limit and when…if you don’t trust goldman fucks stay away from the market and spend youf money in a better way.
Thanks all