
Wim Grommen argues there have been 3 industrial revolutions: 1780-1850, 1870-1930 and 1940-2000. They terminated with major peaks in the stock market and then gave way to degeneration phases.
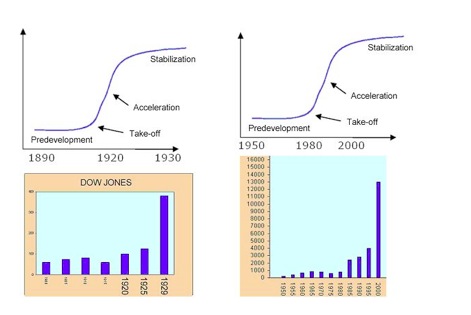
Source: Wim Grommen
My perspective is demographic booms in the 1920s and in 1980-2000 made for economic and stock market booms, culminating in mania peaks at solar cycle maxima, and then giving way to prolonged economic downturns and secular bear markets once demographics turned.
A third perspective is that both episodes in history were based on a major run up in debt, or prosperity taken from the future:
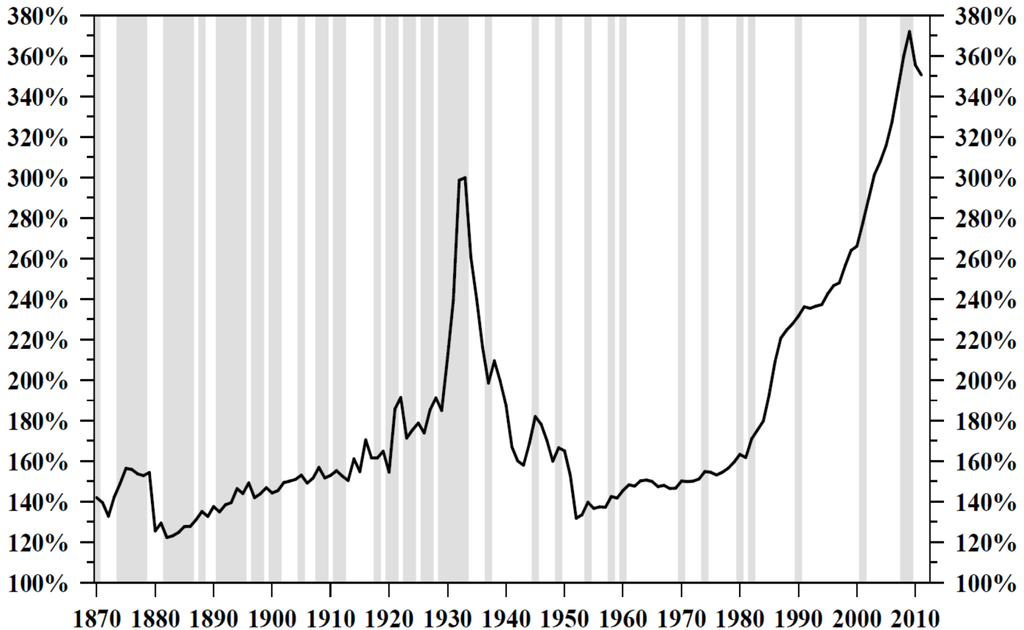
In short, the two periods rhyme. Parallels have been drawn between the Great Depression and the Great Repression in terms of severity of crisis, slowness of jobs recovery and bank failure risks. Similarly, central bank intervention became a dominant factor, with ZIRP and emergency spending programmes being required.
However, the Great Depression was much worse in impact when we consider number of failed banks, level of economic decline, drop in prices, and this despite the 2000 asset boom being a more extreme mania than 1929. One key reason for that was the aggressiveness of central bank response this time round, with more flexibility and conviction to draw down harder and faster on prosperity from the future.
Central banks cannot overcome demographic trends and post-mania busts, but they can postpone their full impacts if they are prepared to pay for it, helping stop the devastation being so front-loaded. So, the bear market from 1929 to 1932 was totally devastating and took valuations straight to bottoming levels (shown at -56% below), whilst the 2000-2003 bear was halted at still expensive valuations. 2009 then washed out valuations lower, and I believe we are on the cusp of another bear which will wash out properly. In other words, central banks have succeeded only in phasing the devastation, and the next leg down ought to be the worse: more of a deflationary depression.
 Source: DShort
That projection can be cross-referenced with the demographic trends chart further up the page, and is further strengthened at a global perspective by similar demographic trends in Europe and China.
Between 1932 and 1937 a cyclical bull market erupted with distinct similarities to today (see post here). There was one solar cycle between the 1929 and 1937 peaks, and one between 2000 and 2014 (shown above). The 32-37 bull topped out along with the solar maximum in Spring 1937 with no divergence in cumulative advance-declines, which I believe will mirror today: an all-in peak at extremes in valuation, sentiment, leverage and complacency.
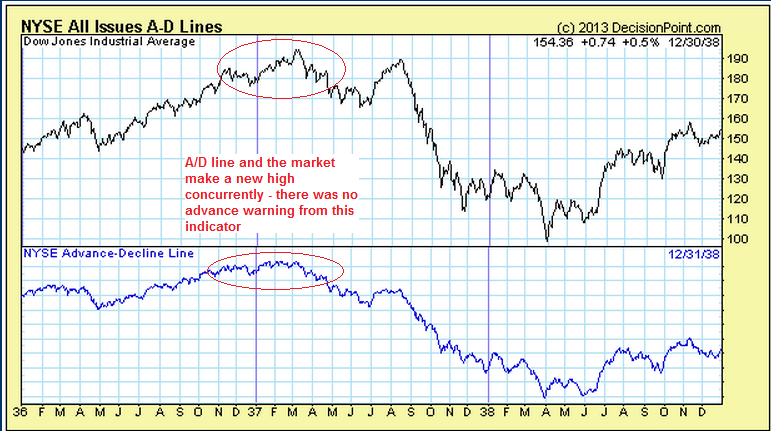 Source: DecisionPoint
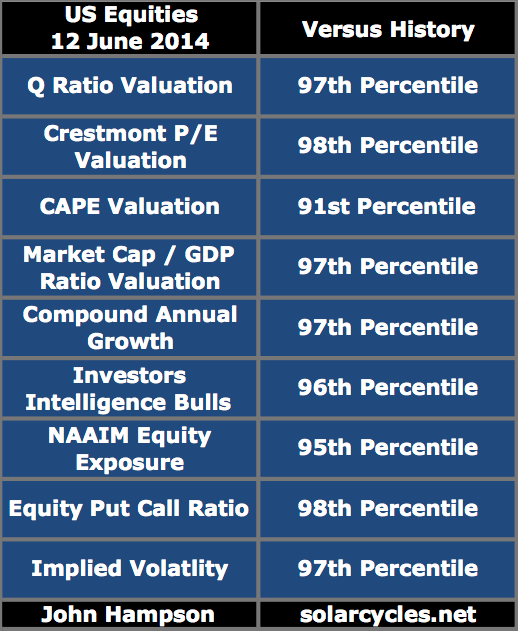
Here is evidence that we have reached such extremes:
And the bubble-end flag is raised:
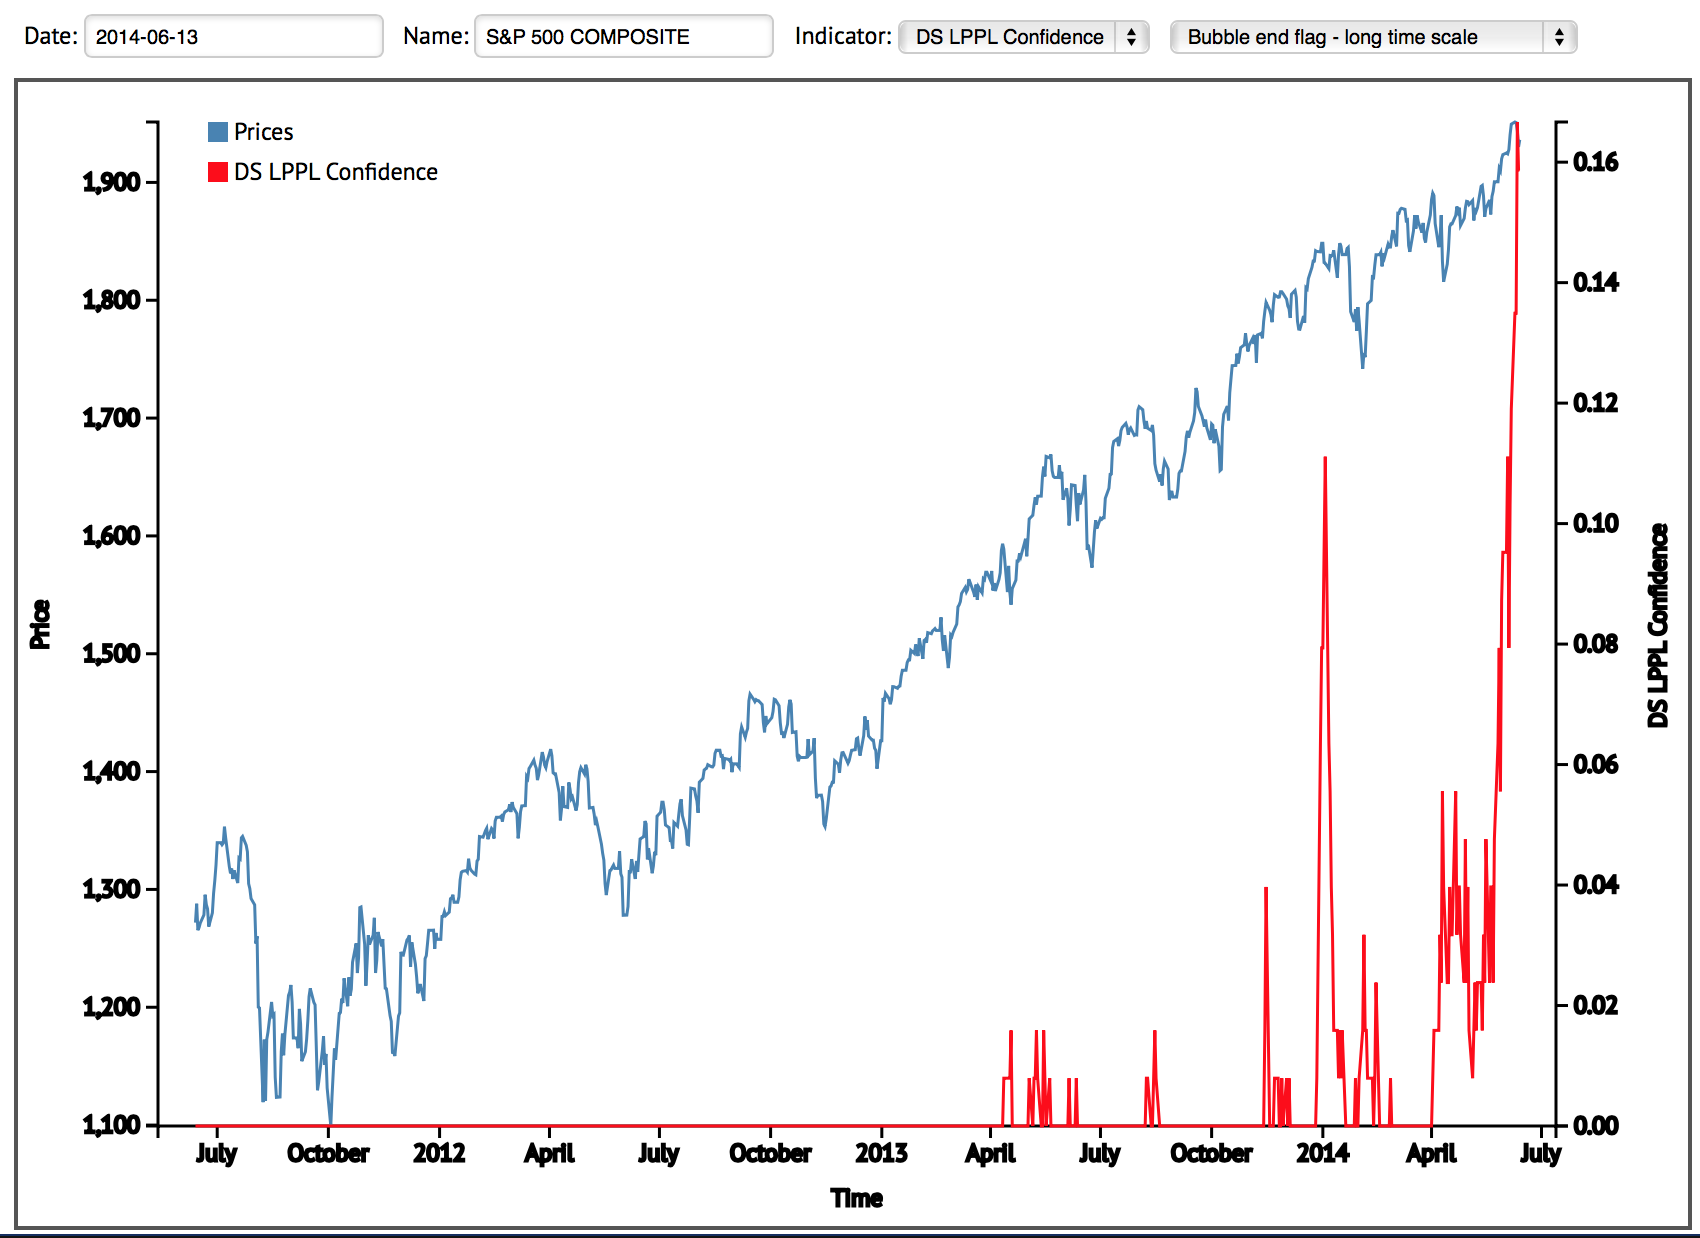 Source: Financial Crisis Observatory
And this fits with solar cycle maximum peak-speculation timing.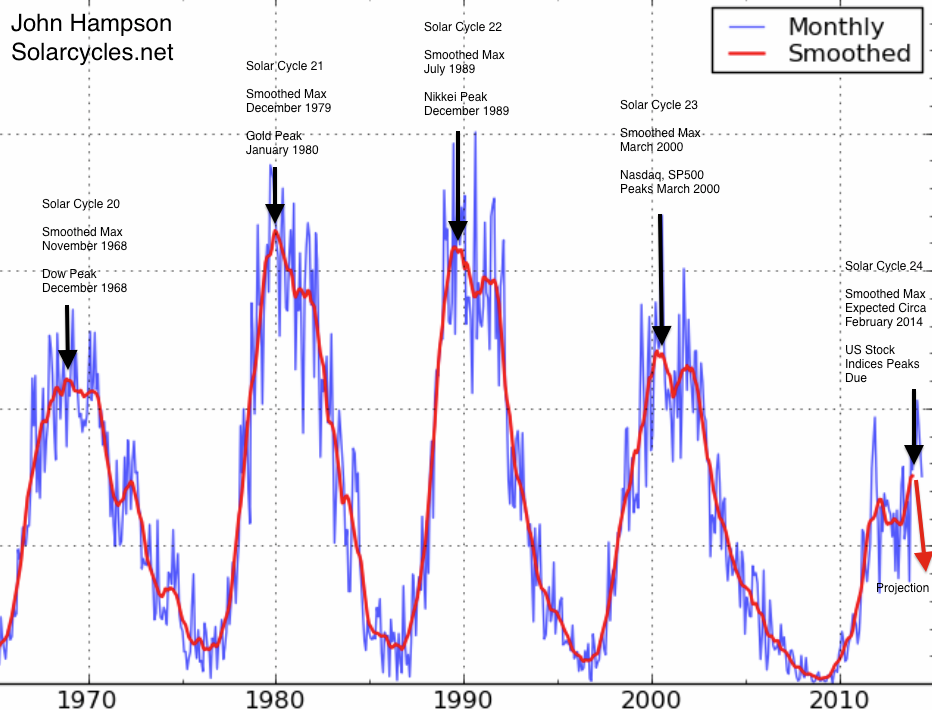 Friday’s session provided a bounce at the full moon. The bounce came at an important level in the large cap indices: a backtest of the ending diagonal or wedge. As full moons often mark inversions, that gives two reasons for stocks to rally again from here. However, by various indicators further declines appear more likely, and such a development would then fulfil the ending diagonal overthrow pattern, whilst ensuring lower highs are maintained in the small caps. That would then enhance the likelihood of all the indices having peaked and the smoothed solar maximum having passed. Emerging new up legs in gold, miners and silver are another clue that could be occurring, whilst geopolitical developments in oil could be a catalyst to end the complacency.
The best cross-referenced case I have currently is that the smoothed solar maximum, RUT, COMPQ, IBB and margin debt all peaked out around February/March. The majority of solar forecasts support this, and we have seen various asset peaks between December and June around this centre. The Sornette bubble-end is flagging again here as sentiment, valuations and complacency are all at the level of extreme that would fit a reversal, plus certain divergences are mature. The selling on Wednesday and Thursday did little to reset the short term indicators that would suggest stocks rally again now.
However, the risk remains that the solar maximum could potentially get stronger yet. Solar scientists have not so far done great in their predictions for this cycle. They are generally united in projecting a waning sun for the rest of this year, but SIDC still continue to run with an alternative model which would delay the smoothed maximum until the end of 2014.
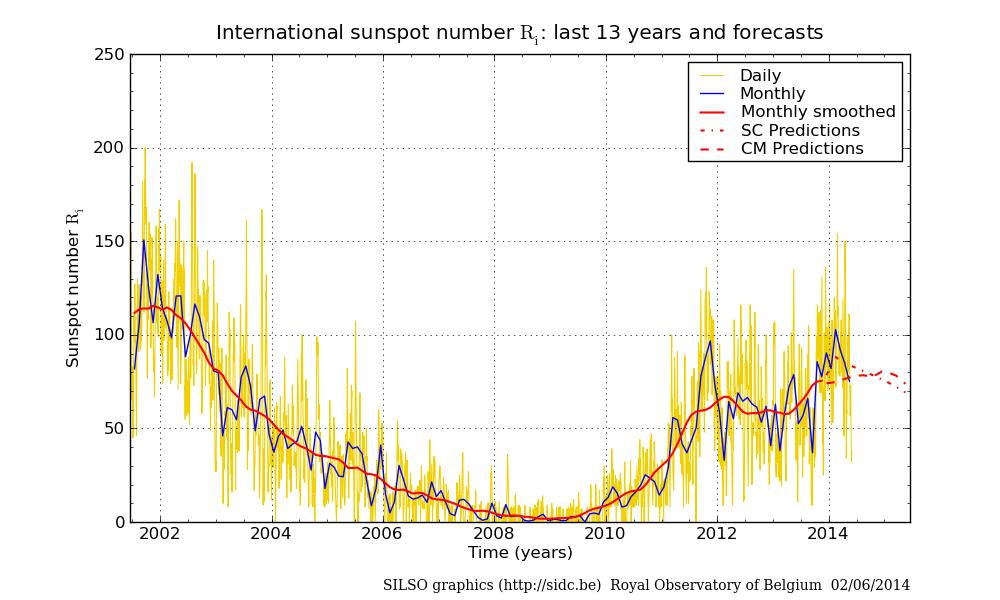
Source: SIDC
Right now sunspots are high again as the sun has leapt back to busy in June after three months of waning, so I continue to monitor. Cross-referencing again, if the smoothed solar maximum were still ahead, then we ought to see large caps hold their breakout here and continue to advance, the other indices break upwards to new highs (invalidating their Feb/Mar peaks) and margin debt reverse its waning trend.
So, as things stand, the highest probability case is for this to be the end of a topping process that began at the turn of the year, with the solar and speculation peak centred around Feb/Mar. If so, then stocks should fall again this coming week, fulfilling the ending diagonal and bubble-popping, and completing the ‘second chance’ lower peaks in RUT and COMPQ. If instead the large caps hold the break and rally upwards, taking the Nasdaq Composite along to new highs in the process, then it would strengthen the case for the solar maximum and peak speculation to be shifted along to at least June, but potentially to even further out in the year. An important week.

John,
Tue and Wen are the peaks of this lunar month, for your reference.
Thanks for your efforts in generous sharing. You are a good man.
Great reports Yes your efforts are generous and commendable Thank you
Thank you both
Hi John,
If this is the top as you are expecting, then what is the pullback we are looking?
10%-15% bull market correction or more like in the range of 20-50% to kickoff new bear market.
By history, my target is around 4-6 weeks of panic selling, whenever that erupts. An unorderly unwinding of the leverage, and potentially around 30% falls.
Great work John,
I have come to the same conclusions based on my own analysis but it’s re-assuring to find others reaching the same conclusion through their analysis.
I would be interested in your opinion of my analysis of the CAPE index which can be viewed at;
http://www.advisorperspectives.com/commentaries/relevant_120313.php
Thanks Relevant. I agree with your post. The only way CAPE could be maintained at overvalued is if demographics were supportive, but they are not.
Everyone should look at that CAPE chart. Shiller’s CAPE is dismissed out of hand daily on CNBC by perma bulls. They obviously have not seen that chart. It nails down the 1937 comparison. Thanks.
PS Shiller called the 2000 top and the 2007 real estate top! I don’t dismiss anything he says!
There is a Bradley Turn date for 7/16/14 Going down all the way to 11/20/14 until the next significant turn date.
http://forbestadvice.com/Money/Gurus/DonaldBradley/BradleyTurnDates2014.html
Thanks Mae
Last year this meant nothing at all. Think Bradley is more of a relationship to inverted geomagnetism.
Superb post again John, thanks.
Thanks Robbie
30% decline. Others seem to agree
Robbie, Chris does say in his post that only a little over 50% of the time the asset that forms this pattern ends up falling in price. So I put this pattern in the category of a coin toss.
gary, I agree but other indexes are confirming, check out the fractals on RUT I posted
the end is nigh post, the links are at the bottom of comments
THEY REALLY ARE ALL IN NOW
And with the 2014 calendar nearly half way done, and the macro hedge fund community not only underperforming the S&P 500 for the 6th year in a row, but generating a negative return YTD, what is a macro hedge fund universe to do? Why lose all pretense of being sophisticated fundamental trend pickers and do what Bernanke and Yellen have been forcing everyone to do from day one: go all in stocks of course! According to JPM as of this moment there is no difference in the positioning of both traditional long/short hedge funds and macro funds, both of which have increased their equity exposure to the highest since May 2011!
MAY 2011 JUST GETS BETTER
What does this mean? Well, unless corporate buybacks are about to have their greatest quarter in history, virtually all the “macro hedge fund” money on the sidelines, to use the most idiotic phrase in existence, was just allocated to stocks in the past three weeks. Which also means that there is nobody left to buy. However, with the global geopolitical situation getting worse by the day, there may suddenly be quite a few willing to sell.
If one is looking for a meaningful fall in equities……it is worth noting that the level for Brent to reach that has triggered things in recent years is 126.
Cycle analysis could be saying that’s it
http://www.traders-talk.com/mb2/index.php?s=da48548292b0c0d4ce38e523486df92f&showtopic=154680
fwiw: http://www.thestreet.com/story/12744727/2/reasons-to-sell-stocks-cantors-defeat-and-the-market-best-of-kass.html
ISIS provides similar images of horror like Nanking in Dec. 1937 not enough to sour the bulls’ mood for more. Not yet!…. so more patience for the bears is imperative.
Are we selling near the top /turn of a “n”? Is this time different and the market will never go down below the current level? and bears sure to lose?
There are always slogans to believe throughout the history, like “the war to end all wars”, “stock prices have reached a permanently high plateau”, etc.
You know the rest.
totally distorted markt
http://www.zerohedge.com/news/2014-06-15/cluster-central-banks-have-secretly-invested-29-trillion-market
Interesting – helps explain why QE is not to blame directly per se.
It is very clear, TPTB print money to inflate their wealth by transferring all the costs and obligations to future generations. What a ‘wonderful’ world.
SHOCKING, just read it, whos left to buy?
Martin Armstrong also reported on the central banks buying stocks…but how long has this been going on? John, MA believes that we are in a shift from public (bonds) to private assets (equities) which, If I understand him properly, means this bull market will go on until this “business cycle” concludes…which is late 2015/early 2016. I’m starting to see how this can continue up for a very long time, regardless. But one day we will burn the house down.
So how can one find out what equities the Fed owns? Anyone?
That is also my favoured outcome,
the business cycle needs to turn and pressure
earnings before this bull dies.
You can still have serious corrections with in
a continuing bull trend.
Multiple reasons to be cautious currently,
yet bears appear unable to gain any traction.
Will this week be any different?.
Based on all of Johns excellent work, it’s hard to imagine this market hasn’t cracked, even now as the IMF has downgraded the US to 2.0 GDP. Geez… With financial engineering, stock buy backs, low interest rates, multiple expansion, CB stock buying, not sure what’s left to manipulate. Except perhaps one thing….countries defaulting, one by one, sending capital flows racing into the US markets. This is how we get the parabolic rise without demographic support. I could see this taking 1-2 years easily. As MA says, money has to go somewhere. A correction at some point this fall would buy the time needed for all this to play out. Just some thoughts.
My take.
As I ve said before, the price the SP would have reached without Ukraine would have been 1950 – 2250.
Well we have just got there. Just. We have the backtest to the rising pennant and now positive lunar energy to the end of the month – the end of the quarter.
I have put stops in at 1925. but am holding fire to see if a rally can make new highs. The higher the better. This will leave a conviction sell for the 3 quarter maybe down to 1735 where there is a gap.
2250 ….READ 2050
Another great piece from John. Interesting is that major wars happened in the middle of inflationary expansions like Napoleonic wars or first world war. 1850-1870 is marked with significant crises like 1857-1858 crash in US and Germany, 1873 panics in New York and Vienna bourse. But some historians assume this long depression took from 1873 to 1896 which precipitated inflationary boom of 1900s and Great War after which many countries went into hyperinflation phase.
.
From that point of view, if head for major war in next year or two it will be more similar to WWII which began early in the newborn inflationary period (late 1930s)
In the meantime however another short squeeze may be in the cards if the move in futures is not arrested quickly. ES contract did not even test its previous resistance zone, only Dow contract did it briefly. If it gaps up and does not revert at the beginning we will head for new highs in quick order and VIX will revisit 10-11 zone. On the opposite, gold needs to rally immediately.
BEAR FLAG on s&p looks best on 4hour chart
praying it leads to a nice big fat drop!!
Last chance for bears today on the Fed
statement, otherwise bulls may have
continuing control over the summer.
Multiple reasons for caution currently but
bears have been toothless and unable to gain
any real traction.
John continued excellence. Love your ability to synthesize so many varied sources into a cogent perspective. And it seems to me that your many references are not only generous in spirit to the authors, but also lends a certain objectivity that strengthens your arguments. I’m curious how much the Sun will cooperate… and how reliable the projection are given that this particular Solar Cycle is now dubbed the “mini-max”. http://earthsky.org/space/solar-maximum-is-back?utm_source=EarthSky+News&utm_campaign=05ed014e81-EarthSky_News&utm_medium=email&utm_term=0_c643945d79-05ed014e81-393677097
More and more I feel not following the trend is so dangerous. However compelling John’s theory is it cant stand against central banker if they know its there last resort. There is definitely serious flaw with this theory its that we cant see until we loose everything.
Rally after rally after rally…..can’t wait to get out my shorts break even. I’d rather wait for a market collapse then go long. Fighting against central banks is almost impossible. I really hope it leads to devastating recession to teach these guys a obvious lesson that more debt does not solve current debt. Fed tapers and market rallies. I still remain bearish and Johns work only gives me more reason to believe so but I think it’s wise to keep short positions very small at the moment.
If stock market cannot be allowed to fall, then why the crash in 2008? As a hindsight, the 2008 collapse was an engineered event that purposely led to the unprecedented wealth transfer (from current/future generations to their pocket) through the QE backdoor. As you said, “debt does not solve current debt”, if we see the endgame, so do TPTB. That is why they are deliberately juicing up the market to inflate their wealth, indirectly stealing from the gullible populace before the inescapable endgame.
I agree that there will be a terrible ending but I can’t seem to get the timing right hence I’m being more cautious. The longer this continues the bigger the fall will be. I’ll be happy to see it when it happens even if I’m not in and don’t make a penny from it.
bear destruction as always…
2008 allows the creation of a even greater bubble and foolish central bank fraud to make riches even richer. bear are small stupid traders who thinks to be smart
The bears in 2008 were extremely smart I would say and same in 2000. The market will crash and it’s inevitable. Just have to catch it right.
et voilà the stupid corrupt bitch… Specifically, based on some “model” the Fed watches to get a “feeling” for valuations, she concluded the equity valuations are not out of historical norms.
Expect 2050-2100 at least… market cap / gnp at 125-130%.
Would you believe a word from the chairman if no one is ever allowed to audit the company? Tapering? USD and stock/bond price actions say otherwise.
Yeah… in the end the only real thing is how much money you make or you lose in the market… anything else is “real”. How can anybody trusts a game in which the only things that matters is Big Boys (that control everything) try to steal money from the rest.
John,
Are you still holding your shorts or planning to let it go.
I think john said he would just hedge long and wait for the bubble to inflate more before selling out the longs again. I doubt he will right now as we haven’t really broken new highs convincingly.
krish
I’m sure John can answer himself.
I would ask John if it was possible to upload images into the replies…
Wow, Fed lowers the GDP forecast, stocks goes up. It has been a consistent story in last few years. I am in cash sitting in sideline and I am too scared to jump in.
But one things comes to my mind. In past, there used to be floods, then Man made dams. Similarly, in past markets used to get influenced by Solar activity. But Man made Feds to counter act. Now I wonder, whether Solar activity can influence markets. Time will tell. I wish we have correction here, but then there is FED.
The best advice I received on investing is to invest on your own advice. Follow someone else footstep is very self-destructive in the long-term.
It’s wearing someone else’s clothes, it’s not to tailor to your taste.
Happy investing, boys..
I’m just waiting for John to throw in the towel. Once he covers his shorts the market might actually drop. Almost all of his “minions” that followed him SHORT are now scared!
Yeah i’m quaking in my boots.
Long NUGT and Au/Ag.
Watch DOW tomorrow and latest by Friday. I think this is it. Another 40 points.
Watch Friday, options expire, SPX could go to 1989, or back to 1870, or both in the same trade day.
http://www.zerohedge.com/news/2014-06-18/beware-fridays-opex-jpmorgan-warns-volatility-too-low-disconnected-fundamentals
Am away this week so there won’t be a new post until next week.
New high on SP500 yesterday, but defensives sectors led, treasuries gold and miners rallied, volume was low, CPCE hit an extreme low, investors intelligence spread printed another week of extreme. Just got to be patient.
NUGT is just taking off on a rocket ride. Don’t be surprised to see this up 10x later this year.
http://stockcharts.com/h-sc/ui?s=NUGT&p=W&b=5&g=0&id=p56043142232
Big rally coming in commodities and AUD.
http://www.marketwatch.com/story/this-stock-trading-pro-sees-bearish-parallels-to-2007-2014-06-18
Gary as bearish as I am med long term I think us bears have to reconcile with the fact that this market is morphing into the mania stage, with a blow off that could last several weeks longer.
It would be a tad ironic Allan if
that post about marked the high.
However we currently lack a decisive
catalyst for a turn just now.
I posted that yesterday appeared
to be the last chance for the bears to
take control at this point, and the reverse
with further gains was the outcome.
The bears will not be toothless wonders
forever, but they look a very sorry bunch
for now.
Too many turned bearish too soon
and will there be many left to profit
on the eventual turn?, most will have
blown up their accounts unfortunately.
Timing as ever is key, anyone can predict
with 100% certainty an eventual new bear
market, but there are not prizes for that –
its when this will happen.
Mate that does not mean I have to turn into a bull.
I am not about to say I have been right, because obviously I have not, however I have also been prepared to accept the bullish case despite mounting bearish indicators. I have though been prepared to go long.
I said weeks ago that the long term DAX chsrts, the DAX being a great leading indicator, looked super bullish and they still do.
I thought we maybe had a turn in the DAX last week, alas up it goes again.
When I say this market is morphing into a mania phase, I can assure you I won’t be going long.
There are much safer places to be.
same old same
You will not be able to pinpoint the top only by being bearish every day losing money for several years. Embrace the trend and make money. The markets can go as high as they want and as low as they want.
Mate who has been bearish for years? I’ve been bearish for 8 months.
Now about those cheap stocks you were talking about the other week?
Lots of consolidation and double bottom patterns in gold stocks. Commodities are catching a bid. Think we are finally in the late commodity outperformance stage. Good luck to all and thanks John.
It might be tempted to see in this way, it would seem crude oil is threatening the solid ~US$110 resistance, however something crucial is missing in this picture, so far, the largest commodity consumer China (see Shanghai Stock Exchange) and copper are not following. If precious metals keep rising from here without the base metals’ support, we may have a different scenario, which is stagflation – I think John has mentioned something like that before.
Allan, there is certainly a case to be made for a mania phase – Larry Fink mentioned this today in particular with regards to Europe due to ECB policies there. But I’m watching gold and wondering if it’s now foreshadowing the CB “loss of control” that Ben Hunt has been postulating. It’s only one day, obviously. In any event, I for one have been quite surprised that the strengthening in gold over the past few weeks has not been met with a decline in equities, rather the opposite.
Gary, I think the move in gold is no small part due to Argentina default. I mentioned here several weeks ago that gold shines not due to inflation as most suspect but due to a loss of confidence.
Argentina is just the beginning of a very long list of defaults to come. Wait until one of the Eurozone countries default. Yesterday’s move in gold was just a hint of what is coming.
I bought NUGT last week at just over $30 If gold where I think it is going by late Sept, then NUGT could be a 10 bagger.
If some wan’t to chase a few pennes going long the SPX, good luck to them, but quite frankly the trade in the months ahead is going to be PM’s
Cheers
Even though I like to idea of all ‘long’ every night, sometimes I prefer a ‘short’ once in a while.
The best kind is to have long/short mix. We, ladies prefer you keep it light on the foreplay because let’s face it, some guys are plain clueless when it comes choosing the right ‘asset’ and thinking it pays to follow the latest/greatest tips from some male friend of his.
So, mix it up a little bit, a bit of ‘long’, a bit of ‘shorts’, that’s the way ladies like it.
Go with the flow, keep your stops tight!
xoxo
I see what you did there…:)
Feel like im tied to the tracks and dow express is coming for me! Chooo Chooo. I think John’s October decline scenario is looking more likely now unfortunately. Or maybe July will be the start when everyone is least expecting it!
Will need to see how the market responds when the punchbowl is taken away, QE is supposed to finish in the last quarter (if it is true).
I think John had been heavily underestimating the central bank potential. There are lot of CB activities which have never happened before so we have to be careful here.
Their is a confluence of ST/Daily measured move/fib resistsance at the 1970-78 area. Break 1954.55 breakout support and that would push liklihood that we topped without fulfilling the targets.
2 Hour SPX Chart
FWIW.
Hi SJ
Caught your other blog update. Hope all is well with the little one & they’re sleeping, unlike mine.
Looking at the Dow movement this week do you still see 17150 as a target given it has pushed through the 16950 intraday at least.
Thanks
Baby is a joy.
The short answer is we need to see a monthly/quarterly breakdown before we know a top is in.
The longer (but not the longest) answer is really in that long term Dow count:
(1) The 17150 is the 138.2 extension in the Dow. That is the Wave B area. The wave B is the megaphone and 1970s fractal that a lot are following. Basically, this is just the 1970s pattern that people have been tracking for a few years. The 17150 is the 1973 top in that fractal. I am not sold on that, but I have it and this is the area (both megaphone and fibonacci) so I am following it largely because of that triangle in the middle of the 2009 wave up.
(2) I think this is actually Wave 5 of the bull wave from 1982. What degree, I am not guessing (could be 5 of 3 from 1942, for example). There are a lot of reasons I suspect that. Included within those reasons are in the chart. The 2000-2009 wave is a fractal of the prior 4th wave (1959-1962). It also measures time wise perfectly with the correction from 1965-1974. Also, if you look at it, you can see that the fractal is very clear with the 1982 bull wave to date looking extrememly similar to the 1942-65 bull wave. Following this fractal, in 1965 the 5th wave of the bull wave ended at approximately 161.8 (extremely close) of the prior wave 3 “fibbed” from the third candle from the high candle high. The time was “roughly” the same time as the prior wave 1 in time. Doing the same here, gives us DOW 17391 right around now (on a quartelry basis).
(3) So, between here and 17400ish I would expect to see the monthly and quarterly breakdown under either the Wave B or the 5th Wave fractals.
(4) The other fractal is that 2000-2009 is also a fractal of 1916-1921. That had a megaphone, the megaphone was busted in 1931, and it ran until 1937. You can see that on the long term chart. None of the CNBC anlaysts that come on ever say why they really think anything. But, this is clearly what those calling for DOW 35000 are looking at. Basically, under this fractal we would have some harsh down candles but no bearish sell, would consolidate, and then would run for a number of years to DOW 35,000ish [I haven’t bothered to figure out the actual target, but that is the neighborhood].
(5) So, basically, we should sell off here for lots of reasons in addition to these three fractals. A part from breakdown and cooroboration that we are actually selling off, there are three broad strokes that I am personally looking at. If we just consolidate and chop the megphone area on a quarterly basis, that would be the bull scenario and after that quarterly chop I would look to be buying a breakout to DOW 35,000. I am not following that but aware of it. As between the Wave B and the 5th, if we hold the June 2012 lows, then it was likely a 5th of some degree. If we break those lows, we are likely going sub 667 in either the Wave B, or more scarily, the 5th was a terminal wave at some crazy run to the bunkers they won’t help you degree.
Anyway, that is the chart for me. *Monthly/Quarterly breakdown at this resistance area that we have reached (DOW 17391ish), see whether it chops the megaphone area on a quarterly basis, if it does not, see if it finds support around the 2012 lows, if it does not, bar the doors. I have the 1970s fractal in red on the chart, just as something I am following to see if it gets negated. Not a prediction necessarily.
Here is the chart:
*And, just as a caveat to the below, what appears to be a completed pattern can turn out not to be a completed pattern when apply counts and fibonacci.
A fascinating example (to me), is the move up into 1987:
If you look at that, it looks like a completed 5 wave impulse in 1987. But all it produced was the 1987 puke and then we rolled on in the bull market.
Sort of interesting is that there was a multitude of prophecy surrounding that August 1987 date: End of the Mayan Time Cycle from AD 1519 (the Nine Hell Cycle), the Hopi end of time Blue Kachina prophecy with the supernova that year, the Harmonic Convergence, and so forth. Anyway, there was not real point to that other than it is interesting that long cycles from ancient people would match up perfectly with a completed wave count.
AUDUSD
Wow SJ that is some detailed analysis!.
just sent John an email on the ~3,5 year cycle. It is found in:
-solar wobble/planetary cycles of Venus-Earth-Jupiter
-solar wind density
-eartquakes
-El Niño
-stock market
Current (stock market-) cycle has an ideal top around August 2014
Jan,
Thanks for your comment. I read lot of smart people suggesting Q4 2015/Q1 2016 as THE top for ongoing Equity bull run. Can I request you to please elaborate further on this 3.5 year cycle?
SJ
Excellent food for thought. Thanks for taking the time to set it out for us.
John
A big thank you for sharing all your research too.
This is one of the best blogs out there & it is much appreciated by me.
“Is a declining market a foregone conclusion as the Fed continues to tighten? No, but for the market to go up from here will require the development of an alternative narrative that supplants the dominant Narrative of Fed Omnipotence. This is what I’m watching for, and movement on this front (or lack thereof) is what I’ll try to alert you to through Epsilon Theory. The leading challenger? Same as it ever was – American exceptionalism and self-sustaining growth. The two variants on this theme? Technology-led growth (mightily damaged over past few months) and Energy-led growth (still going strong). But for now, at least, the Fed narrative still trumps all.”
Looking at the performance of the energy stocks, and the NDX….the alternative narrative is getting bought……along with the backstops of all central bankers…..all are.headwind for the bears.
source::Salient.
http://www.salientpartners.com/epsilontheory/notes/The_Risk_Trilogy.html
S&P signals
http://tradingtweets.wordpress.com/
Cheers John
Regarding Jan’s comment on the 3.5 year cycle
a good case case can be made for the same, as it certainly ‘fits’ the
data more closely than the 48 month (four-year) cycle, which is what
I have always followed/tracked.
either way, I have an upside target for either to the the 2092.45 –
2262.61 region on the SPX, something for bears to be aware of,
as these targets are hit, more often than not.
Having said that, I am short-term bearish from around the 1950’s,
my first try at a bearish position since October, 2013. but, I don’t
like it, and unless it can pan out soon I will have to bail.
Stepping back, the ideal path would be for a decent correction off
the top to play out sometime this Summer. if that decline is seen
before the four-year target is met, market should be deemed a buy.
Jim
Agreed! A correction is most likely but a bear market won’t happen yet as the FED are still easing.
Glimmer of hope for the bears this morning?.
Not quite yet Phil.
Need a bigger catalyst to start a correction. Something which can’t be fixed overnight but will take a few weeks to solve.
Hmmm, bullish flags on GDX,NUGT,GLD,XIV
Bearisg flags UVXY,TVIX?
Gold and especially gold stocks definitely looking the goods here and gotta go with it.
Biotech filled a gap between 2650-2700 in NBI. No more gaps left to fill. Probably the end of an industry similar to solar. The silver/gold equivalent from 2011 with Biotech/S&P now peaks Wed 25th June. Agree with John on the second chance here in Biotech which will lead the markets to roll over (Silver tanked to 26 from its secondary high at 45 in 2011). S&P target is 1550 if it follows Gold on its first leg lower in 2011 and Biotech Index target (NBI) is 1535 (currently 2650). Things which look poised to do well are Yen pairs, long dated Treasury bonds, inverse index ETFs and select industry shorts (Biotech, Financials). Would be careful with commodity exposure though.
I’m not adding any new shorts until I see some reality change, I’m being careful, tomorrow is usually called Turbo Tuesday.