

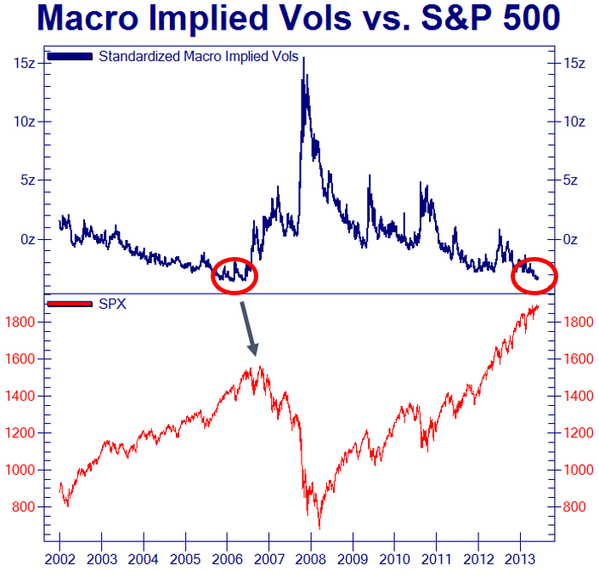
US equities have diverged from fundamentals, earnings and smart money flows for around 2 years now. In all three regards this echoes the couple of years prior to the 2000 peak. The run-up to steep valuations achieved by sharp increase in leverage also matches the run into 2000, and collectively these all indicate a speculative mania which has been historically induced into a solar maximum. Solar cycle 23 maximum = 2000, solar cycle 24 maximum = 2014.
 Source: Ed Yardeni

Source: Fat-Pitch

Source: DShort
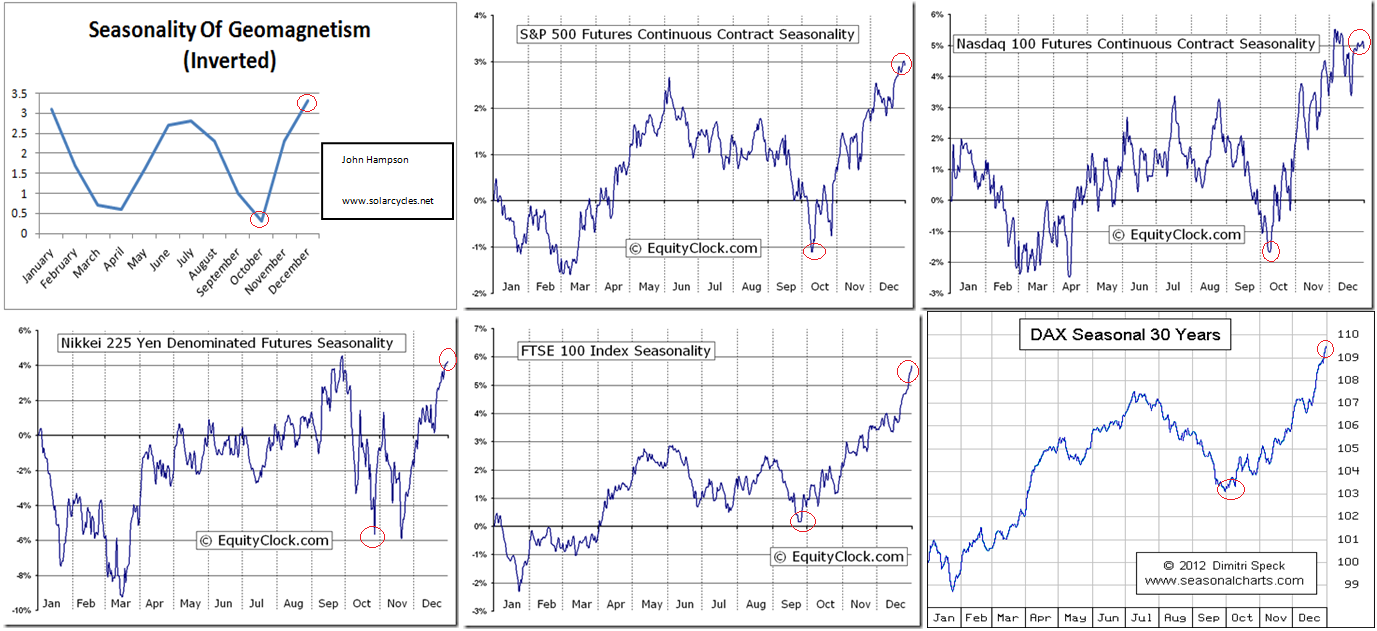
At the turn of the year into 2014, I believe we began the first phase of the topping process. Nikkei peaked, Bitcoin peaked, money switched into defensives in a trend that continues, with treasuries the best performing asset and utilities the best performing sector of 2014 thus far. Such a turn-of-the-year peak fits with a cluster from history and and I believe reflects peak inverted geomagnetism: a seasonal optimism peak.

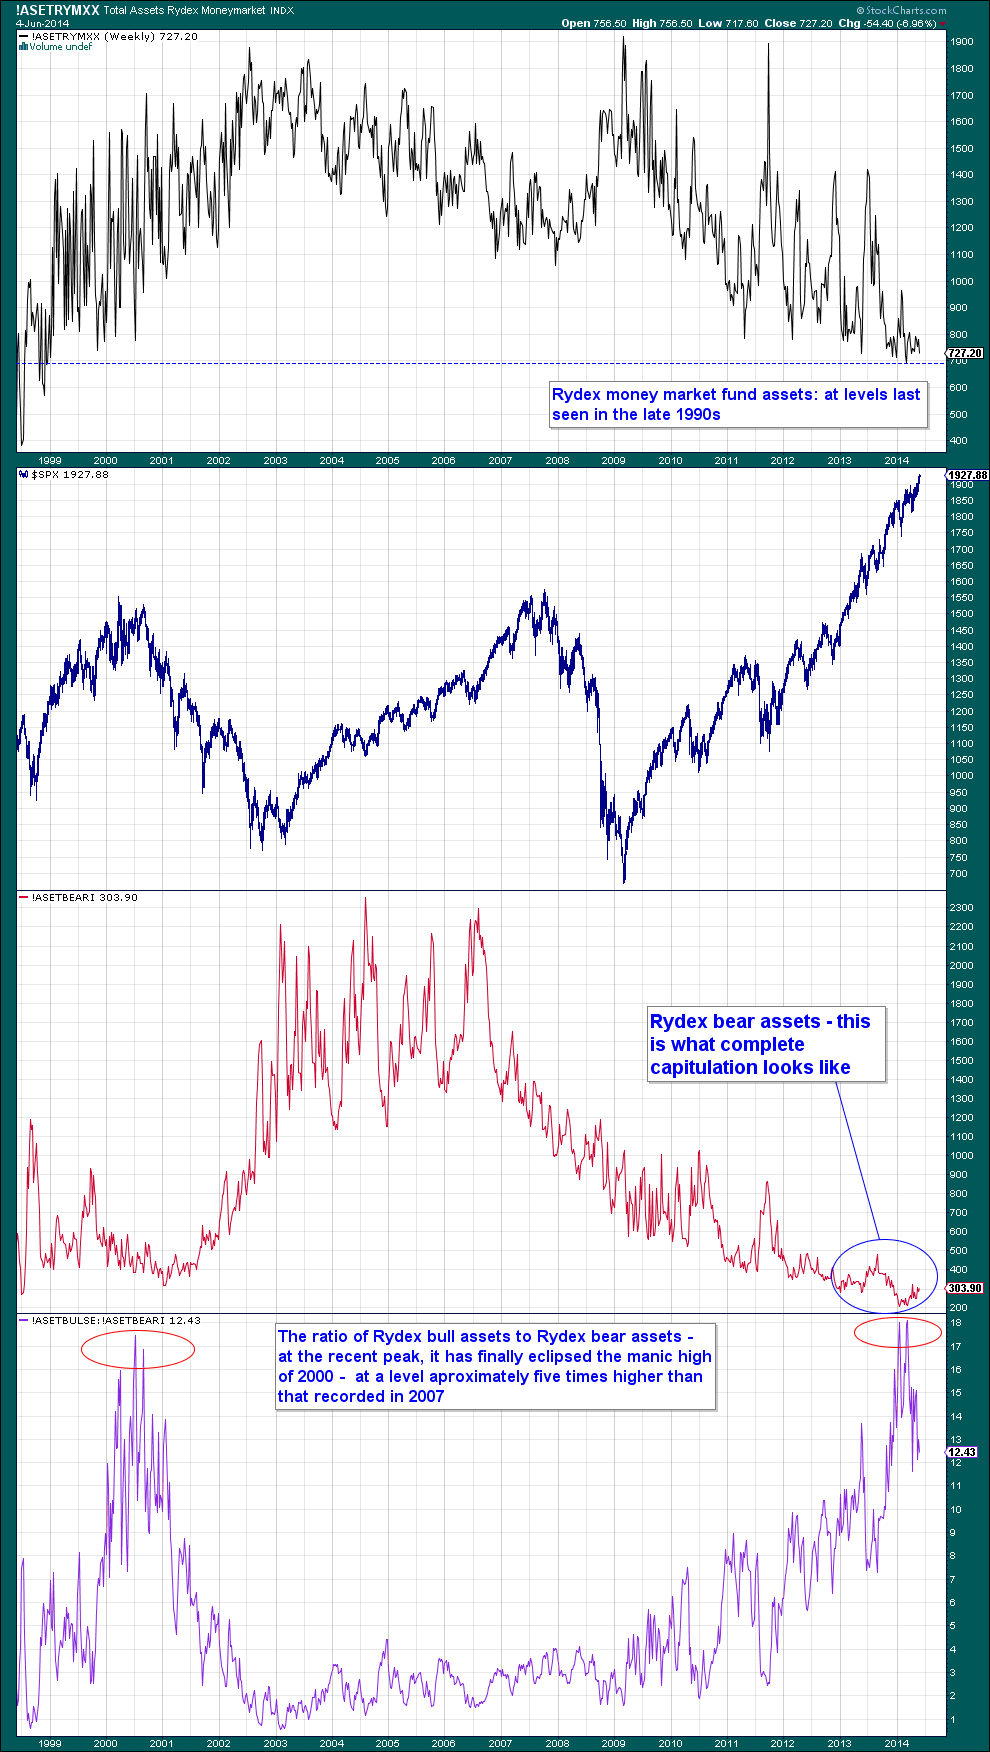
Source: Stockcharts
 Then at the turn of February into March I believe we saw the second phase of the topping process, with margin debt, Russell 2000, Biotech and momentum stocks all peaking along with the solar maximum. Such a neat confluence would echo March 2000 in all regards, and the technical price action has developed similarly since, as shown by the analogs below. If this is valid, then we should expect Biotech and R2K not to exceed their Feb-Mar peaks, and the solar maximum to wane. Like the dot-com stocks of 2000, small caps were bid up to p/es over 100 into Feb/Mar, and so by valuation, leverage, asset allocation ratios and price analog we saw a mirror of 2000; just the super-sized peak and public interest were lacking due to demographics.

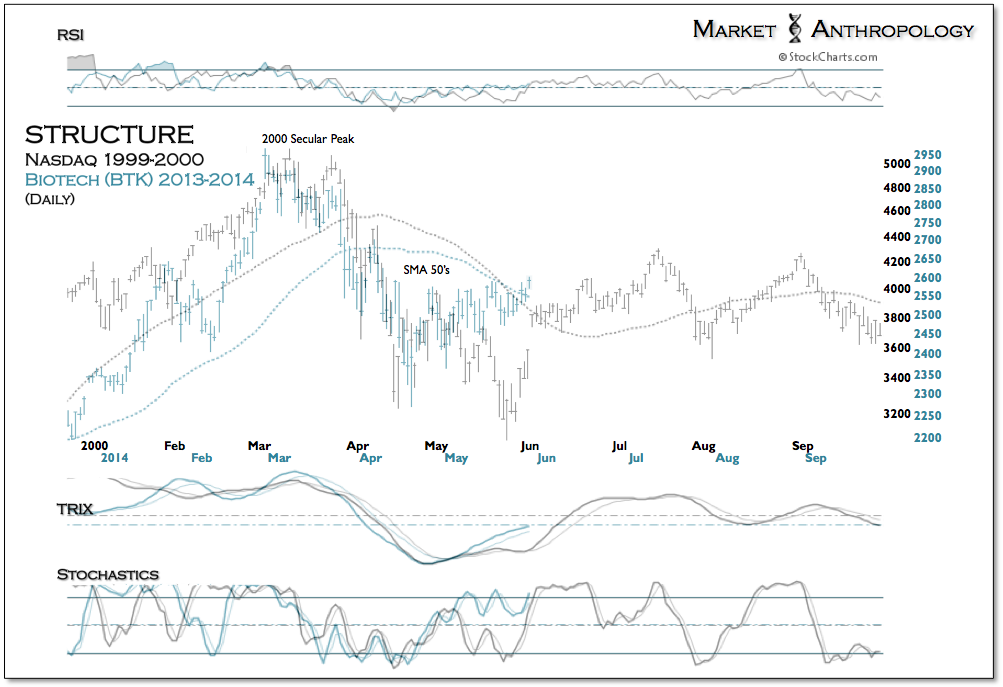
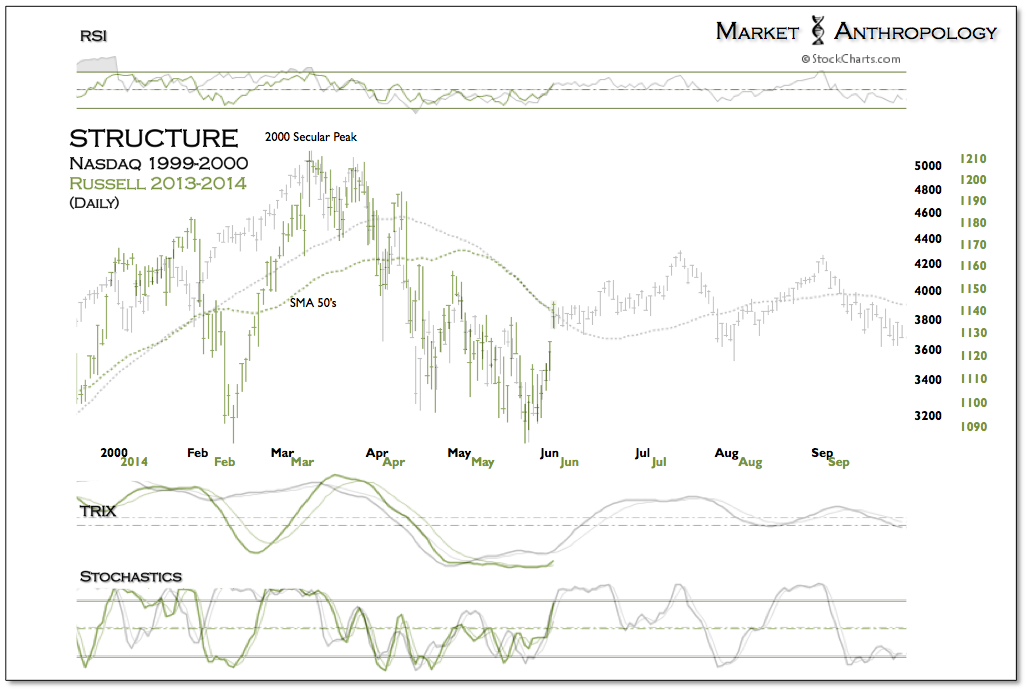
Source: Market Anthropology
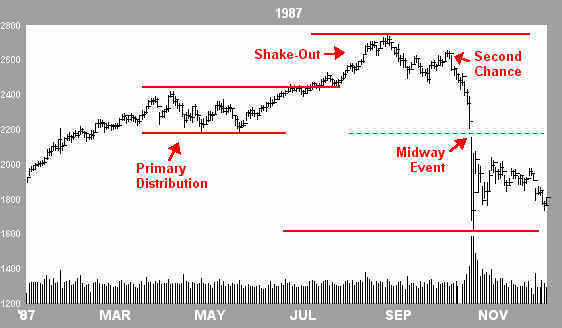
Whilst small caps are off their peaks, large caps have now broken upwards to new highs. To bring us right up to date they are trying to cement a break-out on 62% II bulls, 91% NAAIM equity exposure, some 9 month divergences in breadth, low volume, low protection and low volatility. Skew remains in a persistently elevated range, reflecting the risk of a large downside move due to the extreme lop-sidedness in the markets. 1987 and 1929 (similar backdrops in sentiment, valuation, leverage) both produced breakouts from ranges around May for a final 2-month overshoot higher, so there is historical precedent, but to achieve that here and now we would need to print anomalies in some historically reliable indicators and print some new all-time records in bull assets, sentiment and, likely, leverage.
Source: Acting-Man
Source: Not_Jim_Cramer
Source: Financial-Spread-Betting
I believe that US equities are more likely capped on the upside, with a lack of fuel to propel higher, in an ongoing topping process that began at the start of the year. Looking ahead to this coming week, the overbought and overbullish indicators flagging make it more likely the markets will pull back, perhaps to retest the breakout. This likelihood is enhanced by the downward lunar pressure and geomagnetic storming over this weekend.
A final topping price in the June/July window for large caps would fit with the inverted geomagnetic seasonal model above, and as per that model, could then pave the way to ultimate hard falls in Sept/Oct time. A ceiling on large caps price rises here would then likely be compatible with R2K and Biotech not exceeding their Feb-Mar highs. This in turn would then fit with margin debt pausing its decline but not exceeding its high, as it did in 2000 and 2007, whilst stocks completed their overall topping process.
In short, the above analysis is the best fit as I see it. The cap on equities moving significantly higher is key. The big picture for that is demographic, and supporting that are the levels in sentiment, leverage, volume, and asset ratios. The picture is one of very lop-sided extreme bullishness, with naked unprotected longs on leverage. Markets have historically been unable to keep advancing when indicators have reached these levels and the mature divergences now in place ought also to resolve through downside price action, short of printing historic anomalies. Such a cap on price upside would then likely honour the existing peaks in small caps and margin debt and the turn-of-the-year cross-asset peaks that continue to be compelling in association with the solar cycle peak. Drawing on the historic analogs this may mean range-trading for some weeks more yet before a sharp correction erupts.
New highs in small caps, new highs in leverage, a reversal out of defensive sectors and assets, and/or repairs to volume and breadth would make me abandon that ‘best fit’ and conclude that the sun is not yet done with its speculation incitement. Whilst I can’t rule out a more definitive, crazy parabolic to erupt here, as has been typical at historic solar maxima, I just doubt it because of the lack of demographic support combined with the levels already reached in the likes of margin debt, rydex, valuations, investors intelligence and more. If a sharp terminal up-leg can actually occur from here on continued low volume, without the need for a stream of new buyers, then it would be a game of confidence in which the fear of losing out on stellar gains drives prices higher in a feedback loop despite participants knowing it is manic and unsustainable. If that were to occur then it would make the ultimate correction even bigger, but prior to that it would be a challenge to both bulls and bears: play the danger or suffer the drawdown. What seems clear though from history is that leverage would need to accompany such rises, and it appears that leverage already peaked out. However, there is a possible middle path, in which prices can eek out some more gains in June/July whilst not straying too far and honouring most of the above.
My strategy remains the same: I continue to look and attack on the short side for both short term profits and to add to my sell-and-hold big position. Only if it appears that we are entering some kind of terminal parabolic panic-buying upleg, would I then look to hedge by joining the danger game on the long side to some degree. Meanwhile, the risk to those still playing the long side is that the market is vulnerable to some surprise bad news due to the skewing of bulls, bullishness, leverage, complacency and lack of protection.

Good post John.
Couple of other points to support:
1. VIX contango is steep. While the entire curve has adjusted to lower volatility, the front end is experiencing a much sharper drop (as it would) relative to other parts of the VIX futures term structure.
2. Leverage is high. Margin debt is one indication but we need to compare this with available cash and credit balances. That picture, like margin debt, has tracked the S&P 500 performance decently well over the past decade or so. R-squared sits at 0.51.
3. Equity Mutual Fund flows are weakening. Now, we saw this in 2012 in which had worst months of flows (worse than 08) as measured by EoM positive or negative flows, but that said, bond inflows are starting up again. 2013 was a home run for equity inflows (domestic). This shall be interesting for the remainder of the year.
4. Volume. Apparently most believe there is a story only in high volume and lower prices (capitulation) or just high volume in general (eg. blow off top) but volume is “irrelevant” when prices are moving up and volume is low. I disagree completely. I believe volume always has a story behind it and we don’t have to dive too deep to see what that story is: buyers and very few “natural” sellers. Thus, unhealthy and content.
It is always worrying when money is in the “chasing” stage of performance in a organic growth environment however we are seeing money chase performance (across not just equities, but complex debt) in an manufactured growth market as defined by buybacks, accounting, and policies.
Thanks
thanks john, when u mention demographics, are u saying/meaning there are less people in the investing public now than in say 2000/07
This post explains, but in a nutshell, yes
https://solarcycles.net/2014/01/07/demographics-bear-market-global-recession-and-deflation/
why is this analysis of any relevance?
the market is rigged – the fed will pump as much money into the market as it needs to maintain the price.
what can stop this?
I don’t agree. The 90s bull was considered Fed induced. In the 1940s the Fed suppressed rates and bought its own bonds. This isn’t new. ‘Fed policy trumps all’ is just the mantra for this speculative mania. If QE and ZIRP worked then the economy would be roaring and equities would have rallied on earnings not multiple expansion.
thanks for your reply John
i’m not saying QE or ZIRP does anything for the real economy.
i still don’t understand why you think the fed is not able to set the price in dollars of whatever asset they choose.
all they have to do is keep a permanent bid in the market which can be realised by their ability to create unlimited currency?
John, the Margin Debt chart above shows a “second chance” rise in the finales during 2000 and 2007. If we repeat a similar path, more new high shall come before the market collapse.
Yes, but in 2000 the speculative target, the Nasdaq, didn’t make a new high. It peaked out with margin debt. In 2007, the RUT peaked out with margin debt in June-July. I think it reasonable that RUT and Biotech don’t make new highs but peaked out with margin debt, whilst large caps do and gradually roll over again.
Yes. Good eyes. Your RUT and Biotech expectation is definitely plausible.
Again, I think you are selling near the top of a “n”. Hang it there, you shall be rewarded.
Thanks for sharing the good works, John.
You know the bulls are now immune to the fundamentals as a fund manager recently said: “Admittedly, the world’s economy is not growing at breakneck speed…[snip]…However, as we have explained previously, as an investor, you do not want the economy to expand at torrid pace; and in the current landscape, bad news is good news! “.
It seems to me, with the income inequality being the highest in decades, this ‘hated’ bull market will eventually turn into the most hated bear market of all time, at some point in the future.
Thanks. Normally into a bull market peak we see commodities rally, too much inflation, rates tightened, economy choked. Currently we see weak but steady economy, copper and oil disinterested, low inflation with deflation risks. Debt and demographics mean we are stuck at ZIRP, the tightening is coming from QE being wound down instead. So it’s not the normal bull market end scenario, and bulls argue it’s ‘goldilocks’, expecting we need to first see inflation problems and rate tightening before it can all end. But demographics are unprecedented deflationary and recessionary in the major nations, so I don’t believe it can end like that this time. I believe we have the perfect set up for a real cratering of equities, which will help tip over the weak economy and it will go down together. The ECB easing at this point I expect is too late, that it is too far down the disinflation/weak growth path. But we will see. This time is different in these regards.
Thanks, John. What do you make of the trend in recent years that trade agreements among different countries have been gradually set up by using local currency to settle? This piece of puzzle constantly escapes the mainstream media, and also contradicts the wide expectation of a strengthening dollar. In addition to the risks that you pointed out here, it seems the coming crisis should have something to do with the status of the reserve currency, due to the insurmountable debt problems, I suppose. Maybe it is another reason you are bullish on gold?
I’m no currency expert, but IMO there’s question marks over all the main currencies, and yes that adds to the case for gold.
George, The FED is not omnipotent,
although it may often appear that way over recent years.
Recessions and earnings cycles will still occur,
fundamentals at least to a degree, eventually come knocking.
Individual stocks can still get crushed on a bad earnings miss,
particularly if highly rated, regardless of cheap money and QE.
For a UK example look at the ASOS SP over the last few months,
or for a lower rated retail stock, Mothercare following the unexpected
warning last year .. there are numerous examples.
I am by no means underestimating the power of the FED
in this cycle, however the business cycle itself and recessions have
not been abolished, they have been altered.
Gordon Brown thought he had eliminated boom and bust,
we know how that ended.
phil – please correct me if i’m wrong but my understanding was that the fed was actively buying equities through OMO – open market operations.
imagine if the fed said it was going to buy every second hand car in the country for $10,000 should the owner which to sell and that they would fund this by printing dollars.
I do not see how the price of a second hand car could fall below $10,000 regardless of the condition of the car.
Why would the FED buy equities at this point? It would probably help companies but would have negligible effect on the economy so would be a waste of money. If markets crashed then I can understand them buying equities to calm markets down but it would be a desperate attempt to delay the process.
Hi John
What do you make of the break of the megaphone pattern on Thurs on the log chart of Dow Jones?
Ending diagonal with an overthrow, or breakout.
Duncan what time scale is your megaphone on?
BUBBLES EVERYWHERE!!!!!!!!!!!!
It is clearly a bubble of epic proportions and already losing air. Mao Daqing from Vanke – China’s top developer – says total land value in Beijing has been bid up to such extremes that on paper its worth 61.6pc of America’s GDP. The figure was 63.3pc for Tokyo at the peak of the bubble in 1990.” Yikes !!!!!!!!!!!!!!!!!!!
This is a convincing indicator, too. Unfortunately, it’s not for the bears.
http://www.bloomberg.com/news/2014-06-08/shorts-reload-in-s-p-500-ritual-that-signaled-gain-before.html
John, an alternative evidence to support your prudent forecast.
There are 60 combinations of five elements in a cycle of Chinese astrology. Whenever a monthly combination of water and gold shows up in a mad rally year, the abnormal peak emerges, followed by a disastrous crash. Such a kind of combination has been seen in Sept 1834, Aug 1929, Nov 1972, Oct 1999, and Nov 2007. Aug and Sept 2014 are just such a combination in a mad year. (No such a combination in 2011.) But the venom profit is always appealing two months prior to the catastrophe. This is the case with June and July 2014.
Thank you for your unselfish sharing. I’m truly grateful.
Thanks
Jupiter goes into leo on the 27th July and i have been wondering about some sort of low within 3 months after that date.
Still long, still making money. Bears still forcing their funnymentals.
We have almost all the ingredients to a big fall, I expect it from jun or ago-sep´13, as my two top scenarios. We need-in the Dow Jones a final (parabolic) push, like the 1909-16-19 upwards structure.
@apanalis
http://disciplinedinvesting.blogspot.ca/2014/06/are-investors-really-holding-lot-of-cash.html