

Some more charts:
1. Financials leading down:
 Source: Charlie Bilello
2. Consumer Discretionary leading down:

Source: Charlie Bilello
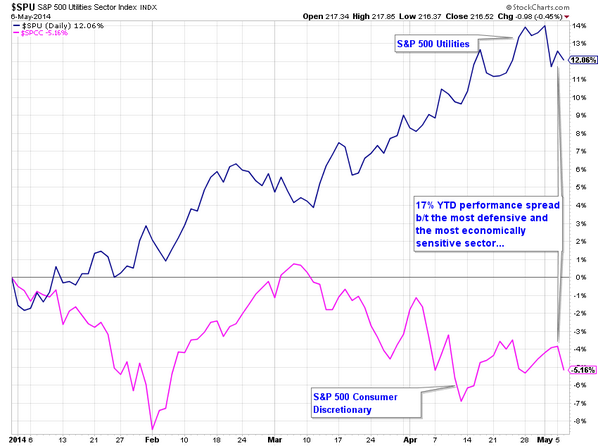
3. Defensives outfperform:
Source: Charlie Bilello
4. Consumer staples performance relative to SP500 echoes previous peaks:
Source: AThrasher
5. Investors Intelligence sentiment leading sharp corrections:
 Source: Stocktwits
6. New highs consistent with 2000 peak:
 Source: J Lyons
7. Q ratio valuation now exceeds 1907 and 1929 peaks:
 Source: DShort
8. Market Cap to GDP valuation also now only superseded by the 2000 mania:
Source: DShort
9. Evidence for a bubble:
 Source: Market Watch
10. Tom DeMark’s indicators predict peaks in the large caps are now at hand. He says the Dow effectively peaked on December 31st and a secondary move up to a level of 16,660 will create a top for the Dow.
At this point, the number of bearish indicators I have amassed is a source of great conviction. It will be a long time before such an opportunity re-appears. Those who suggest that too many bearish indicators is conversely bullish are confusing contrarian investing. Too many bulls, too much euphoria, too much allocation to equities: those are contrarian indicators. They are measures of ‘all-in’ and no-one left to buy.
I have more than 50 bearish indicators, each with a reliable history. Just one on its own should be a reason to be cautious. Many different angles, and together a solid cross-referenced case. To dismiss them all is effectively to argue that this time is different for each indicator, that each one was valid until now but no longer. To proponents of this time it’s different: Fed policy does not trump all, but has been the mantra behind bidding up equities to historic valuations; Low interest rates and low growth reflect recessionary deflationary demographic trends that cannot be stopped; Secular bulls do not erupt from these levels of valuations, leverage and euphoria – in fact, the worst bear markets in history do. Anyone still playing the long side at this point is playing a truly woeful risk-reward set-up.
Don’t trust me, trust the indicators. This is as good as it’s ever going to get for a medium/long term trading set-up. It’s right here, and I’ve done my best to demonstrate what that is so by drawing it all together as objectively as I can. I withhold from putting it more bluntly because I am not an advisory service, so I just share what I am doing, which is deploying my biggest ever trades in shorting the US stock indices (with the biggest in the RUT), trying to negociate a level of exposure which reflects maximum opportunity-taking whilst avoiding risk of wipe-out.
Unprecedented collective demographic downtrends in the major nations suggest this is a short-and-hold opportunity on a par with the Nikkei at the end of 1989, and accordingly I believe it’s RIP Warren Buffet’s buy-and-hold value strategy 1950s-2014, which only works if the long term nominal is up.


Love your charts Jon… Previously you have talked about April/May declines. Now with half that equation behind us when would you estimate that the waterfall declines could begin?
Are you still thinking we now fall off during the rest of May into the summer months? Or do you think we may hold off until September?
Thanks Craig. See below
Addressing some potential concerns:
1. Why can’t stocks move materially higher from here? Leverage, sentiment, allocations to equities and demographics collectively suggest all-in.
2. Why can’t stocks continue to range trade and rotate? Various indicators such as divergences, defensives, momentum all suggest large caps are overdue declines
3. What about no divergence in advance-declines? Fat-Pitch showed stocks above MA (which have now diverged for 6m+) has been a better breadth indicator historically
4. Might the solar maximum extend and maintain speculation? It’s possible but not probable according to an amalgamation of the models of the leading solar scientists, and we can cross reference that with various market indicators which suggest falls are already overdue and that investors are already ‘all-in’.
5. We are out of the inverted seasonal low of March-April, next seasonal low for historic heavy falls is October, and leading indicators show a pick up as of May. This is my worst case scenario: we don’t see the heavy falls which the unwinding leverage will bring about until the Fall.
“1. Why can’t stocks move materially higher from here? Leverage, sentiment, allocations to equities and demographics collectively suggest all-in.”
Volume has been going down for long time => buyers are starting to be all in. But this does not matter as long as there is no selling volume. What will be the catalyst for sellers to step in?
Cogent and balanced as ever. Thanks John
Looks like volatility set a significant low at the beginning of april. The trend seems up. Maybe this was a w2 all month and is a w3 up soon to be expected.
Lunar apogee sets a multi year high on july 28th. This means the distance between earth and moon is at a high, and thus gives an extremely low gravitational pull. Low gravitation gives a high in the market. This would suggest that 2014 is a year that gives a significant high.
The lowest amplitude between apogee and perigee was in april, which is a divergency. So a sideway market is possible untill the end of july, if this analysis is of any value.
Somebody asked me on the previous thread about posting a chart of the “diamond” pattern on the SPX?
I would but for the life of me I can’t get image shack to work on my ipad. My current desktop is in for repair.
Any ideas?
BTW the atter still appears to be good and price actually reversed right on target yesterday. We are are nearing the narrow point of the right side sp a break down should come very very soon if this plays out as I expect.
Diamond reversals are very powerful reversals, but I doubt I need tell anyone here.
Brilliant artcle again John!
Hmmm I hope this works” the annotations are a little crude but the best I can manage ATM until I’m back on deck but you should get the drift.
This chart snapshot was of the SPX at lunch yesterday before the reversal back down. I believe the pattern is good and will fulfil by breaking downside anyday.
yep, it works. thanks!
Just a question on the Diamond pattern, why is it not likely to break up as well as down? Just curious.
Thanks
JOHN, have you thought about doing a bullish article! there must be some good stuff out there.
regards rob
I would suggest to John to do an article on fixed income products such as debts closed-end-funds, and municipal bonds and the 10 year treasury notes. They are doing really well since January 1st 2014.
The bearish slant is the solar cycles theory plain and simple. Solar cycle theory is pointing to being bearish but the bullish opportunities is the shorting opportunity John discusses.
Would like to see what other guys have to say..how do you trade this short side with options.
just buy puts
no that doesnt work. It will decay like crazy if it doesn’t pan out.
may be put spreads or butterflies on TNA. but question is how long will it decay and when it will start.so Kind of time it correctly.
A really good way to short is to short 2x and 3x long etf’s. That puts the cost decay in your favor.
Thanks for the great work John.
There was a lot of talk about the sustained high readings in SKEW at the beginning of 2014. Taking a look back now a few months later those levels have fallen off dramatically. One perspective is that it is a good thing for those of us looking for a top. The high SKEW readings in 2011 and 2012 predicted the initial pullbacks, but equities came back to retest the highs as SKEW readings dropped off dramatically. It was those highs that led to the real move lower. That is arguably happening again, and you can find similar patterns in timing the SKEW peak to equity peak IF it is occurring. Picture below:
Head and shoulders for Nasdaq is glaring. When it breaks I think programs are going to trigger major sell-off. Looks like it could happen any minute/hour/day. What is the consensus on this pattern?
Not many are talking about it, so that’s a positive. $QQQ appears textbook at the moment, but will need confirmation (breakdown) first before I get short. Another encouraging sign for sellers is the price rejection at the 50-day moving avg.
Do you believe the QQQ and 50 day are what most big time traders are using as a cue?
The worst case scenario for the asset allocation crowd who also rebalance: Stocks and bonds both go down together. For a long time. Asset allocation with regular rebalancing is a simple, and usually effective, way to buy low and sell high. Every time you rebalance (get your portfolio back to the asset allocation you’ve decided is best for you), you’re selling the asset that has appreciated and buying the one that has fallen in price. If your portfolio is stocks and bonds (say 50 percent of each), rebalancing works great as long as bonds go up when stock go down, and vice versa. But if we go thru an extended period of time, say years or even decades, where both are falling in price, then rebalancing will not help and the overall portfolio will lose value during this long decline in stocks and bonds. Which begs the question, what is the right strategy for the investor with a long term time horizon and who does not want to attempt to play the short side?
If there is a lot of money at stake why not cash?
I know many will disagree but I think gold will be a big beneficiary this time.
I see a USD/bond/stock sell off. There are a lot of foreign holders of US stocks this time around. Liquidate and repatriate.
One for the bulls among us…
http://www.businessinsider.com/fbn-average-stock-in-bear-market-2014-5
That is bullish to you?
Hi, John. I concur with your top scenario , but if we compare the 2007 and 2011 tops, we see three peaks before the Industrials plunged. And the duration is about 6 months> jul-oct-dec´07 / feb-may-jul´11.
Now the 1st peak saw in the Dow Jones was in the end 2013, dec´13- 2nd march´14 / 3rd end may-beg jun ´14. (2nd scenario)
Or could be the 1st top in the end of may-beg jun´14, 2nd in the end ago´14 beg sep ´14 and next peak, lower one (3r scenario)
The first scenario, is the waterfall from here, a sharp one, but I prefer the 2nd and the 3rd.
Two downwards scenarios:
1- Touch 200Monthly Moving average,-32-35%, roughly -0,5 fib circa 11K Dow, similar to 1980-82 S&P.
2. Similar structure 1909-16-19 upward wedge in the Industrials with a plunge around -45/50%, -0,76 fib.
A do not contemplate a crash like 1929-32.
Not still.
we are in a 17-years-cycle, and must finish (200-2017/8), like in the past finished this structures, in this case with the last rush from 2017/8 to 2023, with and Eiffel Model, ending the +-300 years cycle from 1720 and the final step of the capitalism and the 3rd module since then.
1st 1835, second in 1929 and finally in 2023.
Each economic system> +-300 years with a gigantic depession and every +-90 years an historical depression.
My target from 2017-23 is too high to disclosure, but downwards about 4.000-5000 in 2026.
In more than 150 years will not see the 2023 peak levels
If you want to read my comments on Twitter my name is @apanalis.
Sincerely
About the current top scenario, I presented 3, but could see a mixture, so for me from 15K to 17K+- I opened shorts positions and will open new ones if we reach higer levels in the range I mentioned.
Russell2000 and NDX are likely in a down-trend and in best case could approach to prior top.
@apanalis
Reblogged this on thedarklordblog.
j’s chart
http://stockcharts.com/c-sc/sc?s=$USD&p=M&st=1990-01-01&en=today&id=p64553053815&a=249592906&r=1399683050389
Ken RE “diamond”. Why break lower?…..It’s the nature of the beast.
This pattern is similar to a head and shoulders in that it signals distribution. Unlike a H&S however, it is not nearly as common and in my experience is far more reliable in predicting a change of trend. H&S’s fail regularly, diamonds don’t.
I believe it WILL break down next week and here is why:
The R2k Q’s and the Nasdaq all currently have much larger complex H&S patterns on their daily charts. They have been showing sustained weakness now for weeks.
The reason that the DOW and SPX have thus far failed to break is simply due to rotation into majors. Look at AAPL for instance that makes up over 3% alone.
Looking exclusively at the R2k it has broken it’s 200dma and is now testing it’s 50wma and toying with the neckline of the H&S’s. The other two indices aren’t quite as advanced as the R2k but I believe will get to similar points next week.
As such I think we see the SPX break lower from the “diamond” next week as those other indices fall below crucial support levels thus signalling an exceleration of the sell off and leading to across the board market weakness including the majors.
John has done a superb job in compiling a list of bearish indicators that show categorically that the speculative phase of this market has reached its peak and the charts undeniably support that case.
Hope this helps.
http://stockcharts.com/h-sc/ui?s=$RUT&p=W&b=5&g=0&id=p97040851691
Just to add my two bits here. Diamond patterns in fact can break both to the upside or downside. The key to determining whether a diamond pattern is forming either a consolidation before a continuation of the move or a bonafide reversal of a trend is to count the number of “reversal points” or “bounces” within the diamond pattern. The theory works in this way … if there are an even number of reversal points then it usually implies a resumption of the trend prior to forming the diamond. And if an odd number of reversal points then it implies a reversal of the trend.
According to the daily SPX chart, the low of around 1860 on May 7th is reversal point #10 and the high at nearly 1890 on May 8th is reversal point #11. So far it has bounced off the low at 1867 on May 9th which could “potentially” mark a reversal point #12 but for point #12 to be valid/confirmed it really needs to surge to at least 1885 (above 1890 for upside breakout), otherwise if it breaks down from here then the last confirmed reversal point count ends at #11. That is an odd count and would then signify a reversal of trend and validated with a break out to the downside below 1860.
Technically, the diamond could continue a bit more with maybe a bounce off 1885 followed by a test of 1875, but the gap is starting to contract very tight now and the consolidation pattern is running out of time very quickly. It looks like it will get resolved this coming week.
Thanks everyone
From Ben Hunt of Epsilon Theory (who I highly recommend reading):
Ultimately this all further strengthens the Narrative of Central Bank Omnipotence – the market-controlling common knowledge that market outcomes are the result of central bank policy rather than anything that happens in the real economy.
How can you know if this Narrative starts to waver or shift? If and when gold starts to work. This is what gold means in the modern age .. not a store of value or some sort of protection against geopolitical instability, but an insurance policy against massive central bank error and loss of control. So long as the dominant narrative remains that central banks are large and in charge, so long as – like today – global investors hang on every throwaway line that Draghi utters .. gold doesn’t stand a chance.
You have a point. But then, how do we explain the gold bull run from 2002 to 2011, with the brief crash in 2008? The central banks did not seem to lose any control, especially before the 2008 financial collapse.
On the other hand, there must be a reason for another monetary metal, silver, to have the largest short position among all commodities.
I agree with Martin Armstrong when he says that gold responds principally to a lack of confidence in the “system” rather than directly to inflation or other external events.
Gold has been weak since 2011 due to the fundamental belief that the global economy and debt crisis that plagued the world after 2008 has largely disappeared, ie. the system has been revived.
I also believe that confidence is once again about to be severely tested as stock markets begin a sustained decline and economies falter.
Interesting to note that the USD did in fact put in a very convincing reversal off support on Thursday. I think it was you Gary that posted something in relation to Tom DeMark?
Allan, yes, it is a traditional view that “gold responds principally to a lack of confidence in the system”, but again, it does not explain the bull run before the 2008 financial collapse as before the economy was considered ‘fine and dandy’ before the collapse.
The derivative market just completely overwhelms the physical market at this point, the leverage is said to be as high as 100:1, or even more. Don’t forget the notorious 30%+ silver crash in a week in May 2011 with no exchange intervention, no investigation afterwards, then similar huge crash happened again several months later when silver tried to rally back up. Same unexplainable huge crash happened in April 2013, after Germany wants their gold back from the US. One would imagine crash of such magnitude simply cannot be allowed in today’s stock market as ‘subsidized’ by the Fed. If one says the precious metal market is a free, honest market, and these crashes are just due to demand & supply, completely natural ‘market force’, it is just as naive as saying the world has always been ruled by honest people throughout the history of mankind.
Jazzman, i believe the run up from 2001 to 08 began virtually on cue with the event that shaped that decade. None other than 911. That event and global circumstances that followed that event created uncertainty and shook the confidence of the entire world.
As for the crashes in the metals? As you say there is huge leverage in the metals amd itis this leveragethat can at times laed to dsitortion.
Prior to the huge sell off in April last year gold had tested and bounced of the $1500-20 level on I think three previous occassiona.
It had as such become extremely crucial that that level should hold. I fr one was watching that level and decided that it was going to get tested and that if it broke all hell would break out. And it did. Why? Because as you say. Leverage is extreme and long specs had put their stops just under that support level.
When it got taken out, the cascade began amd was pretty much unstoppable.
Agreed, Allan, the 911 event seemed to be a turning point and, in this view, investors were thought to be buying precious metals as an insurance while the economy was considered ‘recovering’ before the 2008 financial collapse. Much like the current market narrative, the US economy is again said to be ‘recovering’ after the 2008 collapse (think of it as the analogy of 911, another turning point), however this time gold/silver started to fall after the run up till 2011, despite QE announcements.
What you are describing is just the action to deliberately break the apparent support levels in the paper market to trigger further sell-off by the tech funds and alike, all under an economical environment, such as the global currency war, that is arguably even more favorable to precious metals as an insurance.
Here’s some food for thought, “Something Ain’t Right Out There”:
http://investmentresearchdynamics.com/something-aint-right-out-there/
In posting this chart, I am making no negative comment on John’s work…. just showing a short term glitch in the short side based on the work I use.An abcd pattern that completes at line in the 382/447 box is my most archived algo with 4500 examples… 85% of the time price will take out the red arrow. I had no problem shorting at the upper light blue arrow hoping pattern would break; but prices inability to take out the coming together of lines at lower arrow had me move to the sideline until the geometry resolves.
http://stockcharts.com/h-sc/ui?s=$SPX&p=60&yr=0&mn=0&dy=21&id=p48076715470&a=247870051&r=1399809862712&cmd=print
Allan; please keep your thoughts and comments coming on the metals. Refreshing and I always like to read other intelligent opinions.
I agree the bearish case yet none of these indicators provide accurate projected timing. If no major monetary policy or geopolitical shock set in, SPX will still trade higher until 2200+, then will seems a huge bubble that will collapse on its own weight. Any burst right now will require some form of external shock, it’s not here yet.
I trust John, I don’t trust the indicators. The indices are likely to make new highs in 2014, but this website is unlikely to become a wasteland; John will exit shorts in due time, and will make good money this year. Not shorting stocks, but being long commodities.
I’ve been short gold for a while, since early 2013. To be honest, I expected better returns. Unfortunately the downside momentum has waned, and the last momentum was up. Now the price sits in the middle of value, doing nothing, so it’s against my rules to bet on direction. Today I woke up and thought : rules are made to be broken, and went long gold for the first time since 2012.
R2K going down, SnP refusing to follow = bearish non-confirmation.
Silver going down, gold and AUD refusing to follow = bearish non-confirmation.
My initial position in gold is small, I will handle a drop to 800.
I plan to add as the price goes up.
Dollar is likey to go up too, I mean strengthen. For now, it’s in the middle of a range contratction, doing nothing, so we may expect a range extension in the near future.
In terms of gold and DeMark and the tie in to CB omnipotence, this is from last week and what I was watching for on a short-term basis. The price action obviously didn’t occur but I’ll continue to monitor:
Gold (London Spot): prices are getting a lift on the continued Ukraine situation, and are now approaching the again lifting above the downtrend line from October 2012’s third peak near $1800.
We note that there is an already qualified bullish Propulsion Momentum level at $1321.09, should it close above that level this Friday (Gary comment: meaning last Friday). Doing so, and then getting a gap higher open next Monday (that isn’t the high of the day) will confirm the signal for a targeted move to $1373.51.
re SLV.I will take a trade idea from traders I respect and then attempt to trade it based on the tools I use. I contacted Ray Merriman and he gave me permission to quote this from his copyrighted materials..from his apprentice Ken Liao pg88…”Silver tends to make long term bottoms when Mars is retrograde Libra.. additionally explosive moves in SLV occur shortly after Mars turns direct”
Mars is currently retrograde Libra… It goes direct May 20…early May buy algo setup…. but then it was negated by 886 sell algo a few days later…. this past Friday price traded to downside target then reversed and setup second buy algo.What I am doing in SLV is the inverse of what I am doing in SPX based on John’s work … in SPX I am hitting every sell algo and standing aside if buy algo triggers..
chart
http://stockcharts.com/h-sc/ui?s=SLV&p=5&yr=0&mn=0&dy=19&id=p21385759775&a=284058157&r=1399898808365&cmd=print
U.S. Dollar strategy using DeMark signals; one would think that if gold and silver are bottoming, the U.S. Dollar would be weakening, not forming a short-term bottom in unison. We shall see…
US Dollar Index (DXY): The index appears to have found a short-term bottom late last week, when Thursday’s low got very close to touching the Sequential -13’s Risk level of 78.84 (actual low 78.91) and then sharply rallied the rest of the day and on Friday again.
Given the Setup -9 count on Tuesday of last week along with a test of the TDST line going back to last October, there’s much on the chart to think that one could look to play the long side on a minor pullback. Moreover, a down close today that then closes above the recent TDST line at 79.97 tomorrow (and gaps higher on Wednesday) gets a bullish signal. We’d look to bid for a pullback, with a stop-out on a close-only basis under 78.84 (that also gaps down the next session).
Today is a defining moment for this short play. It needs to finish significantly below 16650 and it should from a top as per De Mark
John what’s your line in the sand for this short? At what point would you close out with a loss?
I am only interested in increasing the short, not closing.
What I mean is, I am very happy peppering in shorts when the case is this good, and awaiting payment. It’s down to money management. I am in big, but have allowed for some way higher.
DeMark exhaustion may be in play today – see how it closes:
The Standard & Poor’s 500 Index (SPX) will have peaked if it closes above 1,891 on one or two instances without also falling to 1,884 in intraday trading
The Dow Jones Industrial Average (INDU) will start declining if the following pattern happens: one daily close above 16,581, accompanied by an intraday high exceeding 16,661
Good to hear John. I don’t have capability to add to shorts but am holding them for now. Definitely want to see how the market closes today before thinking about what to do. I guess capitulating now is exactly what will cause the decline as it has so many times before…
Krish, I highly recommend having a stop in place now even if it is an emergency stop, rather than asking John for his line in the sand. Manage your own risk (I think John would agree with this statement).
Alex I don’t have a stop. I rather plan to cut my position down to a much smaller one (taking losses on the way) and rebuild as the new situation becomes clearer. As this is a longer term short i have used stakes smaller than usual.
Also see VIX low today at 11.88 against 52 week low of 11.69..
Last Wednesday morning when markets were selling off, I declared it would bottom within 2 hours at 1860, then rally all day and said we would be at all time highs by Friday or Monday.
Markets did bottom right on time at 1860, rallied all day with only QQQ closing fractionally -0.10 red. All time highs today in Dow and SPX very close.
I still believe John is completely wrong and we are going to 1950 and above, eventually to 2250, so please use stops if you are short. The $RUT and $NDX will see all time highs much faster as they will outperform the large caps.
While I wait for this trading range to break out on the upside, I sold my longs today and will wait to buy back later at support. I won’t be posting any more trades as they were not appreciated by the blog’s audience. I will just post broad thoughts on what I see to try to help those here.
That’s a big gamble. What if the price doesn’t return? Bull with no position, a farmer without land 🙂
Alex…. the key to posting is to make it impersonal and educational in a form that others can copy and then use to find similar examples In the end who slater9 is or what trades he is taking matters little to this group…. what matters is the tools and the showing of repeating setups that slater9 has thousands of archived examples going back years that have worked in all market environments…. If you showed your work in that way I sure it would be welcome…
I second that Slater.
Ive been implementing your 886 setup and VIX pivots with good success. Many thanks 🙂
i think the russell is having a massive squeeze today
The Dow Jones Industrial Average (INDU) will start declining if the following pattern happens: one daily close above 16,581, accompanied by an intraday high exceeding 16,661
I HAVE LOTS OF RESPECT FOR DEMARK but hes been wrong so many times since QE started, its thrown the markets completely
“The Dow Jones Industrial Average (INDU) will start declining if the following pattern happens: one daily close above 16,581, accompanied by an intraday high exceeding 16,661”
Says who? This ‘following pattern’ sounds like a magic formula, a spell. I get brain fry from such statements.
I agree with everything, but as noted in other comments, timing is the key question. RUT down by 10% but SP500 is still making new highs. In the past, this has resolved by RUT making new highs, SP500 rallying followed by steep drops in 6 months. I think the market is until a lot of stress now (as evidenced by John’s collection of charts) so my feeling is that drop will happen sooner. But I give the short term bullish scenario enough credibility to manage my trading accordingly.
Here is an example from the history: In Jan 1998, RUT down 15% from previous high. SP500 keeps making new highs. Both rally until SP500 drops 20% from July 1998 high. Likely now? Perhaps not but be prepared for this rational bubble to go on until 2015.
Slater – in reference to your comment to Alex above, spot on. Speaking for myself, that is exactly what I would welcome.
For those EW practitioners among us one option that has a nice feel to it right now is a large expanded flat pattern that began on Dec. 31st in the SPX and DJIA.
Looking at the move from the 2.5 low (Wave A), there is a 21 trading day 30 calendar day move into the 3.7 high. Assume that is wave a : B. Next b : B takes us into the 4.11 low. Now wave c : B is taking the form of a diagonal and has nice time and price symmetry to a : B. 21 trading days is tomorrow and 30 calendar days was yesterday. c : B is ~ 0.618 the length of a : B.
That would imply a large C wave is coming that will take out the 2.5 low. Fitting very well with DeMark’s work. Which will be very ironic if it comes true as so many people are dismissing him, especially after his ’29 call that the media ran with.
In regards to DeMark, he himself has pointed out that his exhaustion signals as applied to the U.S. market have not performed well over the past couple of years, and he attributes that to (what else?) the Fed’s QE programs. To bolster that claim, Tom points to other markets which trade without CB interference where the signals have, according to him, worked much better.
This has been my hesitation and I’ve considered the proposition that as QE winds down DeMark signals will logically begin working more consistently. Are we at that tipping point? I don’t know, but per John above, we may have our answer very soon.
Commodity indices broke below 50 day ma last week and the $ appeared to break down, period! last week, but possibly reversed. Stock mkt breaking out gapping up today. Same for interest rates. Gold and silver rallying sharply. Looks like a critical juncture.
nothing works, only free money from the FED. There is no limit to this bubble. Once again market break out to new all time highs and there is nothing left to stop it. I knew the market go up just looking at the number of the bears watching what they call round top… no metric has sense in a liquidity driven market. It’s a stupid market where Mafia wants you to buy its sheet, no matter how the price will be high. stop shorting searching maybe a ten percent correction, who knows when it will arrive…surely when nobady calls a top
For what its worth, the CBOE index put/call ratio could close at its lowest level since I have data for (2006). And this is driving the overall CBOE put/call ratio to a level last seen in early April and late December.
Also, XIV may be signaling a top is close
SPY all time high. Dow Transports all time high. Having said that, POTENTIAL bear setup is here if it is a double-top in SPX. May or may not work. If wrong, your stop can be very close, so no big deal if stopped out. Always another trade. No one has the Holy Grail, no one. Please use a stop.
Filled short 1897. 4 point stop.
If we break out, then potential for 1950+ VERY FAST. Look at how long we have been consolidating. Very dangerous situation for bears.
If I were the fed, I would start getting concerned about this stock market. The more it goes up, the greater the correction . . . And people will get seriously hurt.
John, if the market keeps on going up, you might be missing the (cat) or caterpillar syndrome. Despite less sales, they are buying up their stock which will distort markets. This may soon be the catalyst needed to propel the stock market higher, sine the companies are not investing in their futures.
5/12 CLOSE: Dow at all time high. SPX closes at all time high and today’s intraday high is mere pennies away from new highs. Dow Transports at all time highs confirming Dow Theory which confirms bull market. Russell strongest rally in 17 months. I think my short is a mistake and it is entirely possible by tomorrow morning, a big gap up will just overrun my stop and close my short. Markets appear to have completed its multi-month consolidation and resume its bullish uptrend to higher levels.
Ahhhh Alex – You might want to move your cheer leading posts to a Day trading site that supports your Hypothesis – just about everyone here kinda agrees with John Hampson – Just saying what I’m saying – You know what I’m saying?
I have to say that I really appreciate Alex’s postings (when there are less than three in row). It reminds me what this bubble is based on and that it can run on the irrational hope vapor for longer than I can believe.
What are you saying?? 🙂
Monday’s white candle is a slap in the face of bears. VIX reaching panic low and leaving big gap down says it all. Was it just running the stops before strong reversal ? Of course Dow gap up on Tuesday and continuation is possible. But I believe tomorrow will be distribution day and SPX will finish lower this week. Bear bus is empty and bull bus is full now. Gold is in uptrend and USDJPY is preparing for big move. I could not sleep well if I was the bull.
Great work John
“The Fed Is The Great Deceiver” :
http://www.paulcraigroberts.org/2014/05/12/fed-great-deceiver-paul-craig-roberts/