
First a quick note on yesterday’s stock market action. An indecisive day overall again, and on the lowest volume yet. The biotech breakdown remains tentative, but volume has been significantly higher on the down days versus the up days such as yesterday. Volume is also rapidly accelerating into BIS Ultrashort Biotech. For the wider US markets: put-call remains 5 months under 1, Skew remains 5 months historically elevated, Investors Intelligence % bears remains 5 months in the historic low band, and breadth divergences (% stocks above MA) have been running for 5 months too. With every day that passes, the likelihood of the elastic band snapping grows.
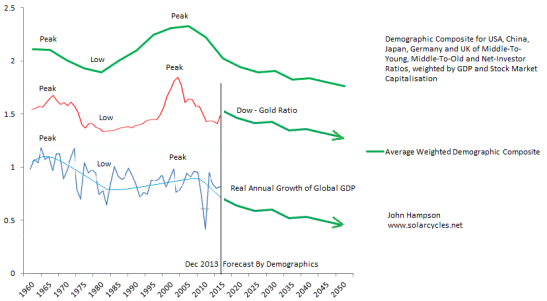
Now to the title of this post. Secular bull markets and superpeaks have always been driven by demographics. Simply, secular = demographic. If there is a swell in the middle-aged group that is the main buyer of equities, particularly if set against declines in the young dependents and in the old age disinvestors groups, then we have the recipe for an increasing flow of money into equities until the demographic trends reverse. Note that this applies to stable, developed, free market countries – a poor country run by a dictator but with a demographic tailwind will not experience the same results.
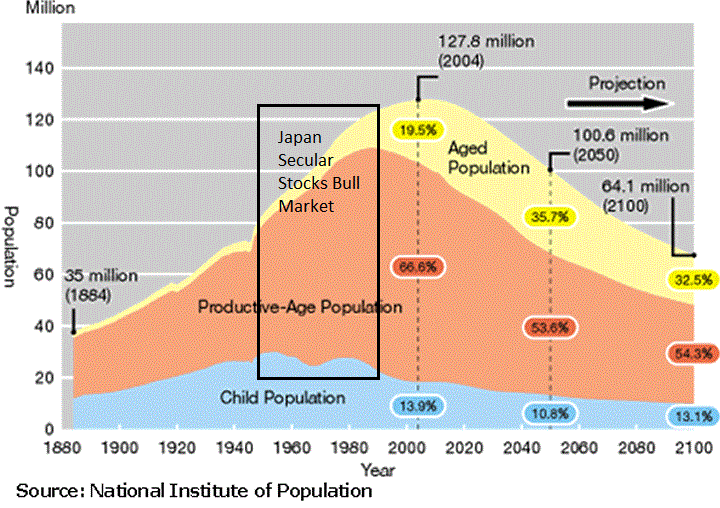
Japan’s secular bull market into 1989/1990 is explained by these two charts. A birth swell around 1950 makes for a swell in equities buyers into 1990, and from around 1950 through to 1990 there was a potent combination of a swelling middle-age group and a declining child dependent group. Thereafter the middle-age demographic trend reversed and the old-age group began to accelerate, making for a secular bear.

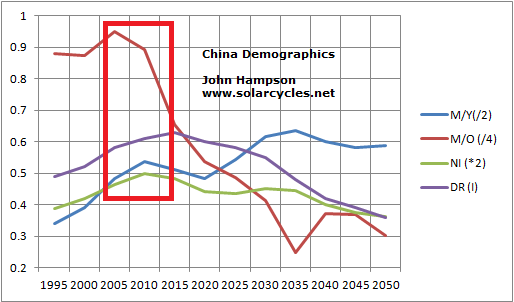
China’s Shanghai Composite superpeak appeared as its 4 demographic measures topped out, and now that stock market is currently threatening to break down even further, as all demographic measures are trending downward:
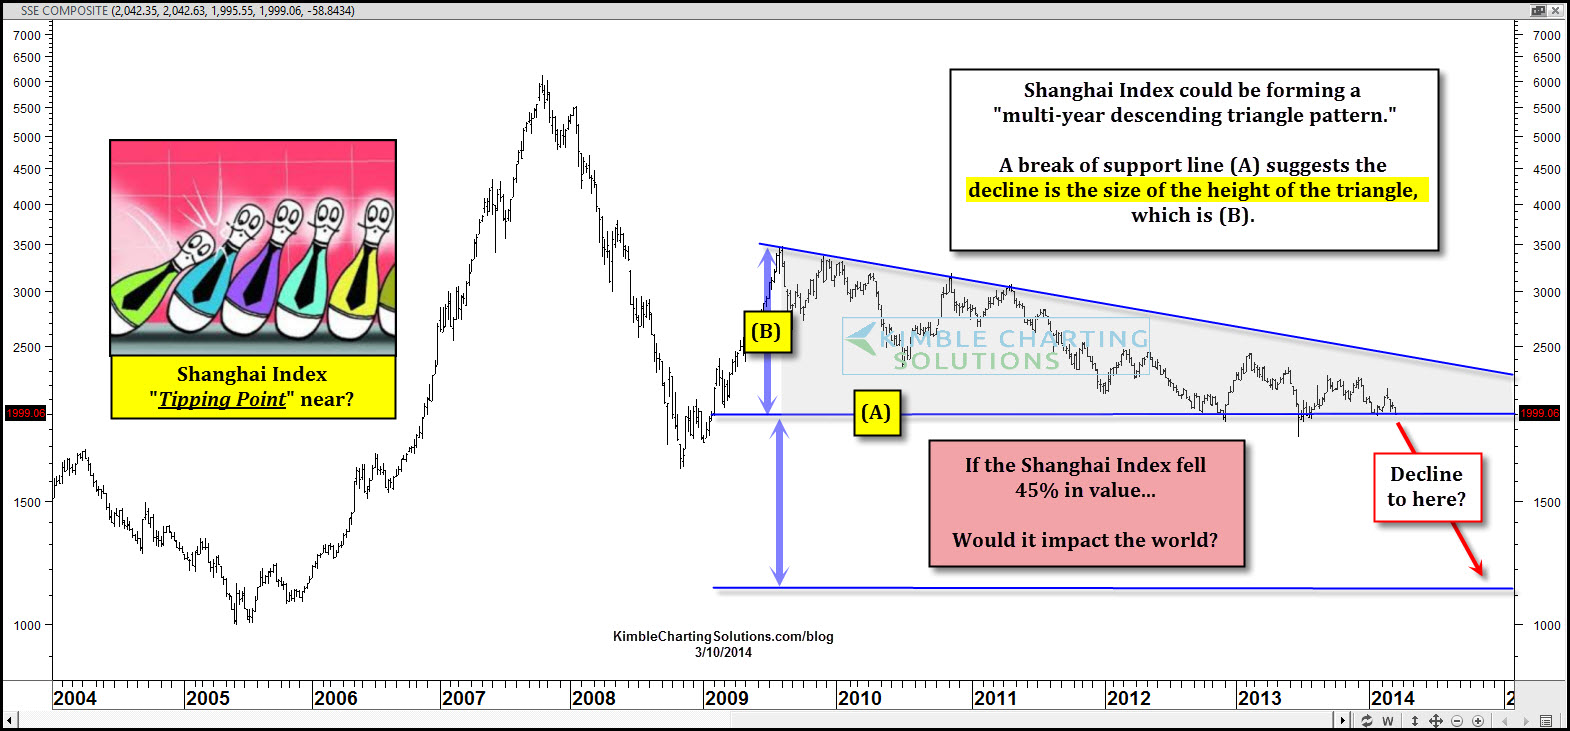
Source: Chris Kimble
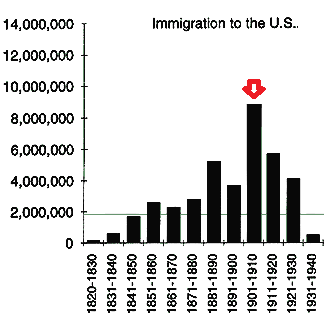
The Dow secular bull and superpeak into 1929 was a result of record immigration of younger adults into the US at the start of the 1900s followed by restriction as of the 1920s, and that swell became the key middle-age group in the 1920s. Plus a decline in births in the 1920s reduced the child dependent ratio as the decade progressed.
Source: Susps.org
The US stock market secular bull of 1980-2000 was the result of demographic measures trending upwards for that window of time, supplemented by similar rising demographic trends in Europe and China (and Japan in the 1980s), which added to the world boom. Thereafter US demographic measures turned down and the current downward pressure is supplemented by similar downtrends in China and Europe, the recipe for a global bust.

 The secular bear market in stocks is still very much in play, and there should be a real lower low in global equities ahead. Gold behaves as the anti-demographic, making a secular peak into 1980 and beginning a secular bull in 2000 that by demographic trends should run on to the next solar maximum of the mid 2020s (solar maxima generate speculative peaks and there is a correlation between sunspot cycles and demographics).
Valuing country stock markets by PE or CAPE has to be considered relative to demographics. An expensive valuation is likely to become more expensive if demographic trends are upward, due to the increasing flows of new buyers. Hence, as the below chart shows, we saw the highest set of global CAPEs into 2000 due to the combined demographic uptrends of USA, Europe and China. Their combined current downtrends have produced a historically low set of overall CAPES.
 Source: Megane Faber
The US stock market is currently the second most expensive in the world by CAPE, and above all other bands in the chart above. Relative to demographics, this is very much overvalued. As per the two charts just above this one, there is a compelling case for US and global equities to enter a new cyclical bear and continue the secular gradual washout following the 2000 superpeak, whilst gold should resume its secular bull as the anti-demographic.

coool. super. THANK you, John! kind regards from Switzerland.
Thanks
John –
Are you expecting waterfall declines still in the near future as long as the Dow high is not broken? If so, what is your timeframe and what are you thinking for declines, 15-20% then back up/retrace and then another larger dip thereafter?
Thanks
Ken I think you’ll find John addresses that here:
https://solarcycles.net/2014/02/25/dow-1929-vs-nikkei-1989-vs-nasdaq-2000-vs-today/
Correct, still expect March-April waterfall declines, then a retrace back up for 4 months or so, then further declines.
Time to buy SPXS for me.
Bulls flexing their muscles and is making progress in repairing the little damage done to $NYAD (cumulative); EMA 5, Keltner Channels.
Bears must be patience. History says a big correction is coming after a 5 year bull run.
I think $NYAD is irrelevant now as it moves in lockstep with $SPX and has lost any predictive value.
http://stockcharts.com/h-sc/ui?s=$NYAD&p=D&yr=1&mn=0&dy=0&id=p66826317898&a=319740888
Friday and today were key in stopping the advance from February lows. Bulls failed and major reversal is in the cards. SPX 1900 will not be reached for now.
I think very sharp move to downside has started. October bottom (1630-1670) is the target. I am not sure if this ends bull market, its is too early to tell.
http://tfaat.blogspot.ca/2014/03/chinas-red-flag.html
Here is my take on China from a few days ago.
Hi John,
I was taught that stock market cycles were secondary to economic cycles which in turn were due to the expansion and contraction of credit and debt,
Have you any thoughts on this,
Cheers.
For me it’s been a gradual process of dismantling common wisdom about what governs the markets and the economy. I believe I am following the evidence but my rules are now some way from mainstream thinking. It will become clear with time whether I am right or wrong, and one key test is the current solar maximum.
http://www.cyclesresearchinstitute.org/cycles-economy/economy-kondratieff-cause.shtml
My calculations put SP at about 1100-1150 by November 15, 2014
Lovely!
Good constructive and persuasive points. Excellent post. A ratio of historical information on gold performance as the anti-demographic to project future may be interesting even if just for kicks.
Thanks all.
Promising action yesterday, but now need to see follow through. For the SP500 it’s important to see it dragged back beneath 1850 to reverse the recent breakout.
Yup, need to see it close back beneath the upper line
http://stockcharts.com/h-sc/ui?s=$SPX&p=D&b=9&g=5&id=p75325139834&a=339451694&listNum=4
DBA-hit smallest target arrow given by tools….. took small portion of trade off
http://stockcharts.com/h-sc/ui?s=DBA&p=W&yr=5&mn=11&dy=0&id=p97538617613&a=335778734&listNum=10
Hi
My own view on the SPX is that if 1825 and more importantly 1737 remain unbroken we may see 1920/1970 odd over the next quarter or so before a meaningful decline happens. I have increased my SPX short exposure yesterday, more as a type of hedge for other equity longs that I am not going to close right now….:)
GLA
J
Gold has finally breached significant overhead resistance at $1350 this morning in convincing fashion, after testing it no fewer than 5 times in as many weeks. Therefore, $1450+ seems very attainable before any correction. Silver, not quite so convincing as yet, but time will tell.
Yes Simon, I asked a couple of weeks ago if gold was capable of testing the breakdown level just above 1500 from April 2013 which has never been back tested.
I guess we could be on the way?
Jon I have been following your blog for a few months now. Really appreciate the information you are supplying and always look forward to reading new posts 🙂
What are you targeting on the Nasdaq, S&P and DOW before the first bounce in two months time?
Then what is your final longer term target?
Looks like it could get volatile today…
Craig, refer to Ken’s question above:
“Ken I think you’ll find John addresses that here”:
https://solarcycles.net/2014/02/25/dow-1929-vs-nikkei-1989-vs-nasdaq-2000-vs-today/
Thanks Allan….Apologizes i must have missed that…
Next few months: https://solarcycles.files.wordpress.com/2014/02/25fe81.png
Next few years: https://solarcycles.files.wordpress.com/2014/01/17ja6.png
John I see a bit of a divergence between your longer term chart Dow 3500 by the 2024 demographic nadir and your dow/gold ratio projection of about 1.5 around 2024. Even at 1:1 ratio gold 3500 in 2024 doesnt look like a solar speculative bubble for the next sc top. Are you conjecturing there will be massive deflation and gold 3500 will buy you a ton more goods? That begs the question, how do you eliminate national debt with massive deflation?
And as always, thanks for sharing such a thought provoking post.
Thanks Joseph. In this post I suggested dow-gold would be sub 0.5 possibly sub 0.1 by that point:
https://solarcycles.net/2014/01/17/timing-major-market-peaks/
It’s a long timeframe to speculate about but I think it is possible that under deflation central banks go crazier yet with attempted inflationary policies, and that once demographics turn back up we then see runaway inflation. We are into the end game with debt, so I don’t see any kind of happy ending, it’s just a question of what kind of ending and when.
John,
Have you read relenless bid theory proposed by reformed broker(Josh Brown). The kind of bid this market has its difficult to imagine how its gong down. Also did you consider that money printing is equivalent to inflation and its being reflected mostly in commodity and all assets, but why does it need to kill the stock market. It can keep adjusting to higher prices. You purchase price diminishes and thats only going to kill the retirees everybody else is fine or they dont have choice.
I decided to follow him on Twitter due to the size of his following, but I am so far unimpressed. At the turn of the year he posted about how he was sorting out someone’s portfolio who was long gold and miners, to make it long equities instead, just at the point when gold and miners took off and equities dropped.
John, I keep reading your comments and find your work quite impressive. I have two questions for you. The current rally in commodities is quite rather explosive when looking at nat. gas, the grains and coffee, just to name a few. WTIC seems however to have stalled for now.It carries a substantial weight in the CRB index. What are your expections as far as commodities are concerned? Any correction in the current ascent? The second question has to do with currencies. After the first decline, which currency would you favour? GBP seems the safest bet besed on its recent behavior and in light of their central bank’s policies. I am currently all in $USD cash and all long positions have been closed, but I have yet to set up short positions. Thanking you in advance for your comments.
Thanks Martine. The commodities rally has been weighted to gold and agri, whilst more growth-oriented commodities such as energy and industrial metals have struggled. I see a weak global economy getting weaker, so have my doubts about the longevity of this commodities rally (precious metals aside).
I’m no currency expert, but I have my concerns about the currencies of the high-debt money-printing countries if a deflationary recession is to kick in. There is no obvious safe currency other than gold.
ugh….at this morning lows, the tools i trade forced me to cover my index shorts and reverse to the long side…. looking forward to be short again……. but unless today’s lows are taken out, I am looking for new highs in indexes….
Algos bought it at 61% retracement of advance from March the 3rd. But I believe that this low was only temporary and will be taken today or tomorrow. We are targeting SPX 1630-1670 and it will be fast. Next week’s FED meeting is so close, it can be significant.
nice job slater…bounce of the morning lows was ridiculous
I hope no other reader is either still long or going long at this point.
Hi John,
I sold all ASX stocks 2 months ago. Buying physical Gold. Keeping my powder dry for any just in cases.
I like to teach.Here was the setup at the morning lows that I have traded hundreds of times….YOU did not have to reverse to the long ; but a knowledge of this setup would have kept traders looking to get short from selling into the hole… ALL my short term index charts had price at line targets at the low… ALL… The QQQ is shown as example…
http://stockcharts.com/h-sc/ui?s=QQQ&p=1&yr=0&mn=0&dy=19&id=p43259639277&a=338450757&listNum=9
The key to understanding the reversal is knowing the INTENT of the volatility traders…NOTE everything on the chart is public knowledge AND on the chart before the trading day begins. IF you have VXX at fib retrace at R3 at line from set AT THE SAME TIME all THE INDEX ETF’S are hitting down side targets, then you have the setup where the volatilty traders will trigger a reversal.
chartof VXX
http://stockcharts.com/h-sc/ui?s=VXX&p=1&yr=0&mn=0&dy=12&id=p55007229021&a=337621083&listNum=9
RSI of $Dax:$Bel is the lowest of the last 3 years. This is a clear buy signal, at least as soon as the RSI will turn up. Greedometer and all the other stubborn bears who stick to their scenarios instead of putting weight on indicators are exposing themselves to ridicule
Not so on the intermediate trends of Germany/France/UK stock indices, as the momentum appears to be weakening on all Weekly Charts of the said indices.
I guess the market is never going down again (at least meaningfully)…
John appreciate this website and all your knowledge…………and finding Slater was a bonus……. love your charting skills and appreciate any teaching on them………….
Yesterday and overnight we saw a partial reversal in US stock indices, but a 5th day of drops in a row for FTSE, DAX, Hang Seng, Nikkei and oil, and adding to that risk-off theme was a breakout in gold and an up day for treasuries. Little has changed on the US equities indicators front, an elastic band ready to snap. Geomagnetic storm overnight. Let’s see how today develops.
Hey John, I am getting the sense also that the US markets are mapping out a top here. Major tops are a process not a single event 😉
Cheers
Greetings, John, many thanks for sharing your insights.
I would like to add that, in addition to German/France/UK that I mentioned above, one can easily spot bearish divergence on the weekly and monthly charts of Hang Seng and Nikkei, thus the intermediate and long term trends appear to be weakening in most world indices. The last piece of puzzle is now the US stock market.
You can print money but you can’t print food.
Not quite yet, but it’s not that far away 🙂
If the Naz makes a lower low today and at this stage there is every reason to suspect it may, then that makes two outside reversal days in three days. That says to me that this market is KAPUT!
http://stockcharts.com/h-sc/ui?s=$COMPQ&p=D&b=5&g=0&id=p20435252450
I’ll reiterate, a lower low and close below yesterdays low 😉
In China: You have my permission to default!!… when Chinese Premier Li Keqiang said that defaults may be unavoidable in some cases
China is definitely tending down…EU is waiting for the 1st shot…..and the US markets are over-valued.
The odd favors the bears (if they can stay solvent).. LOL.
Those who know my work from elsewhere know this is my favorite trade…. the 886 algo…. I hate trading long so when I saw the algo I reversed my position For those who do not know the algo there is a file out there with many examples… google.. slatepile.
http://stockcharts.com/h-sc/ui?s=QQQ&p=1&yr=0&mn=0&dy=4&id=p79064210598&a=337861698&listNum=9
Slater, any suggestions on where to learn more about the tools and methods you are using to trade? thanks, john
Everything I do is based on publicly available tools. I had the good fortune to see the work of some great trading minds at the height of their teaching powers when they still showed their work at open forums,Now they are all private or dead and gone.From their work I took parts and built my own way,Interestingly my way was seen as heretical to those I took parts from, the one exception being the trade Joed who always welcomed new insight. more later
Away from the indexes, bonds at critical juncture….
Hi John, my assumptions seem to work, and I am getting confirmed sell-signals in Norway and other markets. Unless we get some kind of major bullish game-changer, we should trend down towards June. But if we dont crash, we could se some kind of big double top in the fall.
Lately I have been studying demographics in Norway. I find a ~20 year cycle in the birth numbers, which seem to be a half-harmonic of the ~43 year cycle in DOW.
One significant spike in births was around year 1947. That generation is now around 67 years old, which is the default pension age in Norway.
The birth-spike around 1947 came after a long period of low birth numbers 1930-1940.
The implication is that the last decade we got rather few new people going into pension (the 1930-1940 generation). But now we are in a big wave of new pensions. The number of people going into work age 20+ years is slowly decreasing.
For markets and pension funds this should mean that the difference between inflow and outflow of funds is changing now, getting much less positive. Could have liquidity effects on markets for the next ~10 years or so, which fits with our cycle-work.
Also it means we soon get a wave of elders needing more health care, which we have known for a while is coming… and now it is starting soon… assuming that the international demographics is similar to Norway 🙂
this is how it looks for Norway in 2014 compared with 2000. Btw there has been a record immigration of 30-40 year olds, probably due to favorable economics in Norway (mostly from Poland and Litauen). Think this will slow down from here…

Given the strength in the metals; I was wondering if the concept of angular momentum (and it’s accompanying effect on the SC) needs to be revisited; along w/the chart; under Fig 1 and 2. ( I forgot which poster first brought this concept to our attention. but I think it’s an important topic.)
http://landscheidt.wordpress.com/2008/11/06/are-neptune-and-uranus-the-major-players-in-solar-grand-minima/
Also, this must be mere coincidence; but was Mr Landscheidt the best long term forecaster of the gold bull market: ever!? Note the dates: 2002 and 2011.
Probably just another casual correlation.
http://bourabai.kz/landscheidt/creative.htm
re angular momentum
Allthough I dont exactly know how it works, these planetary cycles do work for me relative to the solar cycle.
Very important is the half synodic Jupiter-Saturn cycle of ~10 years, but it often gets somewhat disturbed by Uranus-Neptun…
And around the major disturbances we have potential for a Maunder minimum.
Right now I dont see a high potential setup for a Maunder minimum, so we should just see a regular Gleissberg low like the Dalton and the other one around 1900.
Eclectic, thanks for those links. The first one shows they predicted Solar Cycle 24 very well so far. The line up of SSB Distance as 179 y Cycles 995-2985 AD was very interesting. Doesn’t it show we are in for a very cold period? The “fact” that climate change meaning man made global warming is now established science (oxymoron) makes me worry that we might get a mini-ice age. What’s the word on this? The article did not talk about the relationship with minima and cold.
Apologies if you’re already familiar with these, but Ivanka Charvatova’s plots of the sun’s movement about the solar system barycentre (Fig 12) illustrate its relationship with planetary angular momentum and solar activity/global temperatures. http://gsjournal.net/Science-Journals/Research%20Papers-Astrophysics/Download/4334
Animosity between many self-professed “established” scientists and those they regard as “cyclomaniacs” shows no sign of abating… http://tallbloke.wordpress.com/2014/03/12/death-blow-to-barycentrism-on-the-alleged-coherence-between-the-global-temperature-and-the-suns-movement/
@Eclectic – I originally brought up angular momentum. I recommend a book called Out Of Sight – I picked up a used copy recently. You get into Quantum Mechanics. I plan to do a write up and post it online later this year. Angular momentum impacts photon spin. The angular momentum is driven by gravitation pull of the planets. As the photons are blasted out from the Sun as electromagnetic radiation (photons are massless particle equivalent) they reach the Earth’s magnetic belt and interact with the magnetic field via excitement of electrons absorbing them as kinetic energy shifting the shells and orbit patterns of electrons. Obviously much of this reaches the Earth’s surface as light. We have receptors in the human eye which potentially react to small changes in the magnetic field (more research required) and we also breathe in photons as well as get skin burned by them (UVA/UVB). The fact that angular momentum changes and has been linked to triggering sunspots on our Sun, I plan to document a research opportunity and theories as to how it impacts every behavior John has documented in his guide and on this site. The moon is pivotal here and it can alter electron excitement and magnetism via its tidal forces and angular momentum. Lots more to research but I have a lot of pieces that fit together like Africa and South America.
John,
Haven’t heard from you about yesterday price action. I am used to your daily commentary..no vacation for you..:)
Thanks for all your effort. What do you think about geo-political risk. Do you think this downturn is just because of that or we have a bigger problem at hand.
same here 🙂
john- hope you are doing well
I think he made good money off his shorts yesterday, so he decided to take a day off 😉
Old man is usually right, but is he wrong this time?
http://finance.yahoo.com/news/buffett-id-surprised-stock-prices-120642587.html
Jan:
Thank you for the education. (I spent some time reading your definitions.) You have obviously spent your share of time studying these concepts. Do you have any explanation for reconciling the AM chart with the following major tops in gold;?
1861: Top also occurred around the peak of SC12.
1980: Top also occurred a little early; but on the downward half of SC#?
When gold finally bottomed in 1999/2001; it took some time to ‘catch up’ w/the upward phase of that SC; BUT was skyrocketing during the downward half of the SC until it again ‘caught up’ with the downward half of the current SC 24 after peaking in 2011.
So, would you have any position on what we could next expect? Following this pattern; one might conclude that we will again play ‘catch up’ with price moving to the upside till 2020? Although downside risk looks minimal; I know none of this is simple; and any explanation of these patterns are speculative. Again, many thanks for the lessons.
Hi eclectic – I have only studied the sunspot cycle, and stock market. I have identyfied which planetary cycles that regulate the SC, and what are the dominant cycles and/or oscillations in DOW, and found the corresponding cycles in solar activity (may it be the solar flux, geomagnetism or parameters in the solar wind).
For the markets we basically have:
-43 year cycle low in the 2020s
-solar maximum bear market ahead, next one mid 2020s
-3,5 year cycle topping around this fall 2014. Market may top earlier or later
-~6 month cycle turns down to June, next one topping in the fall. Markets may rally further into spring, but right now they signal they have topped out for this cycle, going down to June
Cheers 🙂
JAn
http://www.marketwatch.com/story/in-the-know-insiders-are-dumping-stocks-2014-03-14?dist=countdown
John,
Just wondering is it setting up for your crash call for this monday. considering selling this week and thoughts about it over weekend
Let us know your thoughts
Bill
Bill and Kasi I can’t speak completely for John but if you go back and check his previous articles I am certain you will find that he is not changing his view that we are in the midst of a waterfall decline that will see declines into April in the order of 35% before we a get any sizeable correction.
I doubt after being short and expecting things to accelerate to the downside that John would reverse his short position.. I could be wrong but I am pretty sure I have him pegged.
I suggest you go back and read his work thoroughly.
Cheers
Thanks Allan. My post regarding John’s exit was a small joke. I hope i did not mislead anyone. Sorry for that. Yes, over the past few weeks i have been reading his posts religiously, so i also doubt he will cash out on small declines.
Hi John, an update to my 4/6month cycle projection chart for Norway

Norway celebrated an ATH before Xmas, but this is the equal weighted index, not adjusted for dividend. It shows a wedge, false breakout with test of the 2011-high, and a decisive break down from wedge and 200MA

Hi all, was occupied all day yesterday. Will do an update and replies over the weekend.
The following may be redundant; but I thought I’d post it anyway as it seems apropos to John’s scenario.
=================================================
Lance Roberts (STA Wealth Management): Here are 10 typical warning signs of stock market exuberance: (1) Expected strong (OR acceleration of) GDP and EPS (40% of 2013’s EPS increase occurred in the 4th quarter). (2) Large number of IPOs of unprofitable AND speculative companies. (3) Parabolic move up in stock prices of hot industries (not just individual stocks) (4). High valuations (many metrics are at near-record highs, a few at record highs). (5) Fantastic high valuation of some large mergers (e.g., Facebook & WhatsApp). (6) High NYSE margin debt Margin debt/gdp (March 2000: 2.7%, July 2007: 2.6%, Jan 2014: 2.6%). Margin debt/market cap (March 2000: 1.8%, July 2007: 2.3%, Jan 2014: 2.0%). (7) Household direct holdings of equities as % of total financial assets at 24%, second-highest level (data back to 1953, highest was 1998-2000). (8) Highly bullish sentiment (down slightly from year-end peaks; still high or near record high, depending on the source). (9) Unusually high ratio of selling to buying by corporate senior managers (the buy/sell ratio of senior corporate officers is now at the record post-1990 lows seen in Summer 2007 and Spring 2011). (10) Stock prices rise following speculative press releases (e.g., Tesla will dominate battery business after they get a partner who knows how to build batteries, and they build a big factory. This also assumes that NO ONE else will enter into that business such as GM, Ford or GE). All are true today, and it is the third time in the last 15 years these factors have occurred simultaneously which is the most remarkable aspect of the situation
End
Jan, thank you again for your response; and for sharing your research and insights. Your focus then is obviously more on the SC and how if affects the stock markets; while my focus is more on the precious metals.
I would be interested to hear any thoughts or comments from others on the idea of AM; and the info posted?
if you know of a data-source with historical data for gold, say 100 years of monthly price, or more… I could quickly make a cycle analysis, and check some correlations
JAn 🙂
http://stawealth.com/daily-x-change/1977-10-warnings-signs-of-stock-market-exuberance.html
Great post
So John, your saying Dow 260,000 by 2032 (March 2012 post) and Dow 3500 in 2016
Wow do you still see this scenario! If you think the current biotech chart is ridiculously parabolic (steep). Then just what would the Dow chart look like, pretty much vertical
John’s numbers are more extreme than mine, but I more or less agree with his general thesis here. While I don’t expect the Dow to hit 3,500 during this crash (I expect something more along the lines of 5,500 as a bottom), I expect hyperinflation to occur fairly shortly after the bottom is reached, which would send the Dow to the moon. But the performance of the Zimbabwe stock market in 2008 (up roughly 40,000%) demonstrates how much actual value those nominal numbers will represent at the time.That’s why you’d damn well better own gold, and not GLD either.
lol…hyperinflation. Here comes the gold bugs. The fed has printed 4 trillion and we still have deflation…lol. Zimbabwe was a political event. If the US is taken over by some extremists or something, then maybe. I would worry about your life more than gold…lol. Maybe gold will finally rally if there is mad max style life or something. Until then, gold 1900 was nasdaq 5000. It was just a bubble. Maybe it will rally, like nasdaq did, but not due to hyperinflation. The dollar is a pig, but it’s the prettiest pig in the currency trough right now.
@Boner — Inflation is properly defined as an increase in the money supply, so your contention that we have deflation exposes you as either misinformed or willfully attempting to mislead. Rising prices (which we have in everything from food to fuel to cars) are merely the result of inflation (this is known as cost-push inflation), not inflation itself.
Gold will eclipse it previous nominal high of $1936 by July 1, 2015, on its way to at least $3,500 sometime in 2016. There are only two possible outcomes that can result from the current orgy of unbacked money printing the world’s central banks are engaged in: Some country, or group of countries, will have to back its currency with some tangible good, or every paper currency will reach, as Voltaire warned in 1729, its intrinsic value — zero.
Jan, if I sent you specific dates; (some from the following chart) would that help? And would this long term chart help? I know the chart is short on price details but I have lived by and with this chart.
http://time-price-research-astrofin.blogspot.com/
(Scroll about 5/8th the way down to the chart titled: “The Gold Price.”) Maybe
I could get John to send it to you via e-mail; but I don’t wish to impose. I don’t think I can post it to this site.
hi eclectic, I just had a look at a historical Gold chart versus DOW (back to 1790), and focused on my ~43 year cycle. The most common pattern is that Gold makes a top around the middle of the 43year cycle low interval, which means around year 2015. Then declines to the end of the interval, around year 2025.
We allready have had a gold spike previous years, and it may be all we get… but could still make a 2015 or 2016 top. But thereafter the normal pattern would be bearish…
I am looking for some kind of deflation, and that should not be bullish for gold. But as the public realises we´re going into deflation, I could imagine gold would be attractive (find a safe thing that can be buried in the garden), specially as it is oversold now.
So all this is speculation and not analysis on numers and correlations… but I expect the bullmarket top for DOW is 2014, and we´re headed for deflation. And Gold could make another spike, where people need to hide their money (those who not allready have)
JAn 🙂
hmm, seems my chart overlays were not quite good enough, so my conclusions were not so right. Not sure I see any common pattern, other than there normally is some kind of major rally in Gold while DOW is making its 43year cycle low. The rally in Gold can be around the middle of the bearish-DOW period, sometimes in the late phase…
I guess the logic is that in defaltion everything looses value, but stock can go bancrupt. Banks can fail, and deposits vanish… or be confiscated. Paper/digital money can be revalued, or changed into new less value currencies, burn, disappear, be stolen…
Most commodities take much space and must be stored.
Gold takes little space, and dont disappear if one hides it well. it will loose value, but not everything… and it may perform better than the average…
My work has been showing a high for gold of more than $10,000 an ounce by the end of 2020.
Heck. Do you have a high target for silver also, DJ? Appreciate all your very interesting comments.,
@Simon — Silver is the most undervalued commodity in the world at the present moment in time. Silver will, as always, move in fits and starts and exhibit volatility that will take your breath away, but its price will eventually move upward with a ferocity that will absolutely stun those who don’t understand how the price suppression mechanism works. Between here and the denouement, it will move strongly, at least mirroring gold’s percentage increase.
I told my dad in 2008 (when we were buying it at less than $10/ounce) that silver would someday reach $1,000 an ounce, and I see nothing in the fundamentals or in my fractal work to make me change that price projection. In fairness, that price level could well be a short-term spike. Whereas gold is much more likely to reenter the monetary system at its peak price (so selling it will be unnecessary), silver is likely to overshoot the price at which it will settle as part of a bimetallic standard by a significant margin. When the gold/silver ratio breaks below 15, I’ll most likely sell silver and buy gold. Time will tell, however. A g/s ratio under 10 (or even lower), at least for a brief period, is highly probable.
And I’m glad you find my comments valuable. I hope I can add some value to the discussion. I have a vested interest in being correct with my calls, since I retired young and haven’t had a so-called “real” job in quite a few years. Trading the markets is all I do, in terms of making money on which to live. Some of my better calls were telling everyone to sell all their common stocks the day the Dow first hit 14,000 in 2007, going heavily short (leveraged short) the financial stocks later that year, and then taking profits and moving heavily into precious metals and precious metals stocks near the end of 2008. I’ve made plenty of mistakes along the way, but I generally have a good feel for these things. I also study relentlessly and improve daily.
By the way, I’m here because I felt another big time short opportunity was approaching and I was curious to see whether others corroborated that opinion. John was someone who did, and his work helped me increase the confidence level of my own. I definitely do appreciate that.
One final note: While I wrote that I expect an eventual gold price of more than $10,000 an ounce, $15,000 or $20,000 an ounce wouldn’t surprise me in the least. The current financial and economic system will be replaced during this cycle, with something far more equitable for humanity. That is not a guess, it’s an inevitability.
D.J. ,
How exactly do you envision gold reentering the monetary system at peak price? To get it to peak price would require the max number of mkt participants to be sucked in and we know the crowd is never right.
Jan, based on your first impressions; looks like the pog is living on borrowed time?
Notice on the following chart; they have SC24 ending at the end of last year.
Recall that John compared SC24 w/SC14 and 16. Just looking at the data; I found it more than interesting that during SC14 and SC16 the actual extreme LOW in gold was achieved 18 months and 17 months AFTER the SC peak. For SC10 the story was a bit different as prices and the SC peak were moving up together. (like now) The monthly peak for SC10 was in February, 1860 but prices were moving up prior to that time; roughly circa 1857-1859 or thereabouts. Meanwhile, the peak gold price occurred on 12/31/1861 during SC10.
I think the issue will be resolved when the official peak will be marked for SC24.
And probably; the later the better for the bulls. (:-)
Thank you again for your valued input.
Just a note that I didn’t want to leave the impression that I am a bear on gold. Quite the contrary: for now at least. I see at least 1435; then probably 1525.
http://cbdakota.wordpress.com/2013/03/08/solar-cycle-24-activity-compared-to-previous-solar-cycles/
eclectic
First I wouldnt treat all solar cycles alike, one has to know where we are in the 43 year cycle, or whatever long term cycle one has found.
Concerning SC24, my work on planetary cycles suggested a solar maximum around Sept-Oct 2013, while my solar tide cycle (mainly Venus-Jupiter) had a max in January 2014, providing some power into Feb. So from here on (March) my work does not expect any more surges in sunspots.
What is POG? Precious metals and Gold? Yes I think they are on borrowed time. We had the long bullmarket and spike in 2011, and that may be it. But a double top could happen, or we go sideway in a wide range for a long time.
In the 43year cycle low that ended just before 1900, Gold went up the whole period. And in the 43year cycle low that ended late 1970s, Gold spiked around 1980. Also at the 1930s low, gold remained strong into the cycle low early 1940.
So my intuition says we shouldnt expect any wil gold rally to new extreme highs, but gold could go sideways in a wide range and remain strong, while I expect deflation and hard times for the stock market…
Deflation…if we are to believe the US core CPI which excludes food and energy, yes?
Jan:
Thank you again for the explanation; and for sharing your work. Will respond later this week; and continue on any new discussion entry that John posts. Cheers.
pog = price of gold; or gld symbol.
Watch Skew Index Weekly at 112…
Jan, I don’t wish to pry; so is the Venus/Jupiter cycle (43 yrs) similiar to what John discussed here? I don’t recall if you were following his site back then?
https://solarcycles.net/2012/02/23/solar-cycles-and-astro-trading/
Or, is this a difference reference to your cycle; although the paper says it’s a 44.7 yr cycle?
Click to access v307_311.pdf
I have the belief that any methodology or trading system has to be discovered by the one who is going to use it; which is why we need to research and make our own discoveries. I don’t wish to pry. My specific studies have been in the field of technical analysis; so a lot of this solar trading stuff is challenging.
I can’t tell you how much your conclusions mesh with the stuff I look at. If we add those 17/18 months to your SC peak in Sep/Oct; we arrive at a time window for a low in circa either March/April of 2015. So, the price I think has the wind behind it until the rally fizzles (1525 – higher?) and then we go back either down hard or into an extended trading range lasting maybe years. Again, many thanks for the discussion and information. Cheers.
hi eclectic
The Venus-Jupiter cycle is a short one of ~4 months. the major ~43year cycle is still unexplained, but I do have a hypothesis, and it is based on the outer gas planets. Think of the AM-model (Landscheid/Sharp)… and the so-called disturbances. That is the first clue, but then there is more.
Looks like my work/cycles expect a SPX 2016-low… early or late that year – guess it also depends on where the top is this year.
I kind person sent med historic gold prices yesterday, so I will soon have a look at it
JAn 🙂
I came down with something rotten on Saturday and am still ill, sorry for no update or replies. Will be back when I’ve shaken it.
same here
Thanks for the update get well soon. I dont see anything which can trigger a sell off to your target zone. Are you now thinking its later in june july timeframe.
Take care, John, thanks for everything.
Feel better!!!
Get well soon!
Get well buddy. All the best from Aus
YES feel good to all
This March-April crash, as much as I would love to see it happen, just does not look like it is going to happen anytime soon – I guess too much free QE money.
Simple but stoic…http://caldaro.wordpress.com/
For the higher we soar in contemplation the more limited become our expressions of that which is purely intelligible; even as now, when plunging into the Darkness that is above the intellect, we pass not merely into brevity of speech, but even into absolute silence of thoughts and of words.
Yes this was quite impressive short squeeze in U.S. markets today but I still think we are heading for SPX 1630-1670 in something like 10 trading days.
Only strong (10-15 points) gap up tomorrow would convince me the other way.
In my opinion markets will trade in range (1650-1900) until September and finally turn down only afterwards.
a brief note then back to bed…for those that took the time to study the slatepile… Yes… the selloff in GLD today was triggered by the 886 algo to the penny….. I have been showing this for free since 2006…. it is public knowledge….yet it has not lost its importance since I first discovered it by chance when i was daytrading GS back in feb 2006.
Slater, where can I read more on the 886 algorithm? Thx.
I created a file years back…… google ”slatepile” I have to admit it is quite disorganized…. I created it while i was still in a cast from falling and breaking my back, wondering if I would ever slate again. On the plus side, much of my other work that I use is there…. THE true gem is the chart that called the day of top in $INDU in oct 07,,,, the response to which was universal derision at the time that I would trust a set of tools that a 10 yr old could understand to make such an important call.
I had forgotten how much I had shown in the ”pile ” on the red line green set variations Do not ignore it.. It was that exact setup that caught the lows within 4 cents in DBA,GDX,EGO and more.
Thx slater
I with I knew what .886gap5@geo was and what to do with it :))
Slater very much interested as others here as to how to study .886gap5@geo and how to just it in charting tnx
Where is John? Is he on holidays?
He is under the weather…I would guess he won’t be leaving anytime soon since he is predicting major changes in the market right now thru April…
The candles on these charts has done nothing to convince me that today reversed ANYTHING.
The Nasdaq and Q’s show greatly reduced volume and weakness into the close with less than impressive candles.
I still believe that Thursday’s bearish action has not been erased and that the bulls still have some work to do if they wish to reverse last weeks very bearish action.
http://stockcharts.com/h-sc/ui?s=QQQ&p=D&b=5&g=0&id=p83248522861
http://stockcharts.com/h-sc/ui?s=$COMPQ&p=D&b=5&g=0&id=p31645502288
Eclectic, thanks for those links. The first one shows they predicted Solar Cycle 24 very well so far. The line up of SSB Distance as 179 y Cycles 995-2985 AD was very interesting. Doesn’t it show we are in for a very cold period? The “fact” that climate change meaning man made global warming is now established science (oxymoron) makes me worry that we might get a mini-ice age. What’s the word on this? The article did not talk about the relationship with minima and cold.
Yup, I think it was Einstein that said, any fool can make something complicated, but it takes a genius to make something simple 😉
On that note, the daily megaphone chart is still proving its worth as a guide to the action – yesterday was merely a post-failed-breakout re-test of the underside of the upper line: http://scharts.co/1cVPvBW
My cold advice:
Eat: home-made chicken soup for the soul, sure, but try a green smoothie – blitz 2:1 fruit:leafy-green-of-your-choosing (organic/bio, natch) – NB chlorophyll is a powerful detox agent, so you may experience headache symptoms at first if your system is toxic – start small/slowly!
Supplements: zinc, magnesium, vit c (the lipospheric stuff is mega), vit d3
Detox: sweat for at least 15 mins in a very hot bath each day
Sunshine.
What Ultra said re green smoothies…..!
Does anyone know of a strategic allocation fund (ETF or mutual) which invests on the long side during bull markets and goes short stocks during bear markets? I know Sprott has the Bull/Bear RSP fund, but the minimums are too high. (I am looking for a long term fund for my wife’s IRA.)
On a separate note, get well soon John. I had pneumonia last fall and it knocked me for six, but slowly recovered. We all wish you a speedy recovery.
Why would you want to invest in a fund which has 1, 3, 5 year returns of -31%,-31.7% and -17.5% respectively anyway?:)
Hmmm. Getting burnt here. Not sure whether to cut and run. This could be a huge bear squeeze though….
Simon, this may help.
http://twocents.blogs.com/
Looks like a 10-15 point jump is the order of the day. I’m bearish on the markets, but the bulls never seem to get out of the picture. Bad news, market jumps as it is expected. Good news, markets jumps higher as it proves that US economy is really strong…
Kent, thanks but I fear you may be asking the wrong guy? Quite honestly, I’m just learning about the finer points of these topics. As far as astronomy is linked w/climate; I would defer to “A Roadmap Of Time” by Brad Steiger. I first read this book some 35-years ago and a copy is currently on the way to me. It contains a chapter on trading commodities; but I was never able to put it all together. So I thought it time for a renewed visit. BTW, the trading methodology is a solar/lunar based system.
I think I read somewhere about a mini ice age.
Jan:
Any possibility you can clarify how the venus/Jupiter equation = 4-months when the venus cycle is roughly 7.997 years and Jupiter 11.88 years? You must be looking at different data (tidal data for each planet?) than cycle length? Really appreciate the networking.
it is the tidal force of the planets acted upon the Sun. The cycle is of heliocentric Venus-Jupiter conjunction/opposition, which is every ~4 months. It results in a short term cycle for solar flux/sunspots. Every 2 or 3 cycles is enhanced by Earth, giving on average a ~10 month cycle of major tidal force.
In the larger picture there is a tidal cycle of 12 years, from the Jupiter perihelion (when Jupiter is closest to the Sun).
The major barycentre/angular momentum cycle is ~10 years from the Jupiter-Saturn conjunction/opposition.
The tricky cycle is ~11 years from Venus-Earth-Jupiter. I still dont know if this is a tidal cycle or a barycenter/angular momentum cycle.
The supercycle is from Uranus-Neptun of ~172 years
so far my calculations show that the 11 year EVJ cycle is not tidal, so it probably is barycenter or something else
The 172 year cycle is barycenter, and the 1/4 harmonic is 43 years
and in the 12 year Jupiter cycle there is an interaction with Mercury resulting in some kind of a 6 year cycle
One of the many money bloggers that say markets are not going to crash…
http://scottgrannis.blogspot.com/
But if the Fed doesn’t take steps to tighten monetary policy in response to the quite rapid rate of shift in the demand for money, there should be inflationary consequences – meaning If tapering is not increased in pace then inflation fear will become increasingly justified.
Timing is a bitch.
Unless SPX reverses at the opening bell 1950 is now given. Bear chances are greatly diminished now. After Fed statement we can even get crazy spike to low 1900s.
Gold started deep correction few days before Fed so it can be the slight hint it would be not so easy for stocks. But there is so much froth for now.
I agree. John’s theory will be seriosuly challenged today. Central Bankers will just not let this crash happens. I somehow feel its not right to compare current market with past occurence. Markets are working together under collabrative CB’s.
But it can still be both ways this afternoon. Gold, copper and Japanese yen point down, will stocks resist ? If they adjust to commodities and yen it can be sharp move. Maybe there is stiil “second chance” to sell and it is now..
On China from George Magnus:
http://www.ft.com/intl/cms/s/0/ad2ae64c-adc6-11e3-9ddc-00144feab7de.html?siteedition=intl#axzz2wQ25Tn54
I see nothing yet to say that this is anything more than a bounce before heading back to new lows.
I agree, Allan. John’s Jan. 9th call, that the Dow had topped on Dec. 31st, is so far proving to be absolutely correct. The marginally higher highs for the Nasdaq and the S&P will not be confirmed unless the Dow takes out its Dec. 31st high. If it does, and 16,588 is breached, I’ll have to reevaluate (as, I’m sure, will John). But for now, all I’m seeing is a bounce before a further breakdown.
DJ, all major market tops in history leave a similar finger print. This top will be no different when we look back. The trick is in recognising and then having the discipline to act on that before it unfolds.
History is our guide.
We are all blessed that John is a great researcher and analyst of history with the ability to search out phenomena that has likle had influence of the course of that history.
To those that think this time is any different and that the Fed and Central Banks have this time succeeded in be able to change how markets respond indefinitely, remember this very famous quote:
“Those that ignore history are doomed to repeat it”
Jan:
Tks again for your valued response. In the helio vs geo debate (some say it doesn’t matter) logic tells me that one should go with helio; which is reality based as far as the solar system is concerned. Apart from that; most of the astronomy/weather science type/studies and papers are done using the heliocentric system. As I learn more; the Solarfire product does both helio and geo. I’m inquiring about the Matrix program. Do you perchance use any program?
http://alabe.com/solarfireV9.html
http://www.astrologysoftware.com/index.aspx
From a market strategist:
Although the shift in guidance was quite small, with an expected interest
rate at the end of 2015 of 1% and 2016 of 2.25% replacing prior guidance of
0.75% and 1.75%, our belief is that a very important corner has been turned.
In our experience monetary policy has the momentum of a supertanker, but
once the turn is made the change in direction generally takes things much
further than anyone (including the FOMC) would have expected. It should
be recalled that the last time the FOMC changed direction was August 2007
when turbulence in the MBS market led to a 25 bp reduction in the Discount
Rate while the FDTR was kept unchanged at an inappropriately high 5.25%.
PATIENCE. the top will take time to unfold maybe a month or two. japans top is in now, we had 5 waves down on daily chart then wave 2 up in bear flag with abcde then brek down back up kissed underside of channel now falling again in wave 3, all text book stuff
Hope this extended absence is not indicative of how under the weather you are. My prayers are with you
Seconded. Get well soon, John!
Thirded.
Here’s another look at the nearly-3-months-and-counting divergence across the leading U.S. indices:
http://screencast.com/t/YuWBL6x8
Key reversal on SPY on Wednesday, coupled with a side-by-side divergence of DIA (highlighted; SPY made a higher high, DIA did not). Inside period yesterday can be a nice entry, if we break down today – sell a break of the low, with a stop above the high. A smaller range would be nice though. Let’s see what unfolds.
Missed one: there is a further daily divergence that I neglected to point out – SPY also broke its prior spike high Wednesday, whereas DIA did not.
http://screencast.com/t/KxSaIJ1CFKV
And another look at the monthly picture with inverted VIX vs SPX – quite something to note that the last time we had successive divergent lower highs over such a long period on VIX-1 was, er, 2007.
http://screencast.com/t/khnS1bJaU
Interesting site and clearly John puts in a huge amount of work in to this.
However the call on short term waterfall declines does not look like it will develop in that way.
at this morning high, technical traders saw the $ indu complete abcd at .886 with legs of equal length into the daily and weekly pivots…
So …are you looking for new highs or a reversal? From what I remember, John’s key technical to watch was the DJI, if new highs on DJI then we go higher.
Is the unveiling of the demographics correlations not worthy of more formal study at higher levels of interaction and influence. It has the appearance of significance potentially far greater than this blog can give appropriate credit to. Unless it relates previously examined and discarded material in academic circles then a move toward establishing any rights, formalised proving and broader based publishing appears advisable.
UPDATE:
Regarding astro type software; I have been doing a lot of research on this topic and wanted to share my findings to wit:
“The program that we have that I can highly recommend for doing research is the Sirius program. The BlueStar program is designed for beginners and not for professional researchers. Here is the link to the Sirius info: http://www.astrosoftware.com/sirius.htm
Thanks again. Let me know if you have any questions after your visit.”
Another better option than the two I originally posted might be ‘timing solutions’.
http://www.timingsolution.com/
I know NOTHING about this subject and will not post any further information because it’s probably off topic. From what I have garnered; my choice right now would be Sirius; (based on the individuals Bill Meridian/Robert Hand) but that might change if I learn any new information. Thank you.
here is the 886 algo entry short from today with notation…. all I can know in advance is that i want to hit a trade setup I traded countless times before,,,, here in this trade the risk was one snp point.
http://stockcharts.com/h-sc/ui?s=$SPX&p=5&yr=0&mn=0&dy=9&id=p15984481225&a=338320968&listNum=4
note now how it has traded to the key completion level for an abcd…..for the trade to reach its nearest target…. IT MUST BREAK THE ABCD PATTERN !
Slater, does this pattern work at longer timeframes?
i will answer later
EVERY trade i take is entered down on the 5 min…. every trade has a close target that offers at least 5 to 1 the initial risk… It is very rare that I risk more than 25 cents per share on a trade….. even the trades i plan to hold for months with targets way far away…. still entered the same way.using the tools i show,, there are way more trades offered every week than i can possibly trade…. so i have no reason to take trades of lesser quality….everything i show is public knowledge, available to any trader who has the interest to do the work…
LATER this weekend I will show a couple of my favorite longer term trades that were entered on the 5 min basis the 886 algo that at the time i took them non technical traders thought i was the village idiot….
Slater,
Been monitoring the 886 since you posted. I’m amazed. The S&P hit a daily 886 then made a lower high on the 5min chart off the 886…How uncanny!
Would love to know the other tools you employ. The VIX thing Ive got up on my charts now as well.
Class 🙂
Looks like this market is testing John and his work to the limit!!!
day traders will be looking to lift trade at arrow
http://stockcharts.com/h-sc/ui?s=SPXS&p=5&yr=0&mn=0&dy=7&id=p55756483503&a=331252030&listNum=4
Hi fellow readers,
I would like to share with you Richard Duncan’s view of liquidity vs. asset prices, hope you find it useful. Duncan is the author of ‘The Dollar Crisis’, I am sure some of you have read the book.
“Plugging in estimates for the budget deficit, the Fed’s taper schedule and estimates for the current account deficit on a quarter by quarter basis for 2014 suggests that liquidity will remain excessive during the first half of the year, but that a liquidity drain will begin in the third quarter and become significantly worse in the fourth quarter. If this analysis is correct, asset prices are likely to fall during the second half – unless the Fed provides more Quantitative Easing than it is currently signaling. ”
http://www.richardduncaneconomics.com/the-liquidity-gauge/
Cheers.
“EVERY trade i take is entered down on the 5 min…. every trade has a close target that offers at least 5 to 1 the initial risk… It is very rare that I risk more than 25 cents per share on a trade….. even the trades i plan to hold for months with targets way far away”
Slater, what is $0.25 in terms of percentage of capital deployed? How much are you willing to lose in percentage terms? Also, having more 5-1 initial risk trades than you can invest in seems almost too good to be true.
I’m not wishing to come off as negative here, merely curious. Thanks for your generosity in sharing your work.
everything is a function of the tools… the tools matter…. slater doesn’t matter at all… my way of trading looks to take chunks of price over and over…. I think only in terms of percentage to minimum target
Hi, Slater,
Firstly, kudos and thanks for sharing your methodology. Just looking at your annotated chart and wanted to write it down to make sure I have the setup correct 🙂
So, the setup, for a sell: confluence in price and time of an ~88.6% retrace of a move down, with the uppermost up-sloping line of a pitchfork based upon the last sub-wave of the move down into its low. All the better if the 0.886 occurs immediately after a gap open.
Close?
the886 algo has 3 core parts
a gap, specifically on the 5 min chart, such that the first bar of today does not over lap the last bar of yesterday.
a line, specifically from a medianline set.
an 886 retrace.
Jim Kane showed me the importance of the 886.Prior to reading his work I
had read everything available by ALL the KNOWN AUTHORS…. the 886 was
nowhere to be found.. Jim was unequivocal, stating” At this time, the 886 is the most important number in the market”I said if that is true then the computers that run the markets must be trading an algo that sorts the important 886’s from the myriad othersThe discovery was chance.If I had not been trading medianlines I would not have found it…If I had not been daytrading GS when it turned 12 times in a row at the 886 I would not have found it.10 times it went to the minimum target 2 times it did not… Eureka… the 10 times were based on the gap on the 5 min… I SPENT WEEKS SCANNING the setup… from AAPL to USO to TLT to GS… IT DID NOT MATTER…. the computers were happily banging on a setup that was there all along to be seen and sorted… but only sorted by a specific set of tools that most traders don’t use .
.
Thanks for your reply – have it clear now.
Been researching median lines/Andrews’ pitchforks – found this video intro quite useful, if anyone else is interested:
great day today
last chance to sell rally ending
build up now to the puetz crash window 4/9- 4/18
i’m expecting 4/14 crash
This is John’s blog. I am in awe of his work and agree a larger selloff is coming.In showing my work, I am just trying to share how I am making multiple low risk attempts to be on board when the move comes… but so far all the sells have not led to the big break and have been reversed by buys…Taking a break and awaiting John’s RETURN.
Basic gold chart:
http://stockcharts.com/freecharts/gallery.html?s=%24GOLD
On the daily it looks like a golden cross is about to take place in the next few days. On the weekly we (just about) have a bearish engulfing candlestick. In the light of the weekly candle, is this a “golden” buying opportunity? GDX and GDXJ also exhibit similar traits, except that the golden cross has already taken place in both cases. Yet some “analysts” are still forecasting a drop to $1150 gold. Not sure what to think.
I tend to think we’re not going to get much of a correction in gold/silver prices this entire year, Simon (that’s what my fractal work showed starting late last year). Erik Swarts, of Market Anthropology, thinks the same. He called the 2011 peak in silver to within two weeks, and this is his latest analysis of the precious metals sector (the piece begins with some general information about his methodology):
http://www.marketanthropology.com/2014/03/there-is-no-plot-for-je-ne-sais-quoi.html
Gold weekly using median lines – http://scharts.co/Q3Op2t
(n.b. the speculative breakout median line drawn is a modified Schiff – see video above – where the base pivot is moved 50% in both price and time – seems to fit the action so far, but needs to be confirmed by further price action)
Interesting chart on technology: http://stocktwits.com/message/21292717
Thanks for sharing that, gareneau. I’m not sure when we start down in earnest from here, but the clock is definitely ticking.
D.J. appreciate sharing with us your thoughts and comments relative to the precious metals markets. Re market anthropology; I had always felt that you can come up with any past comparision (analog) overlayed with current data and see price similiarities. I didn’t realize there were a variety of comparisions used first; before price was examined.
Hey Slater,
Been studying your files. A quick q if you can…the .886. Can u explain what it is and how to calculate? (sorry, new to this.) Thanks!
Agree Slater. Needing a little more data or insight …I’m new to. .886 too…Thanks
For the .886 methodology I’ve found this:
http://www.esignallearning.com/education/marketmaster/archive/0404/040204.aspx
Has anyone on this site followed Harry Dent over the years?
Ive just began to read up on this guy w/o actually reading his books. It looks like he bases his projections on demographics but from what ive gathered he expected demographics to peak in 2010 , in contrast to John’s 2000 demographic top. So based on his books’ synopsis he was all for a demographic bull starting in the early 90s but kept rooting for it to catapult even higher past 2000 all the way to the yr 2010. After 2000 Thats when everyone blasted him and called him a quack as he kept calling for a 2010 top. Then near the dow bottom right around 2010, just where he said demographics should peak he has pretty much aligned his views with John’s. Im curious to know what demographic parameters he was basing his 2010 demographic peak on, that diverge heavily from John’s at the peak but converge at the nadir at about the same time.