

Yesterday the SP500 finally closed above 1850 with a rally in the last 15 minutes of the US session, and in so doing carved out a marginally higher high than December/January, in a club with the Russell 2000 and Nasdaq 100 indices. I do not see a bullish breakout that sets the scene for a new round of gains, because as per my note before yesterday’s session, it is indeed achieved on multiple divergences and is likely to be short-lived.
Volume on yesterday’s SP500 up-day was again inferior to the down-days, whilst treasuries had another up-day despite equities and continues to be a signal. Economic data was again poor and remains divergent. There is a momentum divergence in the SP500 new high versus the previous whilst breadth measures of % stocks above 200 MA and 52 week new highs continue their divergent downtrends. The VIX also shows divergence and the trend exhaustion indicator suggests any further gains will be hard to come by currently.
Current Skew reading:
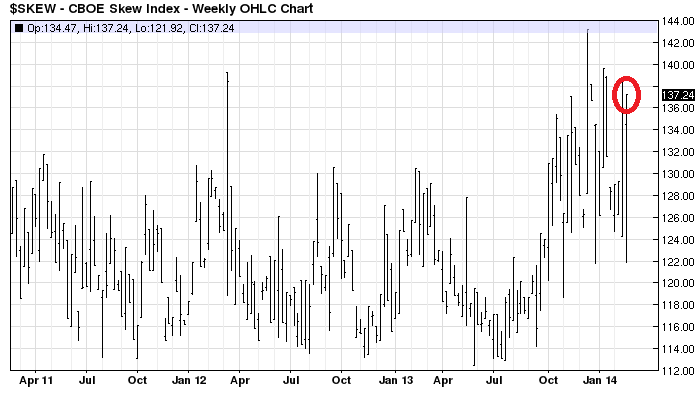 Source: Barcharts
Current NAAIM reading:
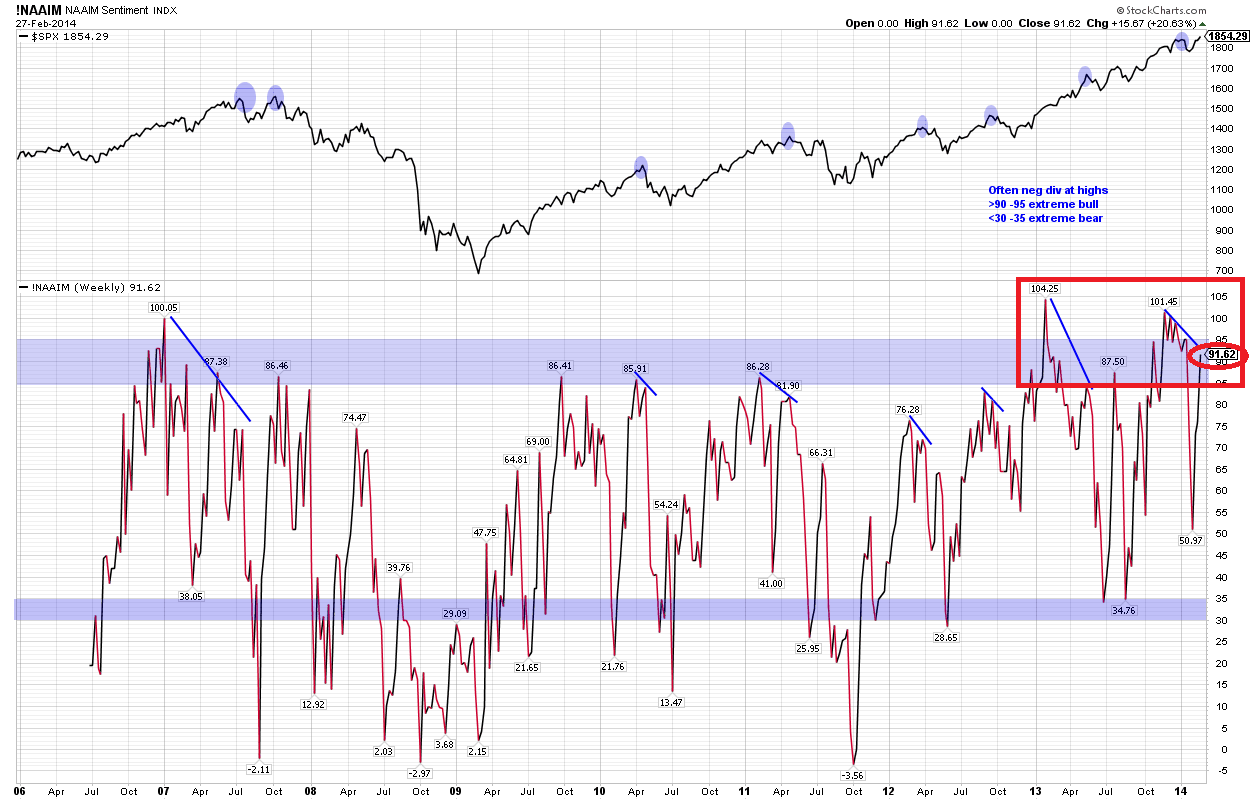 Source: U Karlewitz
Current Investors Intelligence bull-bear reading:
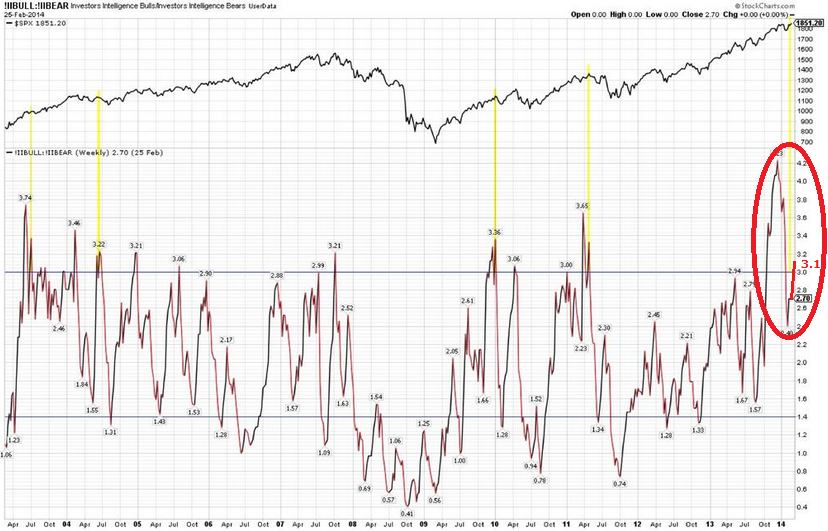 Source: U Karlewitz
Plus ISEE equity only call-put reached an extreme yesterday. In short, the rally has lured back in the ‘dumb’ money and I suspect yesterday’s new high close on the SP500 will turn out to be the final bait for ‘all-in’.
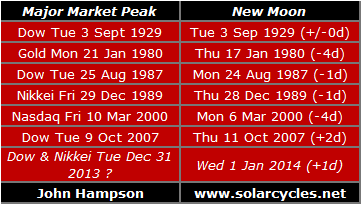
The Dow and Nikkei continue to honour my 31 Dec 2013 top call, and are both several hundred points away from a challenge to that. They also both continue to carve out the ‘second chance’ peak of the historic analogs topping pattern. The FTSE, Dow, Russell and Nikkei remain at long term resistances.
I remind you of this:
 Tomorrow is the new moon and that sets up the possibility of the other US indices now topping close to it: either yesterday, today or the first couple of days of next week. As March and April are inverted geomagnetism seasonal lows and another geomagnetic storm is currently in progress adding to the recent upswing in disturbances, I have additional reasons for the markets to top here as we exit February.
If we look behind the price action at internals, valuation, sentiment, leverage, technicals and fundamentals (all of which I have covered in detail in posts since the turn of the year) then the short opportunity is clear: this a rip to sell, and there won’t be many opportunities as golden as this.
Let’s see how today unfolds. I prefer to comment once the action is complete because there are many intraday swings currently, as evidenced by all the tails on the daily candles recently (another clue for a trend change), but I will comment intraday if I see something more decisive in progress. A reminder that some sharp selling into the close would set up the potential for a big down day on Monday, particularly with the geomagnetic storm aiding again.

Is it possible to see the first decline (comparing to 1929 analog) in April, a month rally and larger decline in June-July, a sideways market for a couple of months and final decline in October?
That completes Phase I of decline.
Then a 6-7 month rally (till May 2015) and start of larger decline over 1-2 years after that reaching a low around 2017?
Maybe. But until my strongest case is invalidated, I maintain that we are more advanced in it.
John, I think you have an excellent site and fantastic analysis. However, one has to respect the price action.
You said, “……..any further gains will be hard to come by currently.”, but the market has blown past the December high in a hurry and will probably move towards 1,890-1,920 before reversing. Sometimes, it is better to accept the error and rethink.
Long-Term, I think you are on the ball. Prices always move farther (upside AND downside) more than one thinks possible.
SPK,
In general I agree withy your analysis. I think that the decline will occur in summer 2014 and bottom around October but then bounce into 2015.
How did you arrive at your conclusions?
Jack
Combination of factors – Technical Analysis (MACD, Cycles, Wyckoff etc.), Liquidity, some astro (based on my friend’s analysis) but most importantly bond prices/yields.
You?
SPK,
Charts of S&P Seasonality, charts of Presidential Cycle, and the fact that for the last hundred years the stock market has almost always increased in years ending in 5. Also, I think that secular bear and bull markets last about 18 years. If 2000 was the end of the last secular bull then a new secular bull might start in 2018. If so, I expect a low around 2017 which is after the end of the four year top in the presidential cycle in 2016.
The low I expect in October 2014 may be a drastic waterfall decline type of low. Afterwards for the next couple of years we may be crawling our way up before we hit another low in 2017. Then the bull market starts.
Jack
Really appreciate the effort you put in this blog; makes me come back to read every day.
Thanks Andre
Thanks John. Awesome analysis and incisive commentary.
Thanks Denmar
Thank you for the indicators update and the heads up by your firm conviction, which is undoubtedly well founded. But there are still some strange aspects in this topping process, which I cannot explain.
This week the Belgian stock index broke out to new highs around 2% above the former top. The Belgian economy is extremly exposed to exports and imports and therefore a leading indicator for the state of the world economy. This is the background, why $Bel declined much straighter since July 2007 and in early summer 2011 than DAX or SP500. Today the new $Bel highs give the exactly opposite signal. However the RSI is very oversold and supports a short term correction.
For that and the relentless rising A-/D-line I’m expecting a short term retreat, but are still not fully convinced of a major top. As Janbenestad, who some weeks ago predicted a cycle top to occur around now, commented further: If march turns out to be positive, the bull market may continue until summer.
Thanks. I doubt there has ever been a top where everything has aligned and fulfilled. I have confidence in what I have.
We may well see a reversal now or later today at Dow 16400. In any case it doesn’t feel comfortable to position against the markets with good arguments. Frankly it is a project which I don’t recommend anyone to copy.
How institutions are currently driving the markets higher against all reason is measured here:
http://www.stocktiming.com/Friday-DailyMarketUpdate.htm
May be they do it only for month end window dressing (a reason still), but better only to bet on it with deep pockets, if at all.
Yes, but they are also the ones (extremely) highly leveraged.
watch SLV today…..
More clues Slater?
John I love your site. Been lurking for the most part with a couple of posts here and there. I have skin in the game right now with the nasdaq as ive conjectured for a while now that it would double top, a psychologically necessary condition to suck in retail. As an extension to this condition, I managed money for a family friend for several years. It was a very heavy miner port much like mine. At the beginning of this year she forced me to move everything into what she identified as “safe” stocks, essentially all the glamour stocks. To not unnecessarily drivel on, she is a huge contrarian indicator for me and i think we are seeing the final leg of this cyclical bull within a secular bear. What has me playing mental chess right now is that the nasdaq/s&p ratio also topped in 2000 at 3.3. We are currently at 2.328. This ratio is what lead me to cash out on s&p long, but the 3.3 ratio was achieved when both indices were both hitting fresh highs. 5k nasdaq at 3.3 ratio would render 1525 s&p which would be almost 20% lower from here.
Thanks Joseph
John,
The start of the 2010 year is looking very similar to the start of 2014.
Both times the S&P made a high in the middle of the Jan and then sold off.
Both times the S&P made a bottom on Feb 5th.
Just food for thought.
Thanks for the excellent material.
Oops. Change to “The start of the 2014 year is looking very similar to the start of 2010.” I think you catch my drift.
some parallels also with 2000 and 1974
Thanks Rick
Thanks again for your well-reasoned analysis.
I think the key to the market now is not to be found in economic developments but the unfolding of the crisis in Ukraine. Heavily armed mystery troops have taken up positions around key airports in Crimea and a Ukrainian Coast Guard base in Sebastopol. I suspect Putin will repeat the power play he conducted earlier in Georgia. At the very least he will support secessionists in the Eastern Provinces and Crimea. Any miscalculation could result in armed conflict in the next few days. You would have to be crazy or dumb to carry a long position over the weekend in this environment.
Thanks
nyse margin debt at new high data just out $451bn
Thanks – had been waiting for that
we had nice 5 wave decline on dow from high, current rally abc, and c wave is 5 minor waves, so i agree that monday could be start of fresh declines, also we have divergence in vix (etfs)
Most of you are looking at solar cycles and divergences, but there are forces far greater than the above, and those are low inflation and a very benign 10-Year TNote. These latter 2 factors obliterate technical factors and will continue to do so until rates rise, people seek safety in higher paying Treasuries and earnings collapse (which isn’t the case currently since 70 % of reported earnings beat expectations).
I wrote the above over a month ago on this website and was ridiculed for forecasting a continuation of the Bull market.
Forget the charts and look at the fundamentals. Sure, one day the technicals and the fundamentals will both be bearish, but till then enjoy the free ride to 2100.
There is a reason for low inflation in spite of all the money printing. It is called as ‘deflation’. I look at yields all day long, and yes, there is a high possibility of reaching a lower low (1.35%) in June-July. But under Wyckoff, it would a ‘Spring’ and bonds could be (should be) shorted like there is no tomorrow. Yields will start rapidly moving up thereafter. That’s my guess anyway.
Oh, yea, one more thing, all that money from bonds moving into equities and higher yields meaning growth, silly me, I thought Fed was spending (now over $3 Trillion) in trying to keep yields low.
2,100? In this ‘Yes, We Can’, anything can happen, but not feasible.
SPK, I meant S&P 2100 which isn’t that far off. By the way, I do read loads of technicals including Elliott Wave, and they have all been bearish for the past year. Well, even a stopped clock is correct twice a day, so one day the markets will crash. No doubt about it. But I made over 50 % last year (including dividends) and am glad I stuck with my gut feeling that the economic environment was going to be extremely friendly to stocks (a desperately accommodative Fed, increased profits from outsourcing, relatively high unemployment and therefore low wages (also miserable for ordinary Americans but great for corporations), etc.,.
I am getting completely out of the stock markets at or around S&P 2100, which would suit both fundamental and technical criteria. I guess this will occur within the next 2 – 3 months. This is what I’m talking about: Technicals and Fundamentals must be in sync.
How does April/May fit in with a solar cycle top? If the answer is positive, well, this simply reinforces my strategy.
Good luck with your investing.
It’s doing a blow out top today, and will decline, maybe retrace 5 to 10%, but I think it may goto new highs to shake out the last bear. A e wave right now is too easy. I can hear it now “5 year annnivesary of the low”, going down, everyone get scared then it will retrace up in april and the big boys will push it up 150 points like they did in February.
FWIW, John and Jeff Seymour of Greedometer fame are in agreement:
https://www.greedometer.com/get-shorty/
I apologize in advance if this post is out of order. My curiosity surrounds what John referenced in previous posts about the Puetz Crash Window, to wit:
“Puetz studied the eight greatest crashes in financial history and discovered that all eight crashes occurred 6 days before to 3 days after a full Moon that occurred within 6 weeks of a solar eclipse. The odds of that being a coincidence, according to Puetz calculation, is less than 1 in 127,000.”
A question please than a comment and observation. The first requirement would be a solar eclipse. So, then the time window would be either three weeks before the eclipse or three weeks after the full Moon requirement? (Having said that it must be either before or after due to the orbits of the earth/moon/) I have spent a lot of time on the internet seeking a firm definition but to no avail.
I would guess that John’s observations about Puetz not being consistent; is because we have had several ‘crash windows’ that have come to pass with the result being ‘no crash’. What I did notice is that the crashes were the end to some extreme parabolic moves in prices; which we have not had. Hence, his skepticism.
In other words; Puetz windows tend to occur every year or two, while crashes are rare events.
But then again, there must be some dimensions to this event which holds John’s interest for future investigation.
Is the following explanation clearer?
First off you need a solar eclipse. Secondly, you need a lunar eclipse.
Or a new moon solar eclipse followed by a full moon lunar eclipse?
Sorry for the confusion on my part.
the problem with this “window” is that these happen twice a year. About every 6 months you get a solar eclipse followed two weeks later by a lunar eclipse. (or first lunar then solar). Sometimes you get 3 , a solar; two weeks later, a lunar; two weeks after that, another solar. (Or lunar, solar, lunar).
The point is that we get these windows a couple times a year, but crashes happen only once every few years or even only once every decade or two.
You can use this crash window to help you stay alert to the possibility of a crash if you want, but just realize the window is likely to pass without a crash occurring.
Regarding eclipses: Solar eclipses happen on a new moon; lunar eclipses happen on a full moon, so they are always 2 weeks (plus a day or two) apart.
Been having a look.
The 8 crashes he used to come up with this link to eclipses were:
1) Tulip mania-Feb 4, 1637 2)Miss Bubble-12/28/1719 3)S. Sea
Bubble-8/30/1720 4)1929-10/11/1929 5)1977 Soybean- June 1/1977
6)Precious Metals-3/4/1980 7)1987 crash 10/2/1987 8)1990 Tokyo
2/6/1990
The specific dates are what he considers to be the start of the crashes, which in effect is the top of the ‘second chance’ in my analogs (although his 1980 PMs date is questionable).
How might eclipses affect humans? Quoting from another site: “For millenia, solar eclipses have been interpreted as portents of doom by virtually every known civilization. The consequences of the induced human psychological states have led to physical effects.” So maybe they could be some kind of hardwired fear trigger, just speculating there.
His list is by no means comprehensive. His selection of Soybeans 1977 is very odd. See here:
http://www.futuresbuzz.com/s.bmp
One of the biggest crashes in history? No….
For now I’d say I need to look into eclipses more, but the quote that the 8 greatest crashes of all time conform is rather dubious on inspection.
Hi John,
liking the action here Friday.
i am looking for poss crsh april 14
solar eclipse april 29
lunar eclipse april 15
april 14 monday
lots of taxable gains in 2013
bulls will want to keep their gains in the “market” til the last second
John, technically speaking, (rule based) Puetz claimed that the first requirement is a solar eclipse. THEN we would IDEALLY look for a lunar eclipse; (and if not) the first full moon after the solar eclipse. Just trying to learn; but it is frustrating that Puetz’s dates conflict with for example the 1929 solar eclipse. This is the clearest explanation Iv’e been able to find.
http://www.spiritoftruth.org/julycrash.htm
http://thespiritoftruth.blogspot.com/2012_05_01_archive.html
I find the writings and explanations confusing; as well as some of the data points.
plenty of algos triggered at top… but would like to see an outside reversal day at minimum in the QQQ to think it is not just a short term trade.
On a day to day basis, the short term moves of the market serve one purpose… the trading of the volatilty traders, If some one can remind me the steps to download a stockcharts chart so that all can see, I will post a chart to show EXACTLY why the down move ended based on the volatilty computers having hit their targets….
http://stockcharts.com/h-sc/ui?s=UVXY&p=5&yr=0&mn=0&dy=7&id=p63851273162&a=338712604&listNum=1
did this come up so all can see?
Yes, but it’s all greek to me. It looks like the algos saved the day at 3:30pm…lol
your pitchforks did not come up…………….thanks for your great charts
re: downloading stockcharts chart, just go to bottom of chart and click linkable version…………..
hI John, finally markets have closed without a strong reversal, due the last minute ramp, so do you still expect a big down day on Monday?
As per below comment and new post, I’m expecting a down day, but a historic down day unlikely
robbie, has brought attention to something I have seen this many times in the past prior to reversals. Long VIX ETF’s have been outperforming for a week. There are potential double bottom set-ups in TVIX and UVXY that could, dare I say it, send both soaring on a substantial decline. I took a position and will add on strength if that be the case.
http://stockcharts.com/h-sc/ui?s=TVIX&p=D&b=5&g=0&id=p26764922730
PrimaCanyon/John:
Thank you for responding. I think the following table illustrates what PC stated.
2014 Apr 15: Total Lunar Eclipse
2014 Apr 29: Annular Solar Eclipse
2014 Oct 08: Total Lunar Eclipse
2014 Oct 23: Partial Solar Eclipse
Or expressed somewhat differently; a solar eclipse happens when the moon is ‘conjunct’ the sun; and a lunar eclipse happens when the moon is ‘opposite’ the sun?
I am struck that the REALLY HUGE crashes in speculative markets have occurred during this time; including the gold collapse in 1980 which was one of crashes that Puetz cited.
John, what would be the official dates for Puetz’s 6-week window time frame?
Again, thanks for everyone’s feedback which really further helped my understanding.
This definition narrows things down somewhat:
“….the greatest number of crashes start after the first full moon after a solar eclipse when that full moon is also a lunar eclipse.”
Using this definition there is no Puetz crash window in 2014, but there are two in 2015 (Mar & Sept).
As PC says, they often don’t work but it is something I keep an eye on.
http://thespiritoftruth.blogspot.co.uk/2012/05/puetz-eclipse-crash-window-just.html
17.6
Yes, a clear and concise definition! Either Puetz should get an F in technical writing or I need an F for reading comprehension. (:-) Now, I know this sounds ‘crazy’
but when I read the files on solar/lunar eclipses for the Tulipmania and the SSB,
I must be in the twilight zone; seeing different dates in those years each time I bring up the files???
I thought there were instances when a solar eclipse was followed by a full moon but it was NOT a lunar eclipse? Apart from all the reading/data confusion; there is this statement which is a different interpretation on the Puetz Crash window.
“According to Steve Puetz theory, the ‘crash window’ in the wake of the June 10th solar eclipse would be from six days before to three days after the full moon on June 24th, which was also a lunar eclipse, or from six days before to three days after the full moon tomorrow, July 14th. In other words, the likely timeframe for a stock market crash in 2002 would be between June 18th and June 27th or between July 17th and July 26th.”.
This is an important topic and has produced fruitful research. It would appear that the underlying rationale of John’s theories do in fact have merit.
Now, if there were a way I could just pin down the ACCURATE dates of those eclipses!
Just a quick note post Friday’s close – I’ll answer the other stuff and cover other developments in due course.
Another seesaw session and again one to wait until the end to, to make a judgement. Dojis on the R2K and Nasdaq which underperformed. Biotech had a significant down day and if this is the pop then it will have ramifications for both Nasdaq and R2K, but need to see how they perform this coming week. Bulls won out overall on SP500 and Dow but a double tail day again and on higher volume again points to possible uptrend exhaustion. We did not get sharp selling into the close so a historic down day on Monday is unlikely. That does not rule out a down day just not a supersized one.
Hi John
Now I have a setup for a top, and has previous stated, it may stretch a couple days into March. If this is a bearish left-translated 6 month cycle, it will turn down from here and into the summer. Also my 4 month cycle is topping right here.
For Norway I have a setup for a lower shoulder within ~0-2 days
http://www.marketwatch.com/charts/int-adv.chart?symb=1866580&sid=163487&time=9&startdate=&enddate=&freq=1&comp=&compidx=aaaaa%7E0&uf=0&ma=1&maval=50,55,60,65,70,75,80,85,90,95,100&type=4&size=3&lf=2&lf2=4&lf3=32&style=1013&mocktick=1&rand=783362984
But… if this doesnt materialise and March turns out bullish… the bullmarket should continue to the fall (some kind of summer correction in between).
The ~3,5 year cycle suggest a top around the fall.
Assuming that solar maximum was around October 2013, the historical data for DOW suggest that the bullmarket top (monthly close) either was December, or late in 2014. The February close for DOW yesterday was still lower than December, but many sectors/indexes closed higher.
My expectation is some kind of bearish or semi-bearish 6 month cycle, trending down from March sometime and into ~June. But if markets dont crash, we should see some kind of big double top or marginally higher top in the fall
JAn 🙂
If december 31st was the top, januari (31 days) + februari (28 days) combine to make 59 days. This is twice a lunar period (avg 29,5). And is half of the 118 cd cycle (4 lunar periods).
A lot of planetary inversions this weekend (astro’s call this stations). Around 6/7 march another cluster of inversions.
So my best guess is that next week will be down, at least untill thursday.
After that up again untill the 20th, when mercure turns retrograde, we have a tidal force inversion and an equinox. After that a multimonth decline
Lumber futures (housing market) for march,may and july were down last week. November futures were up. So a major bottom this year may come a bit later than june 😉
R2K’s “second Chance” has evolved to potentially a Double Top or H&S formation. R2K’s Keltner Channel (plus CCI and MACD histogram) suggests it is ripen for a corrective move.
$RUT:$SPX hooked down on Friday. Bad things happened to R2K in the past when it underperformed the SPX.
$NYAD (Cumulative) still pointing up into the sky so bulls are in control.
As the Bulls/bears battle continues……
Few charts that might be of interest.
https://www.tradingview.com/v/F2zrNuM9/
https://www.tradingview.com/v/Vfag1aUr
http://stocktwits.com/message/20530448
looks like the vix has been putting in a base the last 2 yrs, almost like a rounding bottom formation and is not making lower lows despite a higher stock market, also emerging markets not making new highs with advances in the s and p, dont know exactly where the top is here, but this will not end well.
I see two possibilities for cit : either march 20-ish; around the equinox, or yet another last wave up from april 4 into the 3rd week of april.
The problem is that DJ is already down, giving a bearish intermarket divergence for the S&P. According to McHugh in 2000 the s&p made the top several months after the DJ. This synchronization proces signals a significant top. But it makes timing extremely tough as divergencies come early by definition.
One thing is certain; when The s&p turns with dow and nasdaq, there is nothing left to support the market. So I guess the last thing remaining is to focus on s&p. And S&P could easily top in april.
But now first make a low on thursday (ecb interest rate decision, Phi mate date, jupiter direct, solunar tidalforce inversion) and then up into the equinox, the next solunar inversion and mercury retrograde, all on the 20th. The 22th we have a bradley date.
Then things will be much clearer. Speculating about a top untill then seems useless.
Thank you all for your input and links