
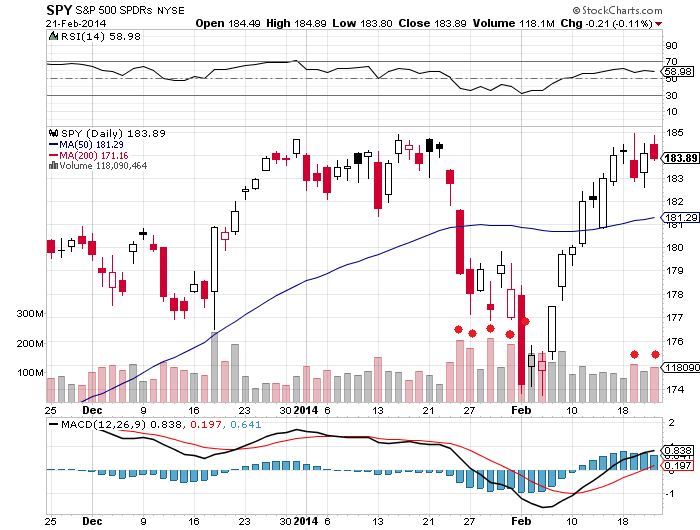
1. Bearish candles on US stock indices on Friday with volume continuing to be greater on down days versus up days:
Source: Stockcharts
2. Put/call ratio finished at extreme low again, which is more consistent with peaks rather than breakouts:
 Source: Stockcharts
3. Trend exhaustion indicator also suggests breakout now unlikely:

Source: Rory Handyside
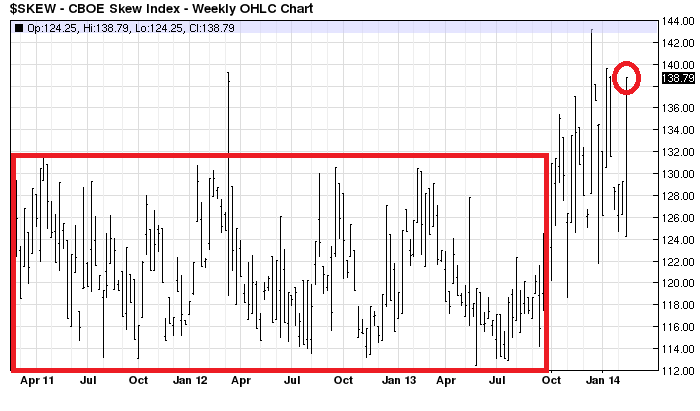
4. Skew finished at extreme high again, which signals amplified risk of an outsized move ahead:
 Source: Barcharts
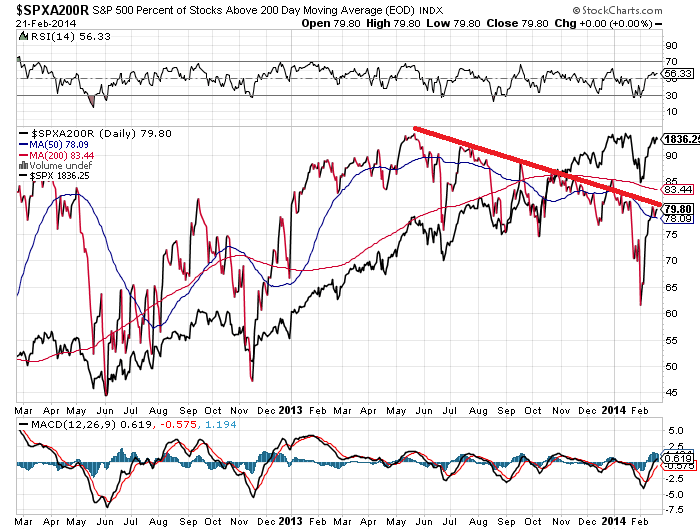
5. Two breadth measures remain in six month divergences:
 Source: Stockcharts
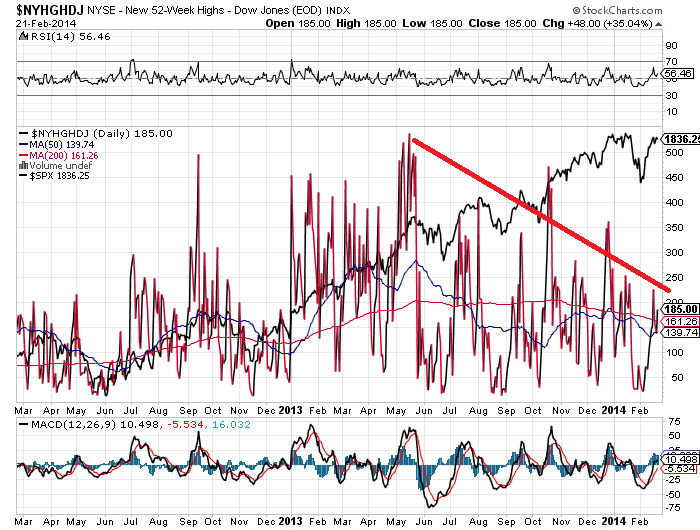 Source: Stockcharts
6. Economic growth is also divergent, and this is reflected in the advance in commodities being weighted to precious metals and agriculture rather than industrial metals and energy:
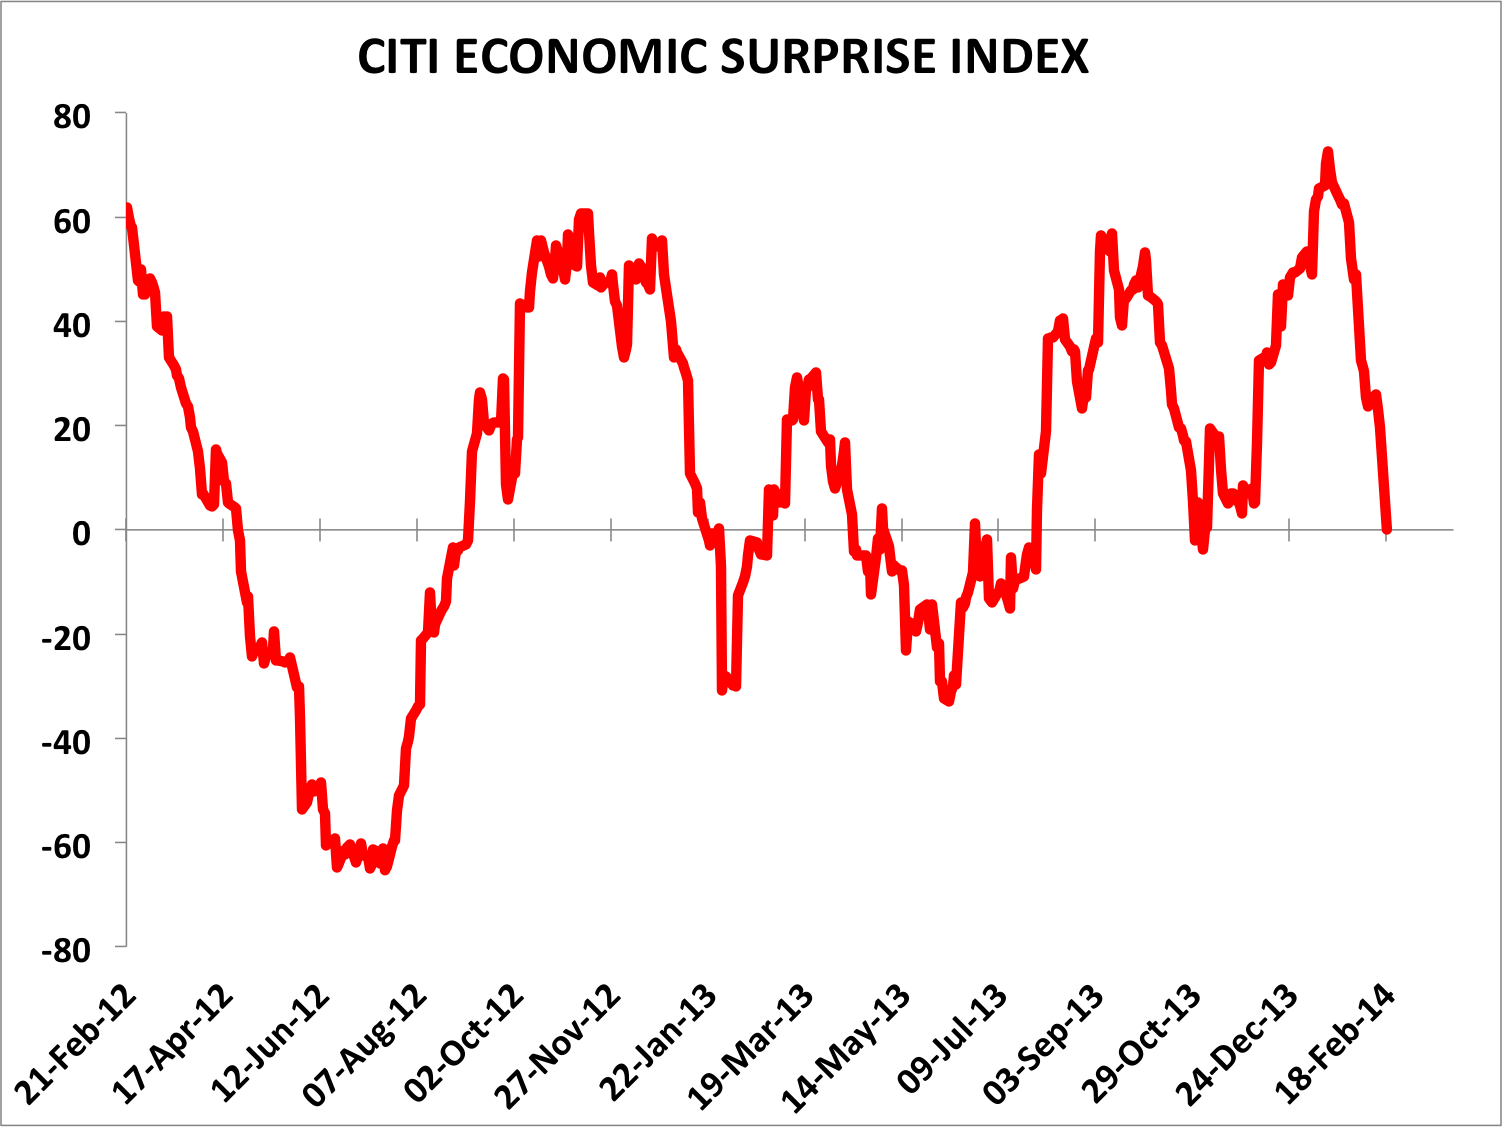 Source: Citi
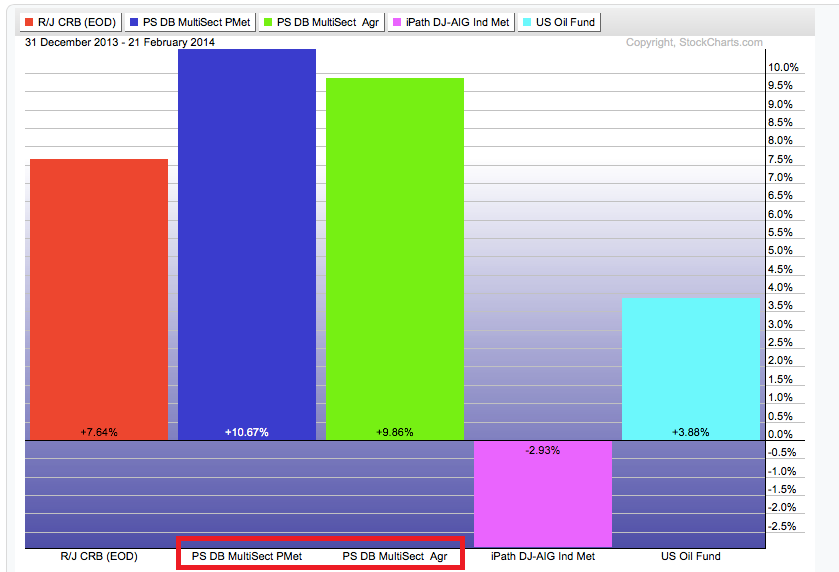 Source: U Karlewitz
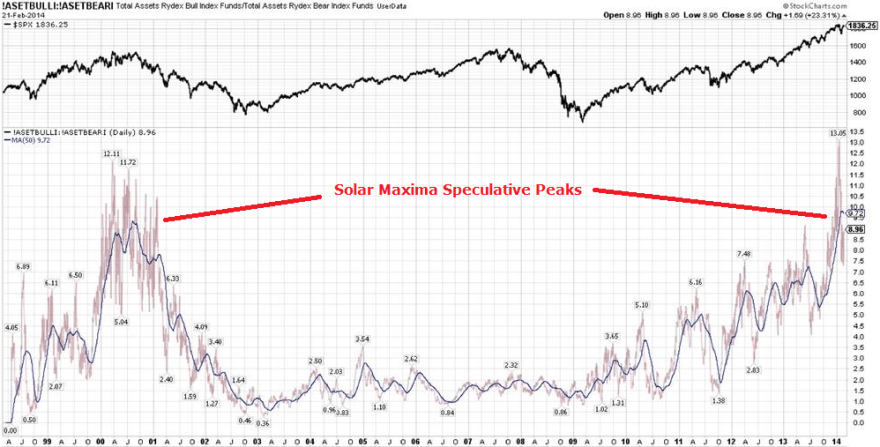
7. Long term view of Rydex bull/bear ratio points to a market top, specifically a solar-maximum speculative-excess market top:
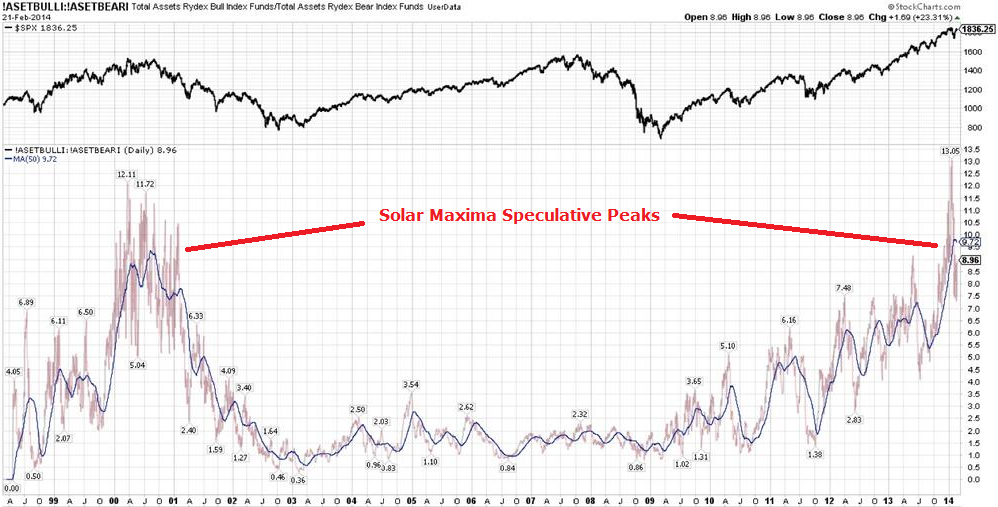 Source: U Karlewitz

Most comprehensive analysis to be found anywhere. Thanks!
Thanks Andre
Though I’m still worried about the new highs of the cumulative A-/D-line and therefore skeptical as to your short term expectations, the weekly $oexa200r (10 and 30 ma, RSI, MACD) is really looking similar to the first weeks of July 2011. One shouldn’t bet on a detailed repetition of history, but the possibility exists, that the indices will retreat and resurge over the next week together with a diverging daily A-/D-line as a prelude to a real crash.
Thanks Theo. I accept the A/D remains a support for the bull case as things stand. As per a previous comment I found two historic Dow tops where the A/D topped out with the market rather than with a leading divergence. Also the A/D also topped out in April 1998, a long time before the actual market top of 2000. So it is not a perfect indicator, and it is the weight of other indicators (including other breadth indicators) that do support a top that makes me think it is going to be anomalous. We’ll see.
John, I’m not dismissing the weight of the indicators, you put together, I rather appreciate your extroardinary efforts and I’m even positioned accordingly. It’s just that I would be more confident, could I only see signs of a topping together.
My work on the period between the middle of 98 and the NAZ top has a different view.. I remember it well because in the first week of March 2000 I told my family and friends this” I am seeing the most extraordinary thing. As the NAZ has gone to the moon, the interest rate sensitive stocks have been selling off for 18 months and are now giving long term buy signals at the same time the NAZ looks insanely over valued…PLEASE … DUMP YOUR TECH STOCKS !and buy stocks like PHM. ALL, NEE..in retrospect within a day or two of the NAZ peak those stocks bottomed and never traded lower….The kindest thing that was said to me, even in my own family, was”You’re an idiot. WHY?!! would anyone want to own those dead money stocks?Subsequently there was a week where the $INDU was up 1700 points while the NAZ was down 1700 points….It was a tough time in my life.. I was as sure as John is now based on my own work: but, the mania was so great that the best I did was save half a persons worth…. most lost 90%.
The moon is closest to earth this year in august. This alone says gravitational pull will increase for the next few months. That is bad for equities. I had a solunar inversion februari 6th; within one day of the start of the uptrend. Next inversion februari 20th, with the moon comming closer; means downtrend. Very possibly friday 21st a top in S&P. Next inversions march 6th and march 20th (equinox).
Volatility in lt uptrend, Yenn in uptrend, aussie in uptrend, Divergencies everywhere you look : s&p, DJ Global, FTSE euro top 100.
So my expectation – for entertainment uses only 😉 – is down into 5/6 march, some recovery into the equinox and after that an more steady down trend into july/august.
This week maybe some retrace from wednesday into the new moon on saterday. But tomorrow will be down.
Just wanted to point out the long term trend in gold miners. In this 75 year chart of miners http://www.bgmi.us/
You will notice:
1. Miners are bottomed out on their long term trend line from 2000
2. Miners where are much safer play in the aftermath of 1980 gold crash. You will notice that gold miners traded in a range from 1980 until 1995. Ultimately meaning that gold miners crashed much less than gold
3. Gold from 1940 to 1992 always made higher lows. The only lower low on chart is year 2000. Which means going lower than 2009 lows is unlikely.
4. Gold miners are priced about the same as 1975, which is astonishing.
5 from 1980 to today gold miners are almost sideways. No major bull above the 1980 highs. Look how gold miners went from 50 in 1965 to almost 1500 in 1980. Nothing like that has happen in the bull that stated in 2000, were not even above 1980 .
Another very long term indicator I am watching is the Coppock Curve which has turned down. According to McClellan “…..To get back up on top of the Coppock Unchanged line and turn up the Coppock Curve, the DJIA would need to close above 16238.07 at the end of February 2014, and that number keeps on rising. ”
Source:
http://www.mcoscillator.com/learning_center/weekly_chart/coppock_curve_turns_down/
John,
In your previous blog you gave a link to a space weather forecast site. This site shows radio flux data. To my amazement this correlates fantastically with the dates I gave above, based on solunar tidal force.
Do I understand correctly that your solar extremes – that you say coïncide with market tops- are extremes in radio flux? Or are there other metrics that measure solar activity?
Hi Andre
Could you please tell us which url shows solunar tidal force and which url shows space weather forecast data from John?
Thanks.
http://www.swpc.noaa.gov/ftpdir/weekly/27DO.txt will show the radio flux.
http://time-price-research-astrofin.blogspot.sg/ will give you the solunar tidal force. This site has lots of content, so scroll down and look for a link i=on the right side.
Have fun,
André
Do you mean this? It’s sunspots if so:

another view supporting John’s work.
http://traderfeed.blogspot.com/2014/02/getting-fresh-perspective-on-stock.html
NYSE Down Volume Index ($NYDNV) MA (10) is showing market top just like early Jan 2014.
John,
Do you have any information on another possible solar peak in 2015?
Dean Pesnell of the Goddard Space Flight Center was a member of the NOAA/NASA Solar Cycle Prediction Panel. He has stated that there may be a similarity between Solar Cycle 24, and Solar Cycle 14, which had a double-peak during the first decade of the 20th century. If so, it is possible that there was one peak in late 2013 but there will be another in 2015.
http://science.nasa.gov/science-news/science-at-nasa/2013/01mar_twinpeaks/
While many current indicators point to a top in the market and an impending downward trend, it is also true that the market never does what is expected. There could be a downward spike followed by yet another market peak later on to coincide with the second solar peak.
Jack
We are about 62 months on this chart now:

Waning more likely.
Thanks for your input all
I had expected a gap down of the cac40 this morning. Instead the index is breaking out of a 4 month range and making new highs. Maybe the breakout will be reversed shortly, otherwise this clearly isn’t consistent with the start of a bearmarket of the main world indices and Nadeem Walayat is right again with his notion, that this is the biggest bull market in history, which is repeatedly proving every bearish expectation wrong, be it founded on 50 indicators or much less.
Walayat is expecting a volatile Dow upswing to new highs by early April and gives a preliminary sell recommendation for May.
This is really getting scary. I think we need a lot more extreme reading before john’s theory plays out.
My feeling is liquidity pumping by central banking has changed everything.
John – Are you still sticking with March 3rd decline or do you plan to exit and re-short at higher level.
Wave counts suggest this was 5 waves up for “a”, a pullback for “b”, then more up for “c”, so a pullback to early March may suggest another leg up into mid to late March…
Cycles suggest NDX still not complete on it’s move up….
It’s just another manic Monday, which Bob Geldof has also asked about many times. And that puts a date to ponder. The more, the more-ier, eh Bob?
Meanwhile we continue to support our local drug trade. So what? So who?
Offshore Brit Tax havens rule! OK! Keep those mindless algos busy. We will be unavailable if u need us. Say what? Tuff
I suspect we may see 1950-1970 on the SPX before we have a more meaningful top, but that is only a few% away. You have to bear in mind the psychology of the “dumb money”, who have been buying the expected dip….
imho
J
I see the volume differently. Chart from the weekend.
http://www.directupload.net/file/d/3541/qofpwkag_jpg.htm
Whoa, the NYSE McClelland oscillator (MO) gave a sell signal Thursday which did not work very well. Then the OTC MO gave a triple crown sell Friday. Needless to say, it did not work at all. Markets that ignore sell signals are bullish. This makes me think about a 6-12 month distribution top like 2000. Unless of course, I am completey wrong and this is a secular bull market.
Markets that ignore sell signals are bullish?
I heard the same thing in 2000 and 2007….lol
they are until they aren’t. Generally if a market rallies on bad news, that’s bullish. If it tanks on good news, that’s bearish. We had a sea change in early 2009 when the market stopped declining on bad news. That could happen now in reverse, the market stops rallying on ANY news, good or bad! 🙂 But as long as it continues rallying, especially on BAD news, then how can we say it’s topping and about to fall apart. Odds are that it is, but I wanna see some proof, show me the money!
A good article today on “Greed Turning Losers to Leaders in Russell 1000 Index” on
http://www.bloomberg.com/news/2014-02-24/greed-turning-losers-to-leaders-in-russell-1000-index.html
Not sure why but the Vix did not drop that much compare to the increase of the S&P 500.
all a part of “their” game….VIX will tank in the next week or two and Dow will drop another 200+ before finally relenting…they did this all of last year….
For 30 years i thought elliot wave had no value.Then I had the good luck of watching the work at pugsma… unfortunately i was tossed from site. FOR WHATEVER REASON… he chose to make a public post today with charts showing his two alternatives for the coming top….
http://pugsma.wordpress.com/
two notes… the post was made as the mid day high was being hit… subsequently price sold off more than expected.. if 1846.13 is hit then the count would have to be adjusted.. if 1835.60 is violated then count would have to be rethought.
at the high, short term traders bought the inverse SPXS at the weekly s2 to the penny with a very tight stop and the level held. we shall see.
Hope you got a glimpse.: the post was open for a few hours before it was closed.
Just saw this post Slater9.
Slater9, can you please expand on pugsma’s expertise and the EWT? I couldn’t find the public post; it all looked like a sub to me. Thank you for any additional feedback.
John
1848 fails again
Amazing
I have a cit—change in trend due march 6th which happens to be 60 degrees/months (Gann) from the March 2009 lows. looking for 2-27 low first.
http://www.markethighsandlows.com
Something to think about. The pattern on the FTSE since April last year appears to be an ascending triangle continuation. A break above the highs would signal much higher prices with a target above 7.5k
http://stockcharts.com/h-sc/ui?s=$FTSE&p=W&b=5&g=0&id=p59356620384
Just to add. Many indices could be in the process of erasing much of the negative divergence that emerged prior to the January decline.
http://stockcharts.com/h-sc/ui?s=$DAX&p=W&b=5&g=0&id=p63901762210
I made a point last week about smart money and dumb money. This could be just what the big boys want (and have succeeded thus far): to suck in all the retail investors who think the market is going to infinity. The weekly sentiment indicators from Investors Intelligence, MarketVane, the American Association of Individual Investors, and the put call ratio all indicate the smart money is short. Hedge funds are the most short since September 2012. I have sold all of my long positions (except in the metals and miners) and will be going short very soon.
This is a monster bull trap! I’ve seen it so many times before. Market tops and bottoms are formed, and can take weeks or months to complete, as this top is proving to be the case. I find all of John’s analysis and all of his significant number of indicators irrefutable evidence that the top is in!
It’s not that hard. Don’t buy the break, wait for the test and confirnation before buying. Whether that be up OR down 🙂
X-FLARE: Long-lived sunspot AR1967 returned to the Earthside of the sun on Feb. 25th and promptly erupted, producing an X4.9-class solar flare. This is the strongest flare of the year so far and one of the strongest of the current solar cycle. Check http://spaceweather.com for updates about this eruption and the possibility of more to come.
Hi John,
Could you please comment on what that X4.9-class solar flare could mean?
And when?
Thanks
Martin
It wasn’t directed at Earth – just possibility of minor geomagnetic disturbance later today
So this one will not have an impact on your March 3rd call.
Thanks,
Martin