
1. Crestmont P/E valuation only exceeded at 1929 peak and in 2000:
2. CAPE / Shiller PE / PE10 valuation only exceeded in 1901, 1929 and 2000:

3. Compound annual growth rate since 2009 bull start only exceeded into 1929, 1937, 1987 and 2000 peaks:

4. Q ratio valuation at major historic peak levels, barring 2000 outlier:
5. Stock market capitalisation to GDP from Fed data second highest in history:

6. Stock market capitalisation to GDP based on Wiltshire 5000 (the broadest and most comprehensive US index) equal highest in history with 2000:
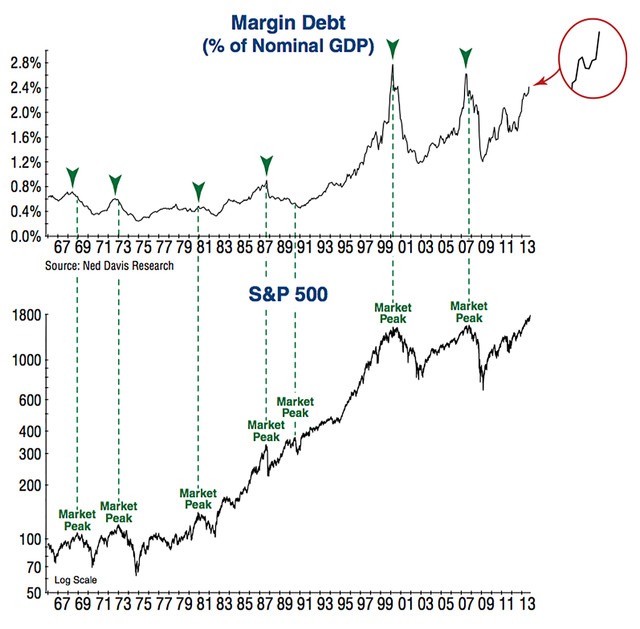
7. Margin debt as a percentage of GDP joint highest in history with 2000 (and net investor credit at all time low):

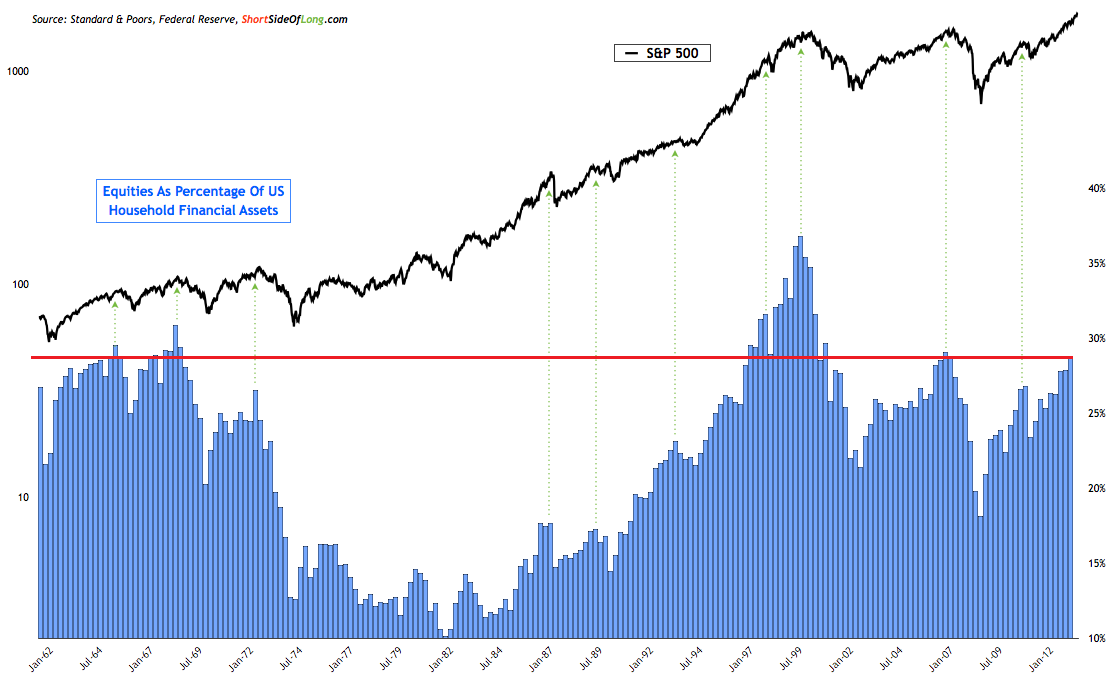
8. US household equities exposure at level of previous major peaks, barring 2000 outlier:
 9. Skew readings cluster highest ever:

10. Panic/Euphoria second highest ever euphoria after 2000:
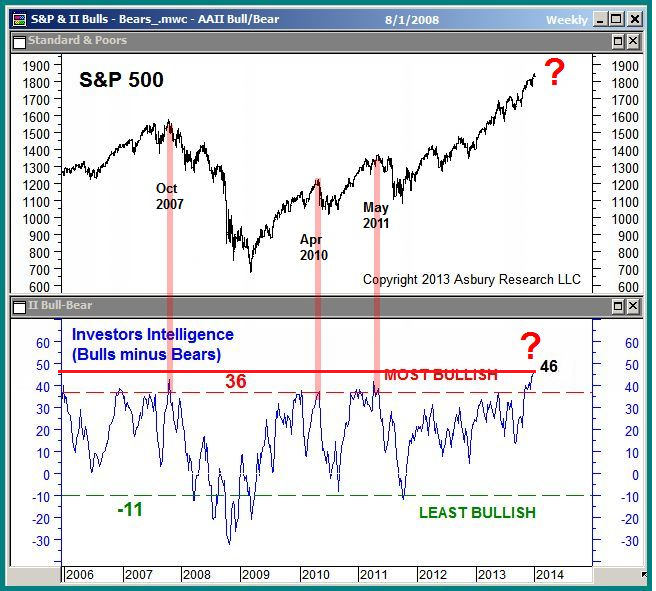
 11. Highest ever Investors Intelligence bull-bear sentiment spread:
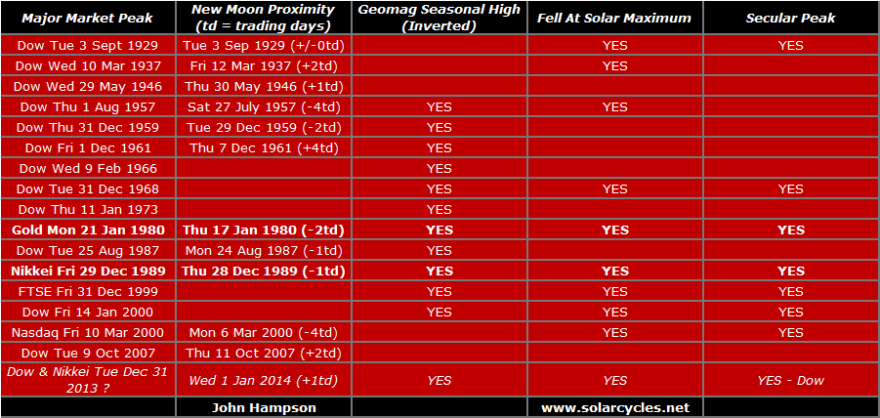
12. Sunspot, geomagnetism and lunar phase potential historic convergence:

Solar maxima deliver speculative peaks but as these peaks in the sun’s activity occur only around every 11 years, we see cyclical market peaks in between. More often than not markets peak in the seasonal (inverted geomagnetism) highs around December and July, and within the month they typically fall close to new moons. If the Dow peaked 31 Dec 2013, the closest parallels as highlighted in the table are 1980 gold and 1989 Nikkei. Both these were secular peaks occuring at a solar maximum, at the turn of the year and close to a new moon. The Nikkei is particularly pertinent as it peaked on the last trading day of the year and led Japan into a period of deflation, which I believe awaits the US now. US deflationary recessionary demographics should break the Dow out of a very long secular run that has been in place from the 1940s to now.
If the Dow and Nikkei did not peak on 31 Dec 2013, then the next new moon would be 1 March 2014, by which those indices would need to be at new highs. However, by that point we have moved into the (geomag-inverted) seasonal lows, and, based on current solar forecasts, gradually away from the solar maximum. The caveat to that latter point is if solar forecasts are wrong and we see a stronger sun in the weeks or even months ahead, making for a higher cluster of sunspot spikes. We might then look to the next seasonal high period of June-August and future new moons in looking at top-timing probabilities (note probabilities, as the table shows exceptions). However, the stronger case is for the 31 Dec 2013 top, and the evidence that has built up since then is supportive, including January spikes in trading volume and insider selling, 2014 money flows into treasuries, gold and defensive sectors and a downtrend in economic surprises. The last piece of the puzzle is for price to now confirm, with the Dow rolling over again this week, and in doing so adding a lower high to the Jan/Feb lower low, marking a trend change. Prices on the US indices hit technical targets on Friday, and volume for the rally remained divergent, setting up that roll over potential. We had a geomagnetic storm for the second weekend in a row too. However, we are clearly very delicately poised: either a definitive bullish breakout (with bullish internals) from here postpones a market top into the future, or we are at the top of the ‘second chance’ and staring at a major bearish opportunity.

TRAN very weak this morning.
http://bbs.cobrasmarketview.com/download/file.php?id=59872&mode=view
Thanks. Ended weak too, contrasting with small caps having a strong day. A doji on the main indices, which is in line with expectations of a gradual roll over this week, but subject to follow through. Otherwise same story as last week: poor economic data, poor volume, money flows continue into safe havens.
An interesting aspect of several of the charts is after hitting all time high over valuation, etc and crashing, they have now rallied back to what had previously been all time high extremes (before 2000 and 2007). So what is it waiting on? We seem to have become so accustomed to abnormal that this abnormal bubble world is the “new” normal.
My views. Solar max inspired speculative excess one reason for current larger highs. But long secular bear in progress since 2000 looking out to circa 2025 which will eventually see wash out to historic low extremes. No new norm in valuation levels, just gradually working our way down from the biggest excess in history.
Have you considered modeling the ‘crash’ pattern from the Jan. 15th highs instead of the Dec. 31st highs? That would push the second chance top to the coming Friday or Monday, and the low would be Mar. 13-14th. Which is a date that has a lot of timing significance.
Thanks for the idea. There are other alternatives too, but I’d rather wait for my primary to be invalidated before doing so, as I have a multi-angled case for it.
I urge traders to not forget John’s longs in the ag etf’s. It is my opinion backed by a techncal buy signal at lows that in retrospect this will be the trade of the year.
Thanks
Hi John,
Another great post! Thanks.
In the first chart, you mention that the current PE valuations were exceeded only at 2 other times: 1929 and 2000. However, a closer look at the chart reveals that the current PE valuation was exceeded in 1997 or 1998 and continued higher for 2 to 3 years into the 2000 top. So even though valuations are high, we could see stocks continue the bull run for another year or two. As traders/investors we have to be prepared for stocks continuing the bull run for another year or two, as well as being prepared for a new bear market. Quite the dilemma, eh?
Another point: Bonds yields are at historic lows and are certainly one of the causes (the primary cause?) of the run up in stocks. What were bond yields doing in 1998-2000, the one time in recent history when PE valuations were at these levels?
3 ingredients for a superpeak: (1) solar maximum inspired speculative extreme (2) increasing pool of buyers (3) increasing leverage amongst buyers
Into 2000 we had all three, this time we are lacking (2) because demographic trends are down. The demographic swell peaked into 2000. We see leverage now at the same levels as the 2000 peak, i.e. at the limit. We see other evidence of ‘all in’ through record sentiment, putcall, fund flows etc. With a shrinking rather than growing demographic pool we can’t ponzi-scheme it higher. It is for these reasons I don’t believe the markets can extend longer or higher.
Regarding point 2. In the 1980s bond yields were historically high, twice the yield of stocks. So for no risk people could choose bonds over stocks. Yet stocks outperformed because they began from low valuations. Today stocks are paying a higher yield than bonds, but stocks are at high valuations, and I believe that will trump once again – they will be sold down to mean reversion.
Thanks, John!
I have not been shocked or even very concerned by the otherwise amazing charts and indicators and what they appear to be warning about.
A quick self interrogation about this apparent malaise produces subliminal surfacing…(for further evaluation)
High speed trading computer programmers would seem to be less interested in indicators than their (manual system decision makers) predecessors were.
Guessing the next moves with the various central bank interventions seems to be the primary influence for those less up-to-speed (and thereby less competitive players). Access to copious amounts of margin at low interest and high leverage are seeming essentials. For these participants, that now form the bulk of the speculative play, the profits depend on competitive speed and algorithmic designs. The array of financial instruments makes economic activity fairly irrelevant for the bottom line.
Indicators going where they have never been before is not raising high level alarms. The bottom line for the major players involves other things of greater influence to concern.
It would appear that the world has been doing that changing thing and some newer dots need connecting.
Another symptom of new norm-itis is that industrial needs for capital is up to industrialists to provide for themselves.
(And it also appears that Big Brother has got great grandchildren on the way)
For what its worth.
Avid
Thanks, the role of HFT and algo-trading is important, and they may increasingly skew near term market moves. I don’t believe they are so influential in the bigger/longer picture.
Hi John
I really enjoy your posts and look forward to each new insight.
Any thoughts about the Puetz window coming up in April? Particularly Monday, April 14. I think 55days prior would be tomorrow or Thursday.
Maybe the 12/31/13 high stays and 55 days later gets us to next Monday.
Thanks. Someone else mentioned Puetz and I said I gave up following those windows as they were too hit and miss. But I will have another look at some point, as it’s lunar/solar based.
Hi John, sentiment on the II measure is actually nowhere near its all-time high. While the recent gap between bulls and bears of of 46.4 is the biggest on your 10-year chart here, the reading hit 75.0 in late 1976. It has been above 50 on numerous other occasions.
Thanks for the correction. It is higher than 96% of historical data points. NAAIM sentiment reached higher than 98% of historical data points. Put/call ratio reached lower than 97% of historical data points. Extreme enough.
OK, it was the 3-week average of the bull bear spread that hit an all time record.
Hi John, I’m not sure that the 3-week average changes anything. On that basis, the reading was still higher in 1976, as well as in 1986, 1965 and 1971, to name a few…
Yes, of course, but not in the current 17-years cycle, you can see in 1999, 2007 and now. It is not accurate, but is a real clue to see a top around.
And othe question is to observe and compare 2002-2007 Investors Intellligence structure chart and current one.
You could see the similarities-analogies, that allows a big decline on the way.
Regards.
@apanalis
Another geomagnetic storm in progress. The third in the last week and a half.
When the P/E was 13 in 2009/10 why were there still permabears saying this market was going to crash down? Basically they gutted employees to bring back earning to normalcy and used QE for financial engineering on their books and are now peaking at corporate buybacks which helps P/E, but it did have to come back somehow. So why wasn’t everyone saying let’s get on the bull train till its gets toppy again?
A number of skilled traders were saying just that…
Hi John,
Again I read your posts and again I feel I must express my skepticism. Not on your technical analysis, which is great, but on whether the markets actually act rationally (which, most of the times, they don’t). The problem is, Wall Street history is FULL of market gurus presenting very compelling evidence that we’re on the verge of a downturn… which never came, or, at best was but some sort of correction before the markets soared to yet higher ground (remember Robert Prechter calling for a major market top in… 1995?). Have you considered that this whole downturn since the beginning of the year might be just another consolidation period before reaching new highs? Sure, it would be irrational… but it would be far from the first time that markets acted irrationaly 🙂
The markets can remain irrational longer than you can remain solvent…lol
John,
ES and Nasdaq both reached higher high. With so much liquidity around does it concern you. Your concern might be correct but downturn can come from a higher point.
Hi Guys
In my last comment a while back I suggested that John’s red flags are indeed valid and that it was right to be short at the beginning of the year. I bought my bears back a week or two ago because I also pointed out that the second term of Obamas presidency will most likely have a greater upward pressure than the first term, but the general shape of the cycle would most likely be similar. Therefore, the most likely common analogue is 2010 – but with a weaker downward swing.
So far this has proven to be about right. The fall at the start of 2010 was greater that this recent fall. Doing a back of a cigarette packet calculation suggests that a high around 1950 sometime from March into early April seems about right.
That would push sentiment to further extremes and form a nice price distribution to fall back into and trade through quite quickly.
With indicators at such over bullish extremes it is not impossible that the market will fall further than one would think but statistically the most likely time that a true crash occurs is in the second half of year 3/7…..ie next year. That said I will be opening my bear up over the next few weeks again as I believe after this short period of bear closing a consolidation or fall is due and who knows what level we will get to.
Will
My 2 cents… We live on such a thin veneer of civility. I live in one of the top ten per capita income zip codes in U.S .. yet six miles in one direction is an area where the Mexican mafia drug cartel owns 90 % of the houses and ten miles in other direction is a neighborhood where less than 3% of the houses are occupied….. To me trading is a game to be played well or poorly;and as long as the real world does not intervene the game goes on…It is my thought that the real world of food and water will intervene later this year and the civility will break down and the last concern on my list will be the trading game.
The 1929 fractal. From the top to the second chance top was 34 trading days. Today is the 34th day from the recent top in the Dow.
Citi economic surprise indicator takes a plunge into the negative ……and housing starts plunged also….
Mean aversion…. going to happen this time?
Baby steps sell signals start to show up …first time since Feb 13th.
http://blogs.marketwatch.com/thetell/2014/02/19/citi-economic-surprise-indicator-takes-a-plunge-into-the-negative/?mod=MW_home_latest_news.
China PMI data just released. Should we say “Soft Patch”…
Think on some charts instead of a percent of GDP, it would be good to say percent of percent of GDP to M2 or M3. Think comparing to just percent of GDP is not accurate and throwing things off given the increases in monetary supply between 2000 and 2014. This may be key to comparing now versus then. Found another Bradley site, 2015 and 2016 seem to be “different” patterns then what I’m used to seeing for other years and when compared to 2000 and 2001 also eerily have a different wobble.
An oldie; but goodie by Charles Nenner. Sunspots discussed briefly beginning at 22:23.
http://charlesnenner.com/faq.php#
Thank you all, and to answer a couple of points: don’t trust me, trust the evidence. The reason I am so confident is the multi-angled, multi-layered, comprehensive case, which doesn’t really need my opinion adding to it. If the top has not already occurred then it will not be far away either in price or time.