
A pick up in China looks likely into year end, both in the stock market and economy.
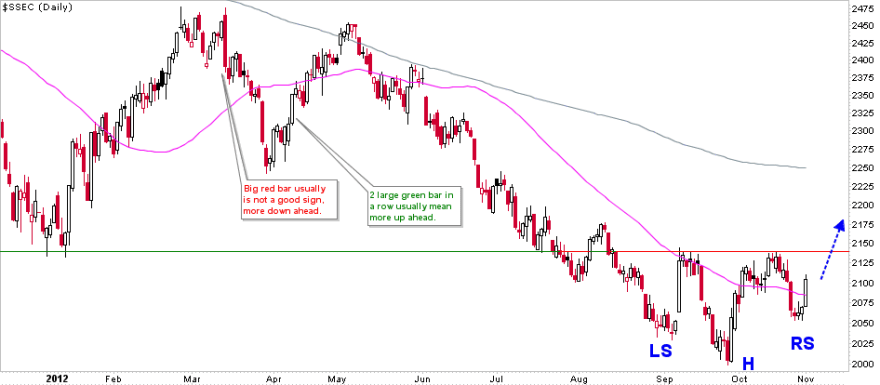
On the weekly and daily views, the Shanghai Composite looks to be basing for an up-move.

 Source both: Cobra / Stockcharts
It is doing so on a p/e valuation of just 7.8, which is historic extreme cheapness.
Meanwhile, the Hang Seng broke out of its long term triangle and has advanced away from the breakout, which further bodes well for Chinese equities.
China PMI has pushed back up recently, which as a leading indicator suggests an upturn in the economy ahead, even if only short lived rather than enduring.
 Source: Ed Yardeni
And the Chinese National Bureau Of Statistics leading indicator suggests an uptick in GDP growth is likely.

I maintain that strength in China is important to fulfill a secular commodities finale next year, due to China’s role as the world’s largest aggregate commodity demand source. Now let’s see whether this improvement in China is mere counter trend respite and stabilisation or a move that gathers momentum, but given the Chinese central bank pumped the equivalent of $50bn into the economy on Sep 25 and another $42bn on Oct 9, there is the potential for a period of reasonable strength.

Have placed an order to open on Morgan Stanley China A fund ETF, which is a fairly broad based closer tracker of the Shanghai composite than some of the other China ETFs. Like Nikkei, looking longer term, buying at low valuation.
I’ve owned CAF a few times. Being a closed end fund the NAV fluctuates and is very (for me at least) unpredictable. The NAV can hurt or reward regardless of the underlying rising or falling.
I have the more comfortably boring FXI now. Will sell if Romney wins, add if he loses.
OK thanks
I was sitting and wondering how to buy the Shanghai Composite and you kindly post the answer.Thank you.
You’re welcome.
John, what are your thoughts on the slew of inflows into fixed income? I am not simply speaking of US treasuries or even US IG corporates and HY corporates, but across the global spectrum. From the “risk free” sovereigns to the high yield sov’s I am seeing outflows (or much smaller inflows) in equities on a global scale relative to fixed income flows.
I do not deem this (obviously) as a safe haven trade because not all flows are going that route, but why into these riskier bonds relative to equities? And this is not retail money obviously, this is institutional money.
Loss of faith in equities that characterises the end of a secular bear market.
True, however in the US that comes with fundamentals of a 5 pe, slightly below book, and a yield around 6%. China is communists, remember the communist principle, if it benefits communism, it is true. This is the month one year ago that the Newweek/Time cover was the China Bubble. I interpreted that as like most covers like that it would presage the collapse one year later. So far, the direction has been correct, but the interpretation is the slow down is almost over. There seem to be a very few, but prominent China Bears, but the vast majority are bullish. After a multi-year bear that is rather amazing. The real estate bubble after the mkt peak may explain that.
Who here actually believes Chinese growth and PMI figures? I rather believe in Santa Claus as we approach December!
You are wrong Tiho! China is growing! They are growing one… BIG… bubble…
So much bashing of China….Hmmmm. I take Tiho’s cynical remark as a BUY SIGNAL.
I just bought CAF for the long haul. I love this betting game…HeHA!
What’s a long haul for a trader? 3 weeks? *smile*
I remember about 2yrs ago about how they tightened policy because the inflation caused by the 2009 growth spurt had gotten out of hand. It’s fascinating how we’ve got to the easing point in the economic cycle. Easing has been in action in China for at least a year, so growth should have jumped by late 2013.
Jim Puplava is now pumping PEAK GOLD like he did with OIL…..Gold’s bull run is late stage.
Gold is waiting for the right moment. The 2011-12 correction in Gold looks remarklably like what happened to the FTSE 100 back in 1994, when the bond market crashed. It dropped by almost 20%, then formed a rounded bottom before surging by 100% to reach the peak of the dotcom bubble.
When gold surges, the rally lasts no more than 2yrs normally. For example, 1973-1975, 1978-1980, 2006-2008 and 2009-2011. My guess is that by early to mid 2015 we’ll have seen the peak of the gold price. If Obama wins in 2012, gold will most likely rally, but if Romney wins, it will probably start crashing.
As for stocks right now, my guess is that if Obama wins the US election, stocks will most likely jump upwards, since Obama’s presidency has seen more dovish moves, to encourage inflation, whilst I get the impression Romney would usher in policies which would encourage deflation, through fiscal austerity. QE3 in the US is already underway, so we’ll start to see certain assets rally in the next 6 months or so, unless a black swan event happens.
Hi pete
It does not matter who wins. Stocks will go up.
Explain.
The other Bob (Prechter) would probably comment “How dare the market goes up when the Social Mood is sour!”.
It almost certainly matters who wins this election, this Romnesia phenomenon is catching on, and people are refusing to believe their vote will change anything. This election is special, like every election, because Democrats and Republicans, despite being similar, have vastly different economic policies.
Romney/Ryan are planning to actually pursue an austerity drive, and seem less likely to continue QE. Romney is also more likely to appoint a more hawkish Fed chairman when Bernanke steps down in January 2014. Austerity will lead to a slower rate of GDP growth, and demand for commodities like oil will fall. Stocks will probably drop from November onwards if Romney wins. Just look at how the FTSE 100 fared compared to the Dow between 2010 and 2012.
Since the austerity began in the UK, the FTSE has been range bound for the last 2-3yrs, whilst the Dow has soared 20% or more. I imagine the Dow will become frozen in a rigid price level if austerity from Romney and Ryan wins the day.
Obama initiated the 2009 stimulus package, and has allowed 3 rounds of QE since 2009. He seems to support a more dovish approach, and if he wins, a rally will most likely occur from November, into early 2013.
Stock market may rise through a white swan event. For example, after President Obama is reelected, the opposition party may decide in a lame duck session to compromise about the looming fiscal cliff because there is no further need to oppose the president’s reelection. Several predictive charts like the Euro COT appear to indicate a downtrend to around Nov 8 but then a rise to end of November. Who knows what will really happen.
What has happened to all the Copper bulls from early September? If Chinese economy was truely in a recovering mode, we wouldn’t have falling Copper and Crude prices like we do over the last few weeks. China is a key marginal consumer of all industrial commodities.
We appear to be at a major juncture. Oil and copper look like they are on the verge of major breakdowns. Of course, if we are still in a secular commodity bull as John thinks, that is right where big runs start just after they run all the bull’s stop before the rally.
My guess is the weakness in Copper and oil is down to fears of the US slowing down getting more coverage than the gradual recovery of China in recent months. Right now, the Chinese political elite are choosing their next leader as in the US, nobody knows who will be in charge of the world’s largest economy.
Election days have proven to be bad periods for markets these days. The crashes in May 2010 and May 2012 are an example of how European elections have gone down globally. Once the results are through and we know who will be in charge, the markets will have a clear direction to go in. In China’s case, a recovery is assured since the Communists will still have control by the end of the transition period, but in the US, it could go 2 ways: deflationary austerity or inflationary dovish policies. 3 days until we find out what the latter situation will be!
The only difference between the Republicans and the Democratics is SOCIAL policy……. giving more to the “have nots”.And the “have nots” dont buy the S & P.
The wars will still continue. Support for Israel is the same.US allies are the same.Nato is the same .Iran policy is the same
What Romney will do is change some of those handouts like Health Care. Thats how far the austerity will go.So it doesn’t matter who wins….stocks will go up.
And just to add more fuel … unfortunately Obama will win.
Up?
Pete – I don’t think the US, EU or JPN economies really moves the price of Oil. Western world was booming during 1990s and Oil price remained flat. The old world, as Ed Yardeni calls it, compromises of US, EU and JPN and their cumulative demand for Oil has actually decreased since 2005 (chart here). They have become almost irrelevant in the energy market of the future.
What matters is Emerging economies like Asia and latin America. They have becomes the marginal consumers of Crude Oil (and other commodities) globally.
Here, the dominant factor is China and its appetite for energy as it expands from a third world country few decades ago into a developed country in the coming decades ahead. Furthermore, price of Copper doesn’t really decline because of EU Debt Crisis or Greek problems. Here too, Emerging economies consume the largest part of supply (chart here). China is once again the main player in the Copper market, consuming almost 40% of total production. Asia as a whole consumes almost two thirds of global Copper. Once again, US and US aren’t really the important factor.
Therefore, I’d like to think that the current fall in price of Crude Oil or Copper has absolutely nothing to do with US, Eurozone, Obama / Romney elections, Greek debt, EU banks, Spanish unemployment or any other non-sense excuse the media makes up. Contrary to all of that, the main driving factor most likely must be Asian demand to process raw materials into exportable goods and China in particular, who is both a strong exporter as well as an importer of raw materials / export goods out of EU / Japan etc etc.
You can print money, try to reflate by force and try to stimulate demand, but that will not last unless you have real economic activity which drives underlying demand in the first place. In other words, QE3 cannot force Taiwan to produce more goods and try to increase their exports to China. QE3 cannot force Japanese carmakers to increase demand of raw materials used to make vehicles, if the underlying demand for these goods is not present globally.
Bernanke is trying his best, because he has no other tools left, but that won’t stop us from sliding into a recession. Bernanke himself admits that money printing or QE as he calls it, is not the panacea nor a solution to the current problems of weak global demand.
I am a believer that Asia is slowing, just like the whole world, and that is the reason for the falls in industrial commodities. Here is what I said on this blog two months ago as many traders were running around like headless chooks claiming we had breakouts in Copper, Crude, S&P, DAX etc:
“Tiho September 6, 2012
The difference is that you must believe everything central banks promise you. According to that theory, all we had to do over the last century, since the Fed was introduced in 1913, was to print money and we would have NEVER had even one recession or crisis. I don’t believe in fairy tale stories, but I did when I was a little kid.”
QE-phoria and Super Mario’s comments got the better of traders clear thinking process only a few weeks ago, so they got swept up with a mob! In the end market prices of assets are driven by underlaying fundamentals of demand and supply. If demand falls and supply increases, you will see in the price (eventually).
Side note: Market is not always perfect either, as humans sometimes tend to turn price dynamics into emotional bubbles, but that only ever happens once every 15 to 20 years.
The US Dollar has moved up slightly since mid September, which would explain the drop in Gold and Oil priced in dollars. Obviously, traders are nervous about who will be in charge of the US, so we’ve seen Gold and Oil drop, as well as stocks. which are the big speculation players in the market. Now that the Euro problem has become muted somewhat since the summer, bonds have been relatively flat.
This shows that assets are underperforming in general, due to great uncertainty. Once the results are through and we know who won, the assets will all start upward or downward trajectories. But for now, until the 6th, it’s pointless to try and affirm that one outcome will certainly happen in place of the other. It’s still 50/50.
From Doug Kass today: Scratch off concerns of a “hard landing” in China as Oct Non Mfg Index rose (3.7 to 55.5).Strengthening economy lowers risk of global stall.
I’d also add that a Demark Sequential 13 buy signal on the Shanghai was given in early October. In this video, note the skepticism about the call from Bloomberg’s Pimm Fox:
http://www.bloomberg.com/video/alcoa-slumps-s-p-500-extends-losses-for-fourth-day-3BLMJ8UcSQafqTH3wO4inw.html
folks China had a parabolic top in 2007 and you are looking for a return of a long lasting bull market there only 5 years later? really?
plenty of overhead trendline resistance to boot….
http://stocktwits.com/message/10336129
China’s Shanghai Stock Exchange has gone parabolic before and resumed an uptrend. The final chart on this link shows the SSE has experienced this sort of behaviour before. If we’re comparing how it’s behaving right now to past experience, the 2012 lows are comparable to the 1994 and 2005 lows.
http://astrocycle.net/stocks/shanghai-sse/
That’s a heck of a chart. It’s like having a dot com bubble every five to seven years. Wheee! Will FXI be an adequate proxy for the SSE? Looks like some cheap 3500 calls with a 2014 expiration should work.
sorry, it’s never had a parabolic run like that in the past (ie., 2007’s top)…that Pete was a classic bubble, and again, looking for a resumption of the same type of run only 5 yrs later is without historic comparison.
Hi John. I have made a page for sunspot cycle forecast
http://www.sibet.org/solar/index.html
John, You will notice that in the commodity bull market peaks in 1950 and 1980, that at the same time stocks were breaking out to new highs. This is another indicator that the commodity bull market is not over and that markets are behaving exactly as other cycles. I’m in full agreement that commodity/solar peak ahead with completion by 2015 and a new stock bull market from 2015 forward. My opinion would change if Dow broke through 14,500 (without commodities rallying) which would mean the commodity bull ended in the 2011 peak.
-Justin
There’s always a delay between the peak in solar cycles and the peak in the leading asset of the time. Monthly sunspots peaked in September 1979, but Gold carried on shooting up until January, so a full 4 months difference. With the 2000 peak, it’s different, as sunspots peaked in June and November 1999, and a higher high in July 2000, months after the tech bubble burst.
This makes it all the more important to get it right, just because sunspots haven’t peaked yet doesn’t mean a major secular peak hasn’t occurred. If sunspots peak in October 2013, exiting Gold would be wise from June 2013, but if assets peak after sunspot peaks, early 2014 is the time to get out of the gold market before it blows.
hi Pete
My analysis on DOW shows that the top can be ~12 months before solar cycle max, but the normal is in the last 0-6 months before maximum.
However this analysis has its own defenition of solar max, and may differ from the official maximum.
My projection of solar cycle 24 suggest a maximum in the fall of 2013. I expect peaks around July 2013 and February 2014, and my maximum may be somewhere in that interval.
So DOW may have peaked here ~12months before maximum, but more normal would be sometime in the second half of 2013.
tried to put my solar cycle 24 forecast into my scenarios/indicators for DOW, and that gave me some surprises. The bias is now for a bullmarked top a bit earlier than expected. Looks like March-April 2013 is the favorable top… at worst a lower shoulder…
Its been a while since last death cross in 50/200MA, and a long bullmarked above 35monthMA. Some indicators has to be reset, and that favors another ~15% decline or worse in DOW
Excellent comments, input and links – thank you all. Will address some of them in today’s post.