
This is my pattern and projection for the global secular stocks bear market and its conclusion, based on solar/secular history:

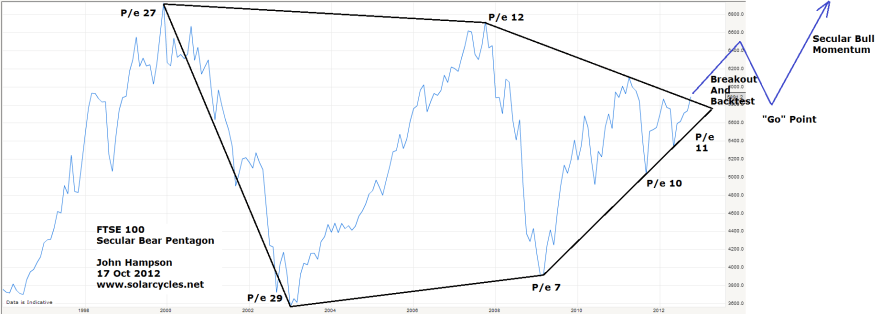
That secular bear pentagon is present in the individual main country stock indices. Here is the current UK FTSE and my projection (click for larger):

Here is the German Dax:
 Moving to Asia, here is the Japanese Nikkei:

Here is the Hong Kong Hang Seng:

Moving to the US, here is the SP500:

And lastly the Dow Jones:

So, my projection for all the indices is an approximation of that shown on the MSCI world stock index and the FTSE index charts at the top, namely a breakout upwards out of the pentagon into 2013, followed by a giving back of those gains and a retreat to the pentagon nose price level 2013-2014 (leading into and out of a mild recession), followed by a momentum take-off in a new secular bull market as of 2014/15. The US stock indices have led the way out of the pentagon, with the German and Hong Kong indices are now attempting to break out also.
I have added the price/earnings valuations of the indices at the key highs and lows. There is a theme of p/e valuations declining over the secular period, which is consistent with normal secular bear progress. It is inflation that makes secular bears track overall sideways rather than downwards, but progress in p/es reveals the true decline in stocks from expensive to cheap.
Secular bear history dating back into the last century reveals that stocks become a long term buy once they hit single digit p/es. In the secular bear to date, all the indices above have hit single digit p/es for a period, except the Nikkei. Despite falling the farthest in terms of valuation from its peak, the Japan index has only just lately come back to fair value when compared to the other country indices, and accordingly has the sorriest looking chart.
In the secular bear of the 1970s, the Dow Jones hit p/e 7 at its lowest valuation. In the secular bear of the 1940s, the Dow Jones hit p/e 9 at its lowest valuation. I suggest there is a reason why that stock index was bought up at a higher bottoming valuation in the 1940s than in the 1970s: the difference in secular yields/rates. Whilst the 1970s mirrors the 2000s in terms of a secular commodities bull and secular stocks bear, the 1940s is our closest match historically as it is both those but also a secular bonds bull. The 1970s was a secular bonds bear. It makes an important difference, in that equities are more attractive relative to other assets when bond yields and rates are ultra low. These next two charts show how stocks have now moved to relative extreme value versus treasury bonds and corporate bonds by dividend yields.


With both types of bonds paying negligible or negative real yields, the relative attractiveness of equities in that environment becomes that much greater. It is the pessimism that characterises the end phase of a secular stocks bear that is keeping money parked in bonds, but once confidence grows in economic outcomes, money should flow the other way. I am suggesting that stocks could bottom at a 1940s style p/e 9 rather than a 1970s style p/e 7 in this environment because of the additional value provided by dividend yields over and above treasury and corporate bonds and the relative attractiveness of true yielding assets in a negligible interest rates environment (rather than a high interest rates environment like the 1970s).
Solar and secular history predicts an inflationary finale in 2013, which if stocks went nowhere (nominally) would reduce p/e valuations further. I therefore expect that my projection of stocks breaking out and then returning to that kind of nominal level perhaps 18 months hence will see the indices largely breaking beneath 10 into single digit p/es at the ‘go’ point. The US indices, currently the most expensive, would be unlikely to make single digits unless they fell harder than the rest. However, not all indices made single digits at the end of the last secular bear – the Nikkei, for example, ended at p/e 20. The US stock indices have both hit p/e 9 in this secular bear already however, and that is comparable to the bottoming valuation of the 1940s secular bear. In support of this, it can be seen that the German Dax has been bought up each of the three times it hit p/e 9, in 2003, 2009 and 2011.

Very good macro economics here John. Long term equity/ bond ratio has turned up.Good point about inflation and the boyance of the bear.
Thanks
Good stuff John. Thank you.
Cheers
John,
the Ftsi has not been higher than 6000 since 2005 do you think it will break this resistance line, Thanks Tony
It’s been higher than that since 2005, but if you mean the 6000 that it has been battling the last couple of years, then yes I expect it to break above soon.
thanks John
I think it will smash through 6,000 by the end of this month or mid November at the latest.
Is there anyone who disagrees at all or is everyone just long? Haha! Well… I’ll take the other side here as everyone (apart from Antonio) seem to see limited downside for stocks and “bullish break outs”.
My view is that we are headed for a global recession and a major bear market post US elections. Get ready for Eurozone Crisis finale!
When we are heading into a global recession we will see leading indicators trending down, and when we are moving into a new cyclical bear we will see cyclical bull topping indicators. Neither apply currently, so I stay long.
I will cover off some of the areas that we disagree on, in the next post.
Leading indicators you follow, like the Confernce Board and ECRI are pointless majority of the time. They are jus cumulative readings of the stock market and credit spreads, plus some other stuff. And they are delayed by a week or so, so what’s the point? You might as well jus follow the stock market.
You will notice that when stocks turn down, ECRI and Conference Board also turns down. Might as well jus follow the market…
Which indicators?, I see a lot of fundamental charts, and most of them are delayed, you can see in the most recent past (2007-2009): economic suprise, CPI, PPI, Employment, ODCE, Industrial production, Leading Indicator, they are lagging indicators.
Take CB leading indicators. This is what they comprise:
Average weekly hours, manufacturing
Average weekly initial claims for unemployment insurance
Manufacturers’ new orders, consumer goods and materials
ISM Index of New Orders
Manufacturers’ new orders, nondefense capital goods excluding aircraft orders
Building permits, new private housing units
Stock prices, 500 common stocks
Leading Credit Index™
Interest rate spread, 10-year Treasury bonds less federal funds
Average consumer expectations for business conditions
And this is how they predict recessions:
If you think they are useless, then too bad.
Hi Tiho.
The key point is that no one knows do they! I expect a nasty sell off but will this come immediately after the US election or after a euphoric rally? What will be the catalyst? My own view is that positive earnings are keeping markets up but after that we may have a sell off until we get more fundamental news based on earnings in Q1, perhaps a similar scenario to 2008/9. But half of me thinks a similar sell off to 2008 is too simplistic given the events of 2008 were historic and will not be repeated with Euro countries.
Earnings thus far are unimpressive but overall beating expectations. 0.25% earnings growth after the first 60 or so companies to report, versus expectations of an overall shrinkage.
Hi John � I thought I’d copy you in on a post I made to a buddy I “chat” with on a private BB. He sent me�a copy of Benner’s work. There is no need for comment, but I though you might find it interesting � All the best. � Rick � � � � Thanks for the email Kerry. � Yes, I had come accross Benner’s working in Frost and Prechter’s: “Elliott Wave Principle…” But it makes for interesting reading nonetheless. � Have a look at this: http://www.davidmcminn.com/pages/brenfib.htm � Extracts: � “Causal Mechanisms � According to Benner, “the cause producing the periodicity and length of these cycles may be found in our solar system”. “It may be a meteorological fact that Jupiter is the ruling element in our price cycles of natural productions; while also it may be suggested that Saturn exerts an influence regulating the cycles in manufacture and trade”. Additionally, Uranus and Neptune “may send forth an electric influence affecting Jupiter, Saturn and, in turn, the Earth”. “When certain combinations are ascertained which produce one legitimate invariable manifestation from an analysis of the operations of the combined solar system, we may be enabled to discover the cause producing our price cycles, and the length of their duration. Benner never fully explained the basis of his cycle, but he did make a connection through the weather and climate, suggesting he was aware of the earlier work on sunspots by Jevons, Herschel and others.� � The Sun, The Moon & The Number 56 showed that the 9/56 year panic cycle arises from cycles of the Moon and Sun. Given the links between the Benner and the 9/56 year cycles, it could be reasonably postulated that both are based on lunisolar cycles. Hard evidence of a sunspot or planetary influence in financial markets has failed to be established, despite a tremendous level of research. Thus, Benner’s view of sunspots and/or planets influencing the timing of his cycles cannot be supported.” � I think John Hampson would (rightly IMHO) ake exeption to the last two sentences! I’m going to send him this post for comment. � Also note the author’s conclusions: � “Conclusions � The 8-9-10 year and the 16-18-20 year cycles are based on the interval of 9 years and its regular deviations. This is quite amazing as they have been so relevant in stock market trends during the 20th century. The three 54 year cycles, proposed by both Benner and Frost, may be directly linked to the 9/56 year panic cycle (see Tables A & B, Appendix 1). As noted by David McMinn (2004), the 9/56 year cycle only correlated with the timing of financial crises. Something similar could not be confirmed for the timing of peaks and troughs in financial activity. Thus these findings on the 8-9-10 year cycle are very interesting, as they may provide clues on the timing of peaks and troughs in financial markets. If the Benner – Fibonacci cycle holds up to critical assessment, it may offer theoretical support for the use of these numbers in financial forecasting. It is debatable whether the Fibonacci numbers can be found in markets patterns, as suggested in this paper. This work can be criticised for two reasons: � *�������� The findings are presented selectively and thus are heavily biased. Those series that do not support the Fibonacci hypothesis are ignored. Thus, the Fibonacci series could arise by coincidence alone and thus may not have any true relevance in market trends. *�������� Both highs and lows may appear in a given series, but no explanation can be offered as to why this is so. One could reasonably expect a series to consist of all highs or all lows. Why the peaks and troughs are interchangeable in a particular series cannot be accounted for. � Whether Fibonacci numbers are actually valid in market trends is debatable and more research is required before any firm answer may be given. � It remains to be seen how accurately these 8-9-10 and 16-18-20 year cycles will predict trends into the 21st century. The 9/56 year cycle and presumably the Benner Cycle must change over very long time frames rather remaining fixed. Furthermore, the business cycle has profoundly altered since World War II (Zarnowitz, 1992), with much longer growth periods and brief shallow recessions. With the abandonment of the gold standard in the 1930’s, the US Government has been able to increase money supply continuously over the past 65 years. This has resulted in almost perpetual inflation and altered the periodicity of recessions, which now occur as rare events. A looming financial crisis is also now countered by lowering interest rates and flooding the financial system with money. Even so, the Benner Cycles of 8-9-10 and 16-18-20 years remain of great interest, especially� given Dewey’s comments on their forecasting accuracy. � Copyright. �� 2003. David McMinn. All rights reserved.” � Benner, Kondratieff, Dewey, Puetz (?), Hampson et al are observing the same phenomenon IMHO, but for my book, JH has made the most progress in indentifying the causal factors of the observable cycles, and putting them into a usable longer term trading/ investing model. � All the best � Rick
________________________________
Thanks for that Rick. So many cycles banded about…. some red herrings, and some approximations of the real cycles (which per your comment is about understanding causality). There’s a simple way to assess which cycles are true which I will cover again in the next post.
Do you still subscribe to Puetz and has he remained bearish all this time?
Hi John,
Yes Puetz was bearish all this time. Right now he gave up i believe and removed all “crash warnings” from his website. Its been a year!! for gods sake. crazy.
I´m not in line with Jhon´s scenario. If DOW goes up in new highs, would be the 1st time that ocurs in more than 100 years of 17 years cycle of big roofs.
You can see in 1906-23 period and in 1966-83.
Every 90-100 years DOW has a crash about -90% of its value, and from 1929-32 we are sitting in the 3rd floor like in 06-23, in 1966-83 was the 2nd, and in each one after a big drop about 50% (1914-15/ 1974-75/ 2008-09) there´s a big rebound about 100% in 2-3 years.
That´s has completed in DOW more than enouhg until now and the cycle is slowing, the drop for me is inminent.
If we see new highs in 2013 for me is a big suprise and brake all the structures and rules for more thna 100 years in the Industrials, 300 years and more in the prospections about British index in those days.
Can you show your view on a chart Antonio?
It´s not possible, all I have it is in paper, it´s a long time frame, only you can see it from 1929, but if you go to 1906-23 you can see it, from 1906-to 2013.
06-23 is the 3rd step – from 1835- before the crash of 1929.
2000-2017 3rd step before a new crash?, in 2023+-/ 2030?
Before, 1837, before, 1720-50 (about 300 years), before 1600, an so.
90-100 years a big crash.
about 300 years a big crash, but a new order.
Every 3 steps, new highs a great bubble, depression and -90% in the Index of reference, nowdays DOW JONES.
John,
Your scenario appears to be:
1. breakout upwards out of the pentagon into 2013,
2. giving back of those gains and a retreat to the pentagon nose price level 2013-2014
3. stocks could bottom at a 1940s style p/e 9 ratio
4. followed by a momentum take-off in a new secular bull market as of 2014/15
My question is whether there is another way of predicting the bottom of the stock market decline other than by a p/e 9 ratio? In other words what other predictive methods are there that would pin point a stock market bottom around 2013 – 2014?
Pricewise I believe we may top out around SP500 1600 and then retreat to 1300, based on technicals and history.
Time window based on secular solar history.
Broad single digit p/es.
Bottoming indicators such as Capitulative Breath, extremes in bearish sentiment and oversold.
Bottoming pattern with positive divergences, hammer candle.
Upturn in leading indicators, economic surprises.
That kind of mix.
John,
You forgot to mention that another method to determine the stock market bottom is to read your posts. Really great, clear, concise information. Thanks!!!
Thanks Jack
But leading Indicator tells not all the truth, now, in the chart above you show me -i follow it-, which is the menaning?
We could be in the corner of a recession in US, the 2ndQ, was a weak 1.3%!!, and the earnings of the 3Q , result, losses, except Financials, and not always, and the 4Q?
What a i mean is that, market go ahead, and possibly the Industrials -the Master of the world index- could drop a strech next weeks.
And when the recession start, DOW regressed 15% al least, an so, to reach 30-35%.
Which is why I would always look across multiple indicators and multiple disciplines.
A sharp drop is always possible, but a cyclical bull top should be more predictable.
The Historical charting, i´m repeating- is based on DOW JONES Industrials, we have all the historical series of prices, and before the speculations based in the US economy and befor the British.
Having a nice trip, John?
Regards
Thanks Antonio