
At yesterday’s close, Capitulative Breadth hit 7, so into the 7-10 zone that historically brought about a bottom.
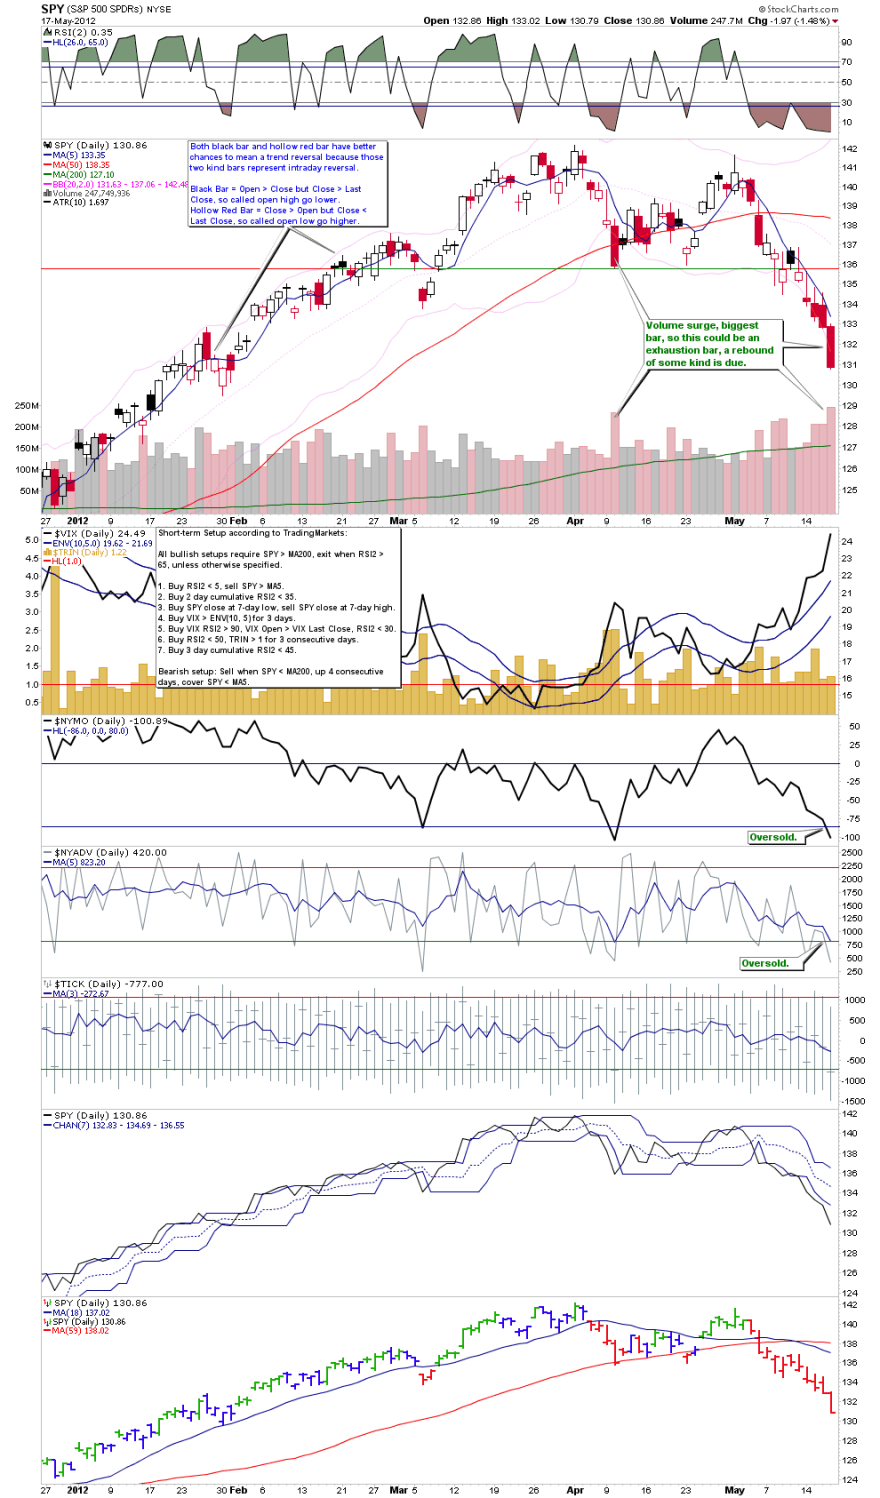
Nymo is into the extreme oversold zone, at -100, and we saw a large daily volume candle yesterday, both signalling a bottom.

Source: Cobra / Stockcharts
This morning in Europe pre markets open, the SP500 and Nasdaq have hit the lower channel lines shown here in Alphahorn’s charts:

Source: Alphahorn
If we don’t bounce today then I suspect we will crash, make a cycle inversion into this weekend’s new moon, and then rally on Monday, but my expectation is rather that we print a daily hammer candle today, from this out-of-hours (for Europe and US) selling, due to the indicators above, and shared yesterday and the day before. I have added to Hang Seng longs this morning, and will buy more pro-risk if we fall further today or even crash. I maintain these are golden opportunities for a significant bounce as we print one oversold or overbearish extreme after another.
On the macro front yesterday, US leading indicators came in at -0.1, but Korea a woeful -1.5. If LIs turn down en masse then the picture changes, so let’s see. US economic data also disappointed yesterday and with Euro CDSs continuing to rise, global government and central bank intervention draws closer, both out of necessity and likelihood.

Hello John, great comment again. Can you tell me where you get your Capitulative Breadth index number from.
Hi Adrian – Rob Hanna at Quantifiable Edges
Dear John,
Based on the premise,buy the new moon and sell the full moon…..in a rising market.
Then do the opposite in a falling market Or is that not the way it works?
Then we should have sold on the 6th May and will cover on the 21st May.
So your oversold indicators are correct.
Kind regards
bob
We typically rise up into and around a new moon, fall down into and around a full moon. So buy the full moon and sell the new moon. But occasionally there is an inversion, for reasons that currently escape me. Let’s see – a large hammer candle today and more upside the start of next week, then the normal would have occurred, at the last minute. Continued downside today and it’d be an inversion.
Morning J and all,
Looking at it from purely a trading perspective for a moment, rather than investing, re my post yesterday a break of the 1320 pushed equities beyond their elastic limit. Hence the pace of the move picked up and we fell another 25 points. Once price breaks out of a bell-curve it rapidly searches for supportive mean reverting orders or explosive stops. If the new area traded is virgin territory then the tendency,even though at times the pace can be fast there is a strong tendency for price to drive and back-test in a healthy way – just as animals would do in uncharted territory. Conversely, when price moves beyond it’s elastic limit, “it’s out of balance”, and it enters a price range that it has traded many times before it has no need to back-test it can just drive.
The area 1160 – 1320 has been traded so many times that the market is in the latter scenario: it is out of balance and will have little need to check itself.
If it can manage to “pull itself back together” by the end of today and get back above 1320 then this might all be a fake – out.
CBI has obviously triggered though Rydex leveraged traders still show no sign of capitulation levels seen last year or 2010. Maybe the US investors don’t think the Euro issues affect them so no need to worry……odd!
I bought some Gold a few days ago, which I will stick with but even though the argument for adding to equities looks compelling the potential downside is surprisingly large. Even though I am normally inclined to stand in front of runaway trains on this occasion I am going to sit and watch a bit longer,even if I miss the best of this one.
John – I feel the 10 year monthly charts on many commodities (CRB, Gasoline, Oil, Platinum, Soyabeans, Wheat) show massive symmetrical triangles, which if they break to the upside, would support your view of a euphoric rise to the 2013 solar cycle peak. Is this part of your view too?
John
Good spot John, that had passed me by. A critical point of either breakup or breakdown. And yes, I of course expect an upwards break and fulfilment.
A similar pattern is appearing in the major stock indexes too – I’ll post the charts to your solar cycles.net email.
John
As always, very insightful.
But let’s get real and talk about Facebook. I suspect this company will soon have the market cap of companies like Apple, Exxon, Nestle, and Microsoft combined. This is a revolutionary company that will bring the retail investor back into the markets and make everything okay again. I expect Facebook to be roughly 20-25% of the World’s GDP by 2015 and 120% by 2020… (that’s my “troll” comment of the week).
In all seriousness, John, would you be a buyer of the euro at these levels? Good support around 1.26-ish, and everyone hates this thing (both verbally and positionally), so I suspect we could revisit the BIS buying level of 1.30 on any positive news such as what Reuters had last night with Greece (Greek people are voting pro-bailout government now). Thoughts?
I am looking to buy some weekly calls in SPY and EEM on Monday (or late today) should we see some positive price action. Yes, we are way oversold, but I (personally) rather take smaller gains when I can confirm a positive price move than trying to catch this “falling knife”.
Thanks.
Facebook has to stay ‘cool’, can’t get too pushy, too intrusive, too commercialised, otherwise there will be a mass exodus to the next orginal social networking twist. Unless of course, it gets so dominant and so central to online life that it becomes indispensible – and maybe it’s there already, I don’t know.
I did consider buying the Euro this week – very tempting with its extremes of oversold and overbearish. But in the end I didn’t, figuring that trade would be an approximation of long stocks, long commodities and short treasuries, all of which I added to, but with the added disadvantage of the political unknown.
Fundamentals really is not so poor to stock.
1. Leading indicator:
Conference Board Leading Index(6 month change) is still above
zero.
Recession alert’s Headwind recesson indicator show low
probability of recession.
ECRI leading index still is above zero.
ISM PMI still is at rising.
2.Liquidity:
Zero rate and negaive real interest rate
3. Inflation
It is moderate for market.
4. Valuaiont
Neutral
All of the above show the cyclical bull still has a way to go, but as you say, politial unkown can break all of the positive force to make the market crash.
Hahahahaha! That troll comment is mad…
Thanks.
If market closed right now the CBI would jump from 7 to 11.
Yes, I’ve added again to the indices longs. Last chance to get in I believe.
John. are you hedged in any way, shape, or form or are you just swinging for the fences here?
We are WAY oversold, but I am not seeing any signs of sellers backing off and driving this down even further.
Some other technical indicators I have seen on some other blogs say the selling has just begun and a return to “even” YTD on the $SPX is in order before any recovery should occur.
Of course, that’s what makes the market, but each day I have seen you say you are adding here. Hopefully with the G8 meetings over the weekend we can get a rebound, but heh, who knows.
I am building into longer term positions, but not trying to pick up the pieces of these dead bulls along the way… at least for now.
That euro long trade… I’ll just hold off on that until a later time. The weekend has my spooked.
Not hedged. Still got plenty of ammo mind. I am a bottom picker, and if you followed me in 2011 I picked them to within a day. We’ll see next week.
John, more of a recent follower but picked up some AUD/USD this evening on an expected bounce in commodities (rather than picking in the futures arena). Your work has definitely helped me more recently therefore I’ll be the follower here.
That’s a massive effort by the underwriters (led by the hapless Morgan Stanley) at the NASDAQ to prop-up Facebook – if it goes down, a lot of retail investors will lose faith in the stock markets…
The retail investor has been liquidating for awhile. I confess I was disappointed to see equities lose 1300 today at the same time the dollar showed significant weakness. I’m assuming the desire not to be long into the weekend overwhelmed what may be positive news coming out of the G-8 meeting.
Look at the capitulative volume:
http://stockcharts.com/public/1684859/chartbook/139439402;
Look at the Nyad, and how the previous such extremes related to bottoms:
http://bbs.cobrasmarketview.com/download/file.php?id=20585&mode=view
Collapsing into the close for a cycle inversion this weekend. I am buying more into the close.
I have added, too. Never easy…
Note……
Thanks Anthony – nice blog theme 😉
Youve got good taste John, i searched through hundreds of themes.