
Secular tops in US stocks were 2000, 1968 and 1937 – 3 solar cycles apart (roughly 33 years). Secular nominal bottoms in stocks were 2009 (expected), 1975, 1944 and 1913 – 3 solar cycles apart (roughly 33 years). Secular tops in commodities were 1980, 1948 and 1918 – 3 solar cycles apart (roughly 33 years). Secular bottoms in commodities were 2000, 1968, 1938 and 1906 – 3 solar cycles apart (roughly 33 years). All these tops and bottoms fell very close to solar peaks and minima.
Is there anything special about 3 solar cycles, 33 years? Yes there is. Every 33 years the lunar calendar and solar calendar converge. A lunar month isn’t quite the same as a solar month, and so new moons and full moons gradually advance through the seasons, returning to where they began every 33 years. Most ancient calendars are luni-solar calendars incorporating lunar months plus additions to make it fit the solar year too, so societies engaged both. My detailed guide, Trading The Sun, reveals the influence of both lunar cycles and solar cycles on people, the financial markets and the economy, and the synchronisation of humans and human systems to cycles of nature. Rhythms in stocks and commodities – or more specifically human risk appetite and buy/sell patterns towards them – have synchronised with this luni-solar cycle.
If tops and bottoms fall close to solar maxima (which are roughly 11 years apart) and solar minima (ditto), and risk assets cycle every 3 solar cycles (roughly 33 years), then we should see these cycles in spectograms of stocks and commodities. Here is one commodity, wheat, and one stock index, the Dow Jones, under spectrogram analysis, revealing actual cycles confluences around both 11 and 33 years (as well as the other interesting highlighted cycles).


Source both: Sergey Tarassov
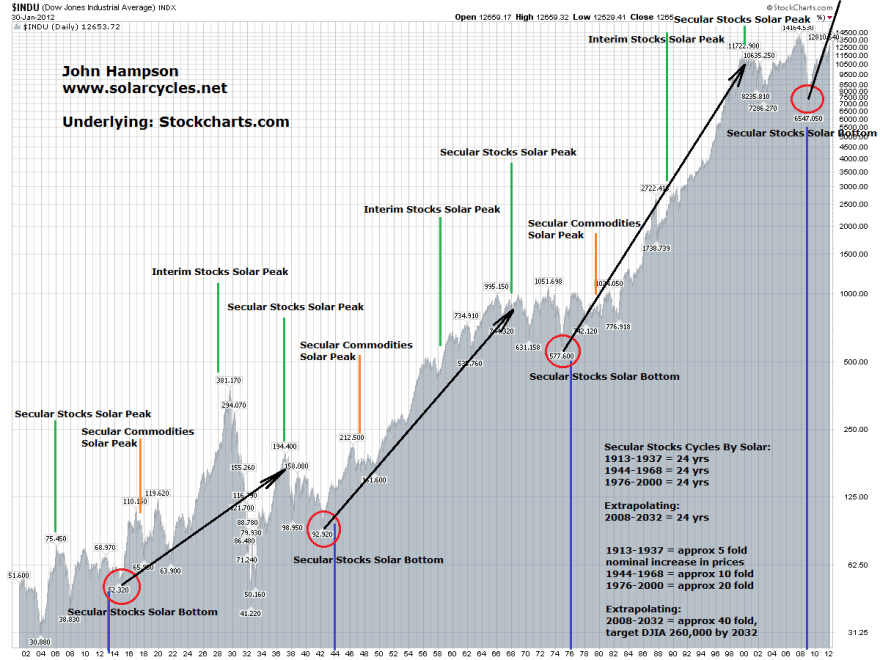
Below is the Dow Jones (DJIA) stock index in the long term view, marked with the secular tops and bottoms in stocks and commodities listed above.

Inbetween the secular tops were interim stocks tops, one being the Nikkei peak. It’s fairly clear from this Dow chart, that the interim tops are not secular tops, but the trend continues through them, with the exception appearing to be the massive peak (and massive fall) around 1930. Most analysts consider this extreme as a secular top and a subsquent secular bottom. But the comparisons suggest the secular top was around 1937 with a wild overbuying and overselling episode effectively cancelling each other out en route to the 1937 peak. For another less extreme example, the 2007 nominal stocks top exceeded the 2000 top but by other measures (such as valuations) we can identify that 2000 was the secular top for stocks.
Using solar cycle anchoring, secular US stocks bulls need redefining as around 24 years in length, or roughly two solar cycles (1976-2000, 1944-1968 and 1913-1937, shown by black arrows) beginning at the nominal low of what we currently consider to be a secular stocks bear, which falls around the solar minimums (shown by the red circles). That means a new secular stocks bull of around 24 years began at the turn of 2009 (that should be the nominal low) and should continue to around 2032. US demographic models predict a secular stocks bull lasting to 2032-2036, which provides a compelling cross-reference:


Secular commodities bulls need redefining as around 12 years in duration, or roughly one solar cycle (1906-1918, 1938-1948, 1968-1980, 2000-2013 (expected)), with some overlap with stocks (e.g. the new secular stocks bull began at the turn of 2009 whilst the secular commodities bull that began around 2000 should last to 2013). A complete risk assets cycle, incorporating both full commodities and stocks secular cycles, lasts 33 years, the distance marked between the blue lines on the long term DJIA chart above.
Look at the black arrows on that chart, marking out the secular stocks bulls. Note how they increase in steepness as the last century progressed. Note also that this is a log scale chart. That suggests the secular bull lasting from 2009 to 2032 is going to be jaw-dropping in nominal terms. As it happens, the nominal increases in each historic secular bull show a pattern (5-fold, 10-fold and 20-fold, in order) that suggests it may terminate around 2032 with a 40-fold increase from the low that occurred around the turn of 2009. That gives us a target of Dow 260,000.
If that seems a little far fetched, then know that it is achievable with an average 16% compound return per annum, and in the last 24 year bull of 1976-2000, the Dow averaged an annual compound return of 12%.
Inflation also plays a key role in increasing nominal returns, and if we look at the trend in undoctored inflation (Shadowstats figures), then other things being equal, higher inflation alone could drag up the average annual return from 12% to 16%.

Underlying source: Dshort
Inflation aside, the ‘opportunity’ to achieve a record return lies in exponential technological evolution, whilst the ‘threat’ lies in peak resources. The long term outperformance in real terms of equities versus commodities reflects technological evolution – the human value-add in making amazing things from raw materials and fossil fuels. Railways, electricity, computers and the internet all provided paradigm shifts in efficiency and cost reduction, enabling us to produce more and for less. The trend in technological evolution is parabolic, suggesting we should see the greatest intensity yet in paradigm shifts during the next secular stocks bull, potentially from the areas of nanotechnology, biotechnology, artificial intelligence, space exploration, geonengineering and renewable energy.
The evolution of artificial intelligence is captured in this computing power trend chart. The next secular stocks bull should see a computer match the intelligence capability of a human.

Source: Ray Kuzweil
Think that the last secular stocks bull delivered the internet, mobile phones, DNA identification and other paradigm shifts. With parabolic technological progress, the next secular stocks bull should deliver a higher intensity of leaps. The threat is that we are heading towards peak energy and peak resources in the first half of this century. Essentially, technological evolution has to deliver paradigm shifts in resources and energy, to delay peak limits, such as nano-engineering at the molecular level to make any substance, and delivering large scale renewable energy solutions. Here is the global energy forecast out to 2030, by BP:

Source: BP
Coal and oil will flatten off as we head towards exhaustion, with more abundant gas partly covering, but with renewables, nuclear and hydro the main expected growth areas fulfilling global demand. It is feasible therefore that technological evolution delivers enough to push out total energy and resource limits to a future secular commodities bull in the 2030s/40s, and in so doing enable exponential technological advances to deliver revenues, efficiencies and cost reductions the drive a secular stocks bull to new all time average annual returns in the window through to 2032.
Let’s look another way at a likely Dow target – the Dow-Gold ratio, below. Note how there is a long term trend in the Dow growing in worth versus gold. Again, this represents technological evolution and human value-add. Continuing the trend, the next secular stocks bull may peak at a ratio of around 80 around 2032. If the Dow was at 260,000, gold would be $3250.

Is gold at $3250 a reasonable target for 2032? By historical rhymes and solar cycles, we should see a gold parabolic ascent and blow-off ahead in a secular commodities bull finale in 2013, followed by a fast retreat and then overall sideways tracking (as shown below) during the course of the next secular stocks bull. For example, a parabolic ascent to $6000 then a collapse to $3000, before overall sideways tracking into 2032.

Underlying Source: Saville/Laird
So let’s see how gold completes this secular bull, but just over $3000 by 2032 doesn’t appear too much of a stretch.
In summary, by extrapolating trends in (i) secular stocks bulls durations and magnitudes, (ii) compound returns, (iii) inflation, (iv) technological evolution and (v) the Dow-Gold ratio, I propose that the Dow index at 260,000 by 2032 – although initially appearing fanciful – is instead a realistic target.

yes, it is possible. why not? 🙂
this idea is very extreme.I like
John,
As ever a well thought out/ constructed thesis. One observation I’d make is that the Dow/ Gold ratio has seen wild swings since Bretton-Woods was abandoned, following Nixon’s decision to close the gold window in 1971. The world has tolerated a FIAT currency system since then, but history tells us that FIAT has an average life expectancy of approximately 40 yrs…usually it’s demise is the result of profligate spending by incumbent governments.
For your model to play out, does it not assume that FIAT currency will survive, or put another way, if we are forced to abandon FIAT, would this not put a brake on the kind of inflation we have seen since it’s introduction?
I’m of the opnion that we approach the last few years of it’s reign and side with Jim Rickards in that a form of gold standard will be required to restore confidence when FIAT collapses.
Just a thought!
Regards
Rick
Hi Rick, good point. OK, maximum debt to GDP levels, based on history, are estimated at 150% to 260%. Based on this and trends in indebted developed nations, then around 2030 is the forecast common crunch point for several major countries to hit those kind of levels. If a secular stocks bull delivers technological paradigm shifts that reduce costs, increase efficiencies and increase revenues, then that crunch point should be pushed out further. Most of the major indebted developed countries are still amongst the world leaders in technologocial R&D, which should further assist in this respect. So, even if there is no way back and fiat has become a ponzi scheme destined for eventual collapse, I suggest that wouldn’t happen until the next secular stocks bear post 2032.
Great work John,
Do you think you could do a similar analysis on the cycles in the UK housing market? I think I read something about it on your old website.
OK, will put it on the to-do list.
Interesting that volatility went up today, along with the equinox. And an earthquake in Mexico. Reminds me of the Japanese earthquake which hit on the equinox last year.
Beware the equinox. I do find that interesting
Did you mean 1976 as a secular stk mkt bottom, it was a top? Ref commodities – I like to say 1920, 1950, 1980, and 2010 as commodity tops as it’s about a 3 year process around those periods. 2011 was the CRB top and 2008 was the Goldman Sachs top (heavily oil weighted). Both of those were historic tops as to new era, new paradigm, different this time, and rampant bullishness. Just like the 2000 stk/dotcom top and we still are not back their 12 years later. Cotton’s blow out top in the 1860’s was not exceeded until last year! My point is that each cycle has it’s leaders and it changes each cycle. Each commodity doesn’t get the lines around the block every cycle. The real big daddy bubble this time was real estate. We’ve had more than a decade of bubbles which makes me think this top is really special cyclic top
Thanks Kent – I meant 1975 – will correct.
Nice work John,
Are you a fan of fibonnaci sequences as I keep seeing their relevance across many financial assets as well as appearing in a few of your articles. The 33 year (almost 34) between secular tops, the 21 week peak between gold prices (in an article you wrote last year). I also see their frequent timing across much of my portfolio.
Interesting, thanks Tim. It is something I’ve cast my eye over, but a more detailed look might be fruitful. Another one for the to-do list.
I can hardly believe I commented on this article, but barely remember it. In a way, your 2016 update verifies this. The Feb 2016 low was a major low and hardly anyone seems to recognize it. The put/call ratio, bullishness below 30%, bullsih % 2008 levels, . Even though the % price drop was minimal, the technical indicators were near 2008-9 levels! A major bottom. 260,000 here we come. Caldaro says we are in a major 3 and guess what, the mkt is acting like it. Are you on twitter?