
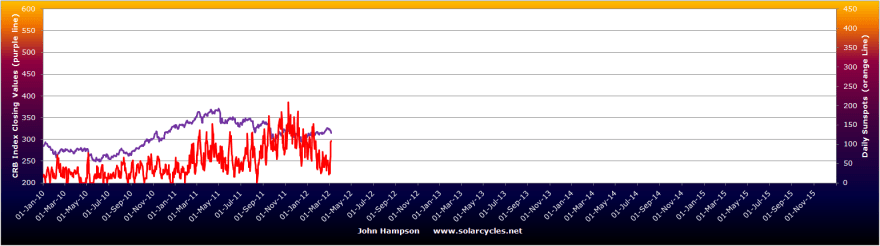
The solar peak is forecast for February/March 2013, which means sunspot counts should peak around then. The chart below shows that sunspots picked up from their December 2008 minimum gradually, becoming significant in 2011. In the last few months though, they appear to have died away.

This does not mean the solar cycle has peaked early, but reflects the oscillations of sunspot levels around a trend. Below is an overlay of this solar cycle (24) into the end of 2011 on top of solar cycle 14, which was a ‘spikey’ cycle. Less powerful solar cycles, such as both of these, are typically more spikey.

Source: SolarHam
It follows then, that we should expect an up-cycle of sunspots now, lasting perhaps several months, and if we zone in on a smaller timescale, we see evidence that this is perhaps now beginning, with a sudden increase in the last few days.

We can see from the above chart that sunspots rallied last year between February and November, or perhaps in two distinct upswings of February-April and September-November.
I have just produced a 26 page PDF on my new IN DEPTH GUIDE page which explains the relations between solar cycles and the financial markets in detail, so here I’ll just summarise that rising sunspots correlate with (i) earthquakes (ii) protest, revolution and war (iii) pro-risk and inflation.
The 7 most major earthquakes of 2011 all occurred in the two windows of Feb-Mar and Sept-Nov, corresponding to the upswings in sunspots. The Arab Spring revolutions main events began with the Tunisian overthrow in January and ending in the Libyan war finishing in October, again corresponding to the overall period of rising sunspots. And lastly, both significant inflation and outperformance in gold lasted between January and September, again tying in with the sunspot rally.
So, if sunspot counts begin to accelerate now and rise to new heights over the next few months (which we should expect as we are getting nearer to the solar peak), we should be alert for (i) earthquakes (ii) protest, revolution and war (e.g. Iran) and (iii) pro-risk and inflation, namely commodities rising and in turn inflation. Clearly (ii) could impact (iii) as oil could rise on supply jeopardy and gold as security.
As yet, we still do not see outperformance in commodities versus stocks, but at some point soon this should begin to occur, as by solar cycles a secular peak in commodities should occur in 2013. The chart below shows how stocks outfperformed commodies into their secular of March 2000, breaking away from their usual combined risk-on relations, and we should expect something similar from commodities into 2013.

Now turning to geomagnetism, we see a pick up in both actual and forecast geomagnetism that reflects the historic seasonality of geomagnetism, that typically is at a maximum in March and April. This negatively affects sentiment, and therefore we see in the models for stocks and commodities some short term downward pressure.


If we look at the medum term view we can see a clear flattening out and tipping over of the model:

This means headwinds for pro-risk until geomagnetism begins to ebb again, which by historic seasonality would be May-time.
This appears contradictory – rising sunspots ahead supportive of pro-risk, but significant geomagnetism ahead anti-risk. To further complicate things, rising sunspots typically lead to higher episodes of geomagnetism (though a lag can be common). A simplistic analogy would be that some alchohol (solar activity) makes for human excitability, but too much can also make for a lagged hangover (geomagnetism).
Returning to the chart above that shows stocks accelerating away from 1998-2000 in their secular mania finale, stocks actually took off from the geomagnetism model in this period, as might be expected in ‘irrational exuberance’. We should see the same therefore in commodities this time round into 2013. What I suggest could happen therefore, is that from amongst protests, revolution, war and earthquakes, we get a sunspot-inspired supply/security push on commodities, and a sunspot-inspired pro-risk/inflationary flow into commodity demand, which takes commodities above and away from the geomagnetism model, whilst stocks remain on the geomagnetism model track of sideways peformance. In other words, if a commodities secular finale is ahead, completing in 2013 (as solar cycles history predicts), then the period ahead is a window in which commodities should start to outperform.

If SP500 falls to 1300 zone, I start to acumulate long positions.
I think it have to retest high of Febrary 2012
Let´s see
Hi Hagen, we’ve seen quite a fast capitulation of breadth (per link below), which makes it doubtful we’ll fall that far. So I think shallow consolidation, then I concur on a retest of the high, whether it is part of a topping process or something more bullish.
http://ciovaccocapital.com/wordpress/index.php/technical-analysis/breadth-says-be-open-to-stock-rally/
I see it too but R/R is better for me in 1300 zone.
Thank you John
I like true facts of what the market is done and John does that very well. Breadth acts differently in uptrends as opposed to downtrends. Since I believe we are still in an uptrend, I would not expect a full blown sell off like what we saw when the S&P 500 was below the 200 MA from August to November of last year. Short term oversold signals and consolidations could be enough to put in correction bottoms in uptrends. Having said all that, I am not buying nor selling anything… I’m just watching.
Ref the last chart of geomagnetism/S&P 500. The last time the S&P500 (Jul 2011) was this far above a downward sloping geomagnetism the Dow fell 2000 and the S&P fell 200 in short order. Your first chart (sunspots/mkt) makes me see why you see 2013 as the more likely top. A big question in technical/marketdom is, was 2000 or 2007 THE mkt top. This chart makes it look like the 2000 to 2009 was a part of one large drop.
Great Stuff, looking forward to reading In Depth Guide.
Yes, the 2003-7 rally appears as a big fake. Of course that’s not possible, but it wasn’t a bull borne out of sunspots and human excitability.
John,
The graph comparing solar cycles 24 and 14 could give us longer term clues as well as shorter term ones. Most other graphs I’ve seen show solar peaks over a long term (typically they show the series of peaks dating back to the beginning of the last century), and depict each peak as exactly that – a peak in the form a spike. But the graph above reveals that they can in fact be very rounded tops, extending over nearly two years.
So although it projects the extreme peak of cycle 24 to be early 2013, similarly high levels of sunspot activity could continue into mid-2014. If that happens during cycle 24, then it could be argued that the peak should extend from Feb/March 2013 to mid-2014, rather than a sharp peak and subsequent sharp decline in early 2013.
This would also tie in well with the tendancy for high levels of geomagnetism to persist for a significant time after each solar “peak”. In fact, looking again at the two graphs you posted on 23 February (which as well as showing the relationship between Venus-Earth-Jupiter alignment and solar peaks, also reveal a strong relationship between that alignment and geomagnetism peaks), it seems they also place the forthcoming geomagnetism peak at 2014.
As each geomagnetism peak occuring near the end of previous secular stocks bear markets (1942, 1974, 1982) have marked excellent times to buy stocks for the long term, I feel there is mounting evidence that the current secular commodities bull could extend well into 2014 before giving way to the next secular stocks bull market.
Thanks again for your analyses, and for putting all this together – there is nowhere else I know of where it is possible to get access to all this information.
Nice observations. Back in 2000 both sunspots and stocks tried to double top later in the year. So whilst Mar 2000 was the definitive top, it was more of a rounded process like you say. Stretching into 2014 could be possible therefore.
John,
I’ve just read your In Depth Guide, and see that you have already addressed the timescale of the solar/geomagnetism/commodities/ stocks peaks in it.
It is excellent work, and I would recommend it to everyone interested in this site.
Hi John,
Any comments about this article. I found it interesting and felt cautious after reading that.
http://www.marketoracle.co.uk/Article33437.html
Thanks for all the great work. Been following you since the old website
Regards
Hi Sean, I followed McHugh for a while and then filtered him out. But the equinox-turn phenomenon – one in March and one in Sept correspond to the peaks in bi-annual geomagnetism seasonality, so IMO it makes sense we might often see a falling market bottom there or alernatively an extended rally finally killed into it.
HI John, Glad to see there is some one who is trying to assimilate sunspot data with
the markets – One of my VPN members sent me to this site. I wont forget to thank him-[g]
I dont try to use long term data for mkt turns as most of my members are shorter term traders. but knowing the trend is quite important to keep a prespective.
there have been 22 such CME events since FEB 15th, 2011, and some of them did fall on interesting dates corresponding to mkt behaviors– It does seem, however, they can signal stock price movement in BOTH directions- ITS NOT JUST geared toward only UP moves
From Jan6, 2009 to MAr9, 2009- the GEOAMAG FLUX indicator was WILD every day and has only shown such activity on rare occasions since then. This Friday was one one of those rare events- just how it will coincide with price changes is yet to be seen.
Elliott wave precepts would indicate a SELL OFF to 1300 on or before next Friday-16th, a Bradley date with the 18th a low tide also. Ive been using some very unusual scientific resources the past few years at my blog- jaywiz- come on by & visit. Jay
Thanks Jay – I’ve had a look at your site
John
Thank you so much for all your great work.
If $SPX to do long-term holding until in October 2012,Next week whether to buy?Or should be wait for April, lower price?
HI Russia
You really cant expect people to TELL YOU HOW & WHEN TO MAKE TRADES
AS analysts, we can only provide you with data- the TRADE is UP TO YOU.
And ASKING eveywhere you visit will ONLY GETyou MORE Confused
I realize what your tryig to do, but its ONLY giong to make things more confusing for you.
BEST WISHES
YOUR FRIEND
Jaywiz
John, I buy the DAX does not sell, and still continue to hold,DAX Have the opportunity to rise to 7500 this year?
Hi Francis, I don’t mind you asking as long as you understand I am not an advisory service so I can just tell you what I am doing and thinking. Right now I am pretty much out of stocks, waiting for the next opportunity, and I consider it could be on the short side if we continue higher and make a large divergence from my models by late March. Or it could be on the long side if the market pulls back whilst leading indicators continue to improve, sunspots pick up and geomagnetism eases off. I maitain the expectation that stocks will move overall sideways but with an upward bias into the end of the year, and within that I would expect we tag 7500 on the Dax.
One of the largest fibo & high energy clusters is about to occur on MARCH 22nd.
Amazing that we have just had including today – Mar6,7& 12th
THREE geomag sudden impulses within a VERY SHORT TIME PERIOD.
These are CME’s that ONLY effect the goemagnetosphere.
Later
Jay