
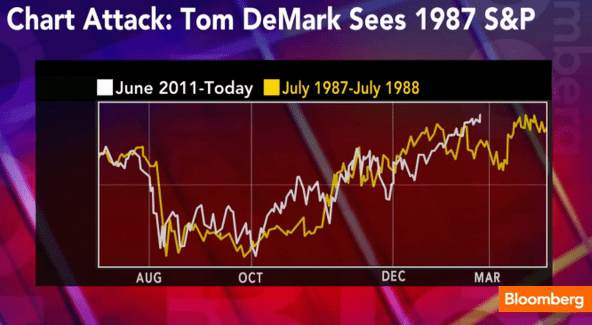
Tom De Mark pins us around a top here, still suggesting roughly a 5% retreat from here in total, in an up-down manner that frustrates bears, before the market then advances again. He makes the following analogy with 1987:

Source: De Mark / Bloomberg
My model top is around today, fitting with De Mark’s call, and my next model low is around 9 March, which fits with that 1987 analogy.

With a little more geomagnetism forecast, my model is flattening out. Ideally, I would like to see a final higher push today/tomorrow into which strength I would exit further stock indices longs, with a view to looking to buy some back if we can reach around 5% lower or so, but still being much more overweight in commodities expecting outperformance in that class going forward.
Turning to the US dollar, Chris Puplava identified this analogy with the 1970s in the middle of last year.

Source: PFS Group
Note how the US dollar failed a backtest of the ABC s/r line in the 1970s and then declined significantly, providing the backdrop to the last secular commodities bull finale.
The current US dollar technical position is very similar (shown below), possibly having just backtested the s/r line and potentially now going on to decline, as a backdrop to this secular commodities bull finale. Dollar sentiment is fairly neutral currently, giving no clues, but the Euro-USD relationship has closely mirrored pro-risk in recent years. As my other references support a bullish commodities conclusion over the next 12 months, I predict the US dollar will indeed fall away and the Euro advance again, as pro-risk led by commodities is the dominant theme. The Greek debt deal yesterday should assist in supporting Euro-USD.

Source: Stockcharts / James Craig

nice site dude. i think commodities will not peaking soon. one of the best charts comes from short side of long blog which you recommend. look at gold vs nasdaq. click here for link.. we still got a long way to go dude so buy the dip!!!
Stock bull market usually last for 18 years, commodity 14.
1933 – 1947 – commodity
1949 – 1966 – stock
1966 – 1980 – commodity
1982 – 2000 – stock
2000 – 2014? – commodity
2016 – 2032 – stock
According to my own research of my than 300 years of data from various sources, commodity bull markets have lasted between 15 to 21 years.
The 1933 bull market lasted until 1952. The 1970s bull market started earlier than 1966, while the Crude Oil actually bottomed in late 1998, not 2000. Commodity bull markets on average last 17 years, similar to stock bull markets.
I am bull too in EUR/USD
John, what commodities ETF’s can you recommend for an investment consideration (besides future contracts, I mean)?
Thank you in advance.
Hi Jan, I’m not an advisory service, so I’ll just share with you what I own, and my biggest ETF holding is in ETF Agriculture DJ-UBSCISM, which gives me corn, wheat, sugar, soybeans and soybean oil, coffee and cotton. Note that it doesn’t cover cocoa, oats or rough rice (I don’t know of one that holds all), and right now I hold cocoa separately in rolling futures. In my SIPP I hold various ETFs: physical gold, physical silver, and ETF Energy which gives me crude oil, nat gas, heating oil and gasoline.
I have PSLV – Silver, PHYS – Gold (Sprotts ETF’s)
http://sprottphysicalsilvertrust.com/
In my opinion, if the Industrials drops 5%, or less, we could see now highs, 13.150-13.200 or more, but a continuation 25-30% down in less than a year.
EURUSD down to 1,16 in medium term.
yo veo el mercado muy alcista a partir de junio………forzaran la maquina para final de año, y habra un aumento en las materias primas, los spikes en commoditties suelen precedir a recesiones
Y el euro, deben apreciarlo para comprar materias primas, el petroleo en EUROS y en Libras esta en maximos de 2008
I´m afraid it is just the opposite, hagen. Good spanish.
We shall see it in a few months
John, that USD dollar fractal is re-occuring over time again and again. Check the dates in 2008 vs 2011, same pattern and very close CIT’s. Last dollar peak is projected early mid april 2012 which would correspond with march 2009. The only question is if it will be lower high, higher high or this last attempt fails again to the downside.
Ref the $. The $ had been in a very long term bear. Technically, it has broken out having made a 3 year double bottom and turning the 200 day moving average up.
When such a long term bear is broken it is very common for the 200 day MA to be tested 2 or 3 times over the first year after the break-out. That’s what gold did in 2001. Apparently, so many years of downside begets a lot of selling into rallies. The $ is fairly strong as it is well above the 200 day.