
1. Investors Intelligence
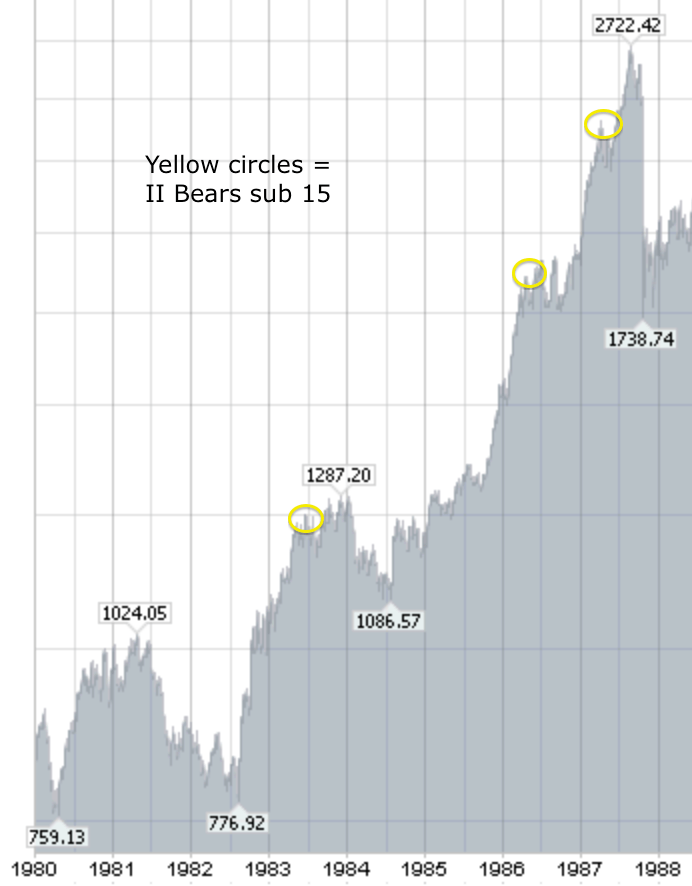
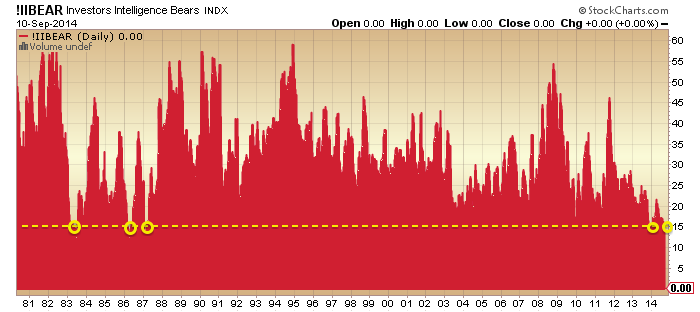
II Bears (advisor sentiment) is sub 15 again this week, previous clusters shown:
Source: Stockcharts
Here are those sub 15 readings on the 80s Dow:

Source: Stockcharts
The 1983 extreme II reading occurred 12 months after the new bull market kicked off, and is comparable to the spike down in early 2010 in the first chart that didn’t quite reach <15 bears. The 1986 and 1987 double (circa 5 years post bull launch) is comparable to the Dec 2013 and current extreme pair, but note how stocks rallied for 5 months after the 1987 extreme before collapsing.
2. Rydex
Rydex asset ratios (Rydex family of funds) current extremes are most similar to the 2000 period, namely a time band of extremely skewed holdings lasting for around 7 months in 2000, as we are seeing in 2014 (9 months mature).

Source: Stockcharts
But note that within that 2000 time band we saw two periods of major sell-offs: March to May and September to December. We have not experienced either so far in 2014.
3. NAAIM
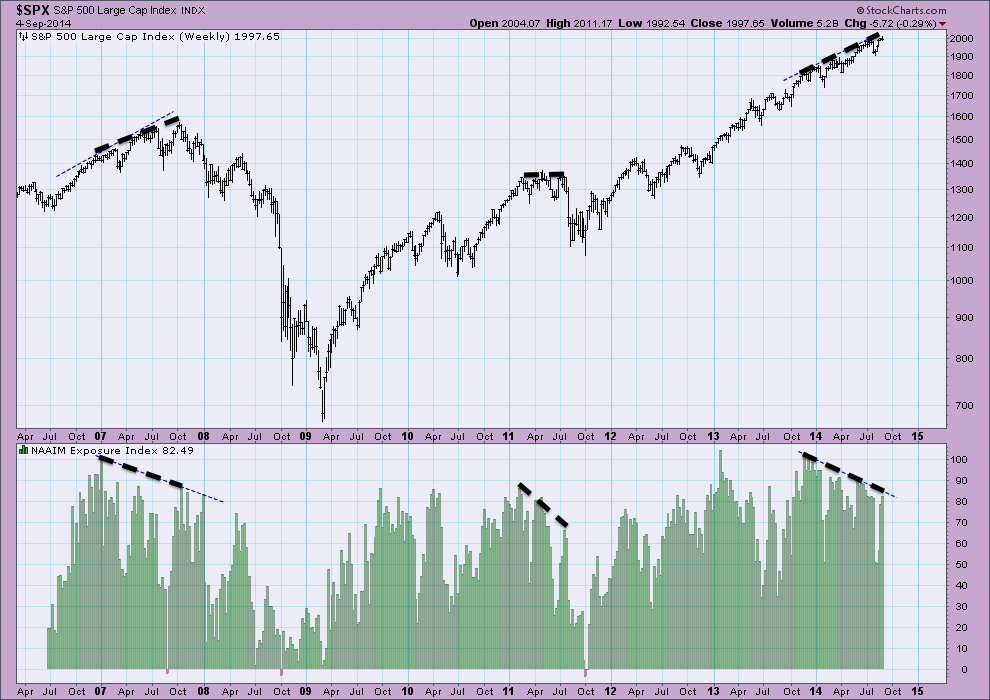
NAAIM exposure (managers US equities exposure) made a pattern of extremes-plus-divergence at both the 2007 and 2011 market peaks:
Source: Acting-Man / My annotations
We see similar extreme high readings plus the same gradual divergence since November 2013. The pattern is most similar to 2007, where it lasted 10 months before the market finally entered a bear market. Here in 2014 the pattern has also been in play for 10 months.
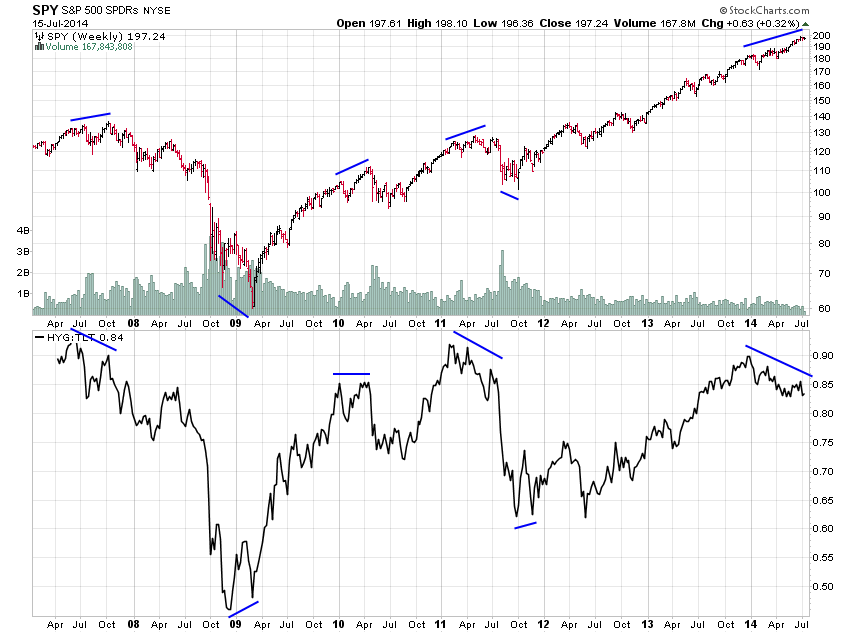
4. HYG:TLT
The high yield to treasury bond divergence (a risk off measure) lasted 4 months, 5 months and 5 months at the 2007, 2010 and 2011 market peaks. The 2014 divergence has been running 8 months and is therefore excessively mature.
Source: Jesse Felder
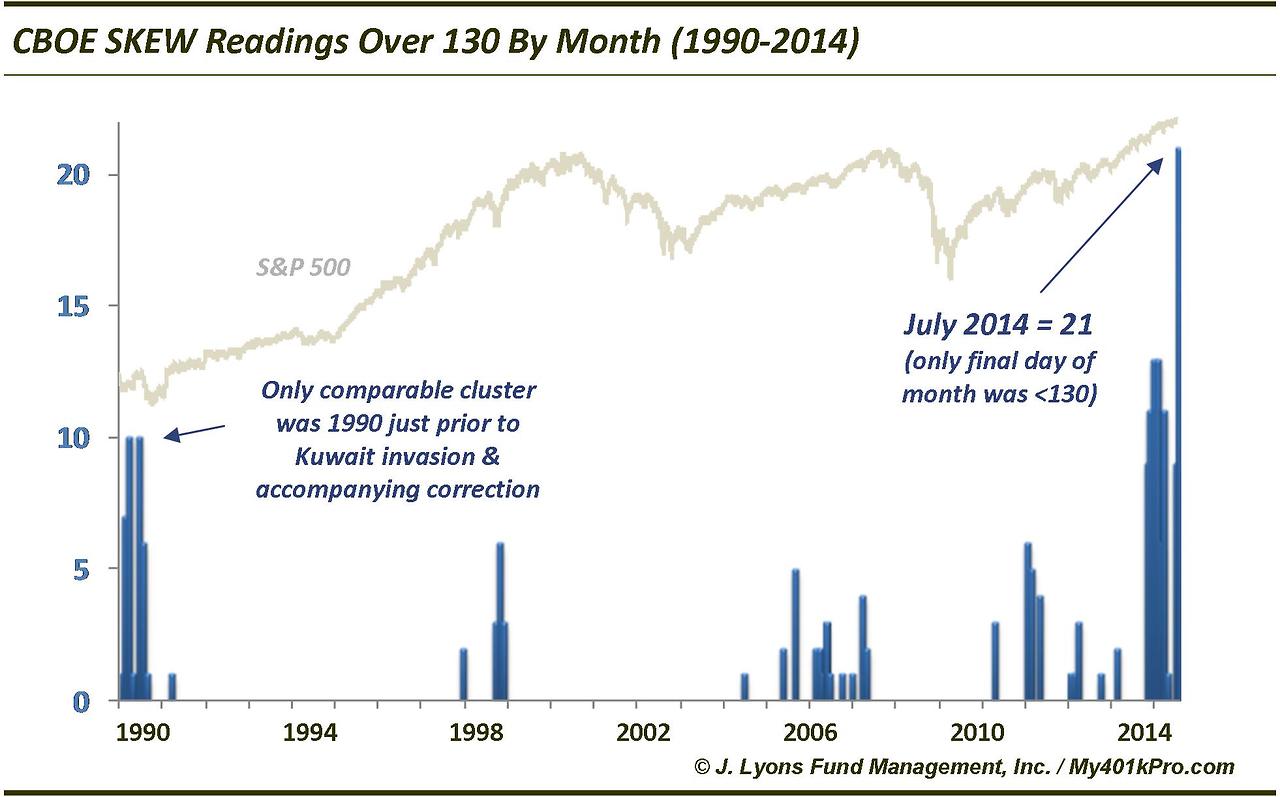
5. Skew
The persistent extremes in Skew (risk of outsized move) beats any historic parallel, but we could point to 1990, and the most recent cluster in 2011, both which produced 20% sell offs in the market. The 1990 cluster lasted 7 months which makes the 2014 cluster, at 10 months, again excessively mature.
Source: Dana Lyons
6. Q ratio
Q ratio valuation (replacement cost of stock index companies) shows that flirtations with an extreme value of 1 were historically swiftly repelled (by bear markets) with the exception of 1996-2000.
Source: D Short
With the stock market now 2 years above the 1-level, the closest parallel is that period into 2000. Note there was a 20% correction half way in 1998. However, the run up to 2000 was a demographic peak, this is not, and valuations need demographic context. I believe 1937 is the most applicable mirror which puts us ripe to fall.
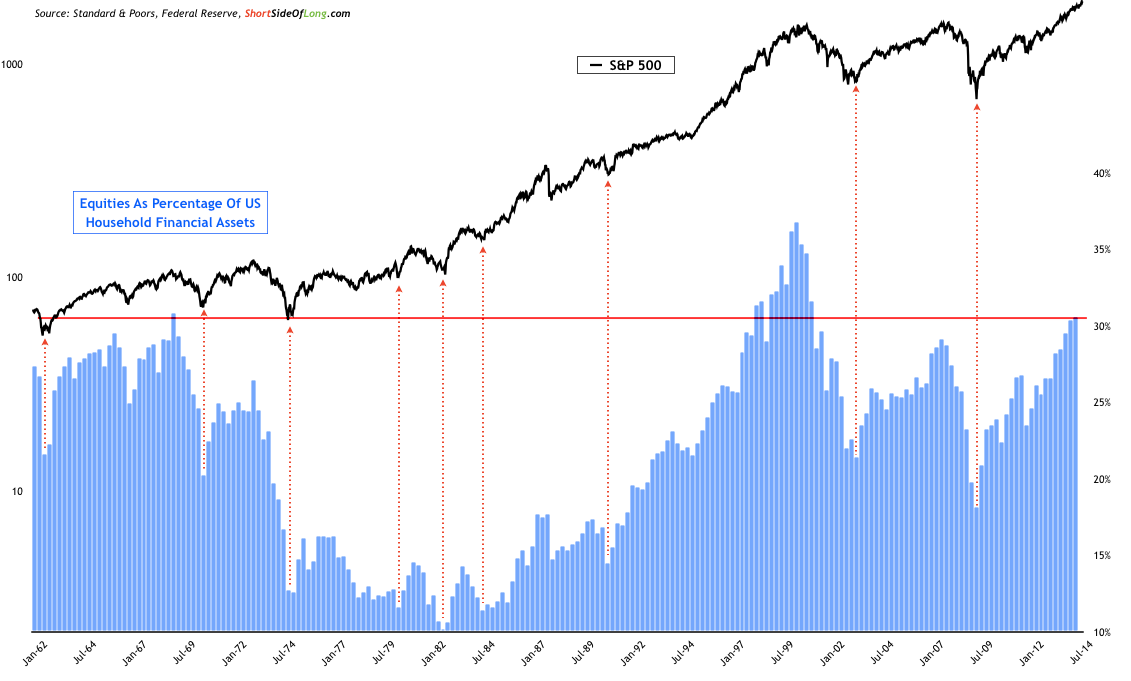
7. Household Equity Allocations
Equities as a percentage of US household financial assets have historically signalled market peaks once flirting with the 30% region, with the exception of 1997-2000. Again, demographics do not support this indicator rising to higher levels, so I would mark this indicator as similar in outlook to the one above.
Source: ShortSideOfLong
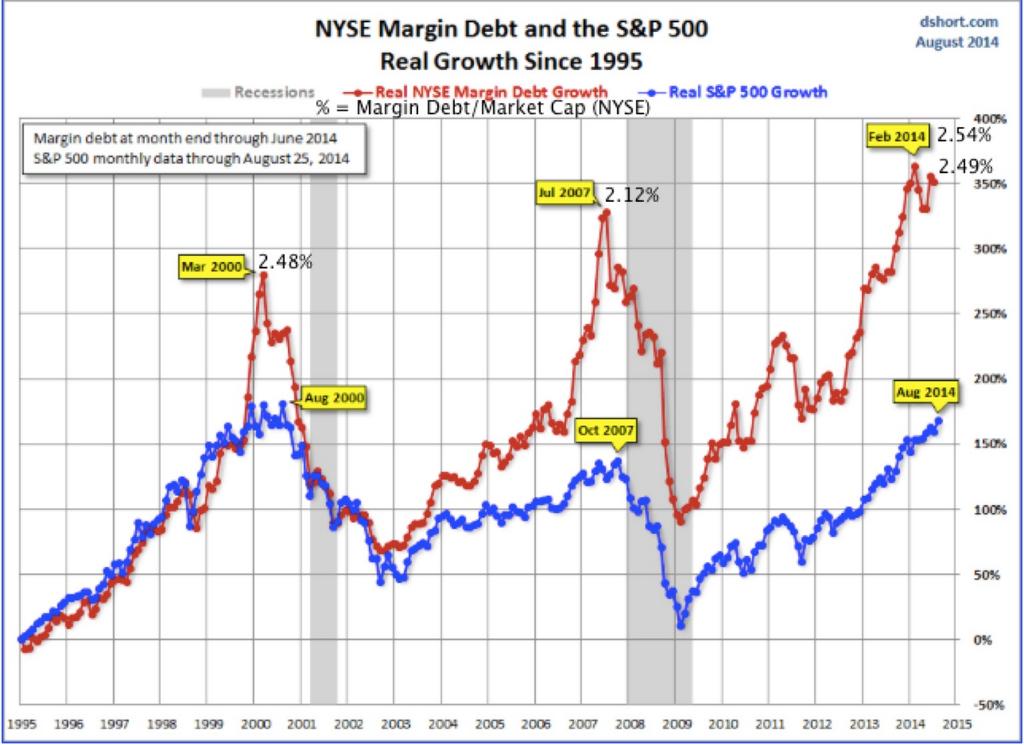
8. Margin Debt
Margin debt (investor leverage) surged for 15 months into 2000’s peak and 10 months into 2007’s peak whilst the surge into the Feb 2014 peak lasted 18 months, so relatively mature. Whilst the Feb 2014 margin debt peak is only tentative currently, it occurred 6 months ago, versus 5 months and 4 months pre-peak in 2000 and 2007, so also relatively mature.
Source: D Short / U Karlewitz
9. Sornette Bubble
Sornette’s bubble end flag calculation looks like this currently on the SP500 and the US tech sector:
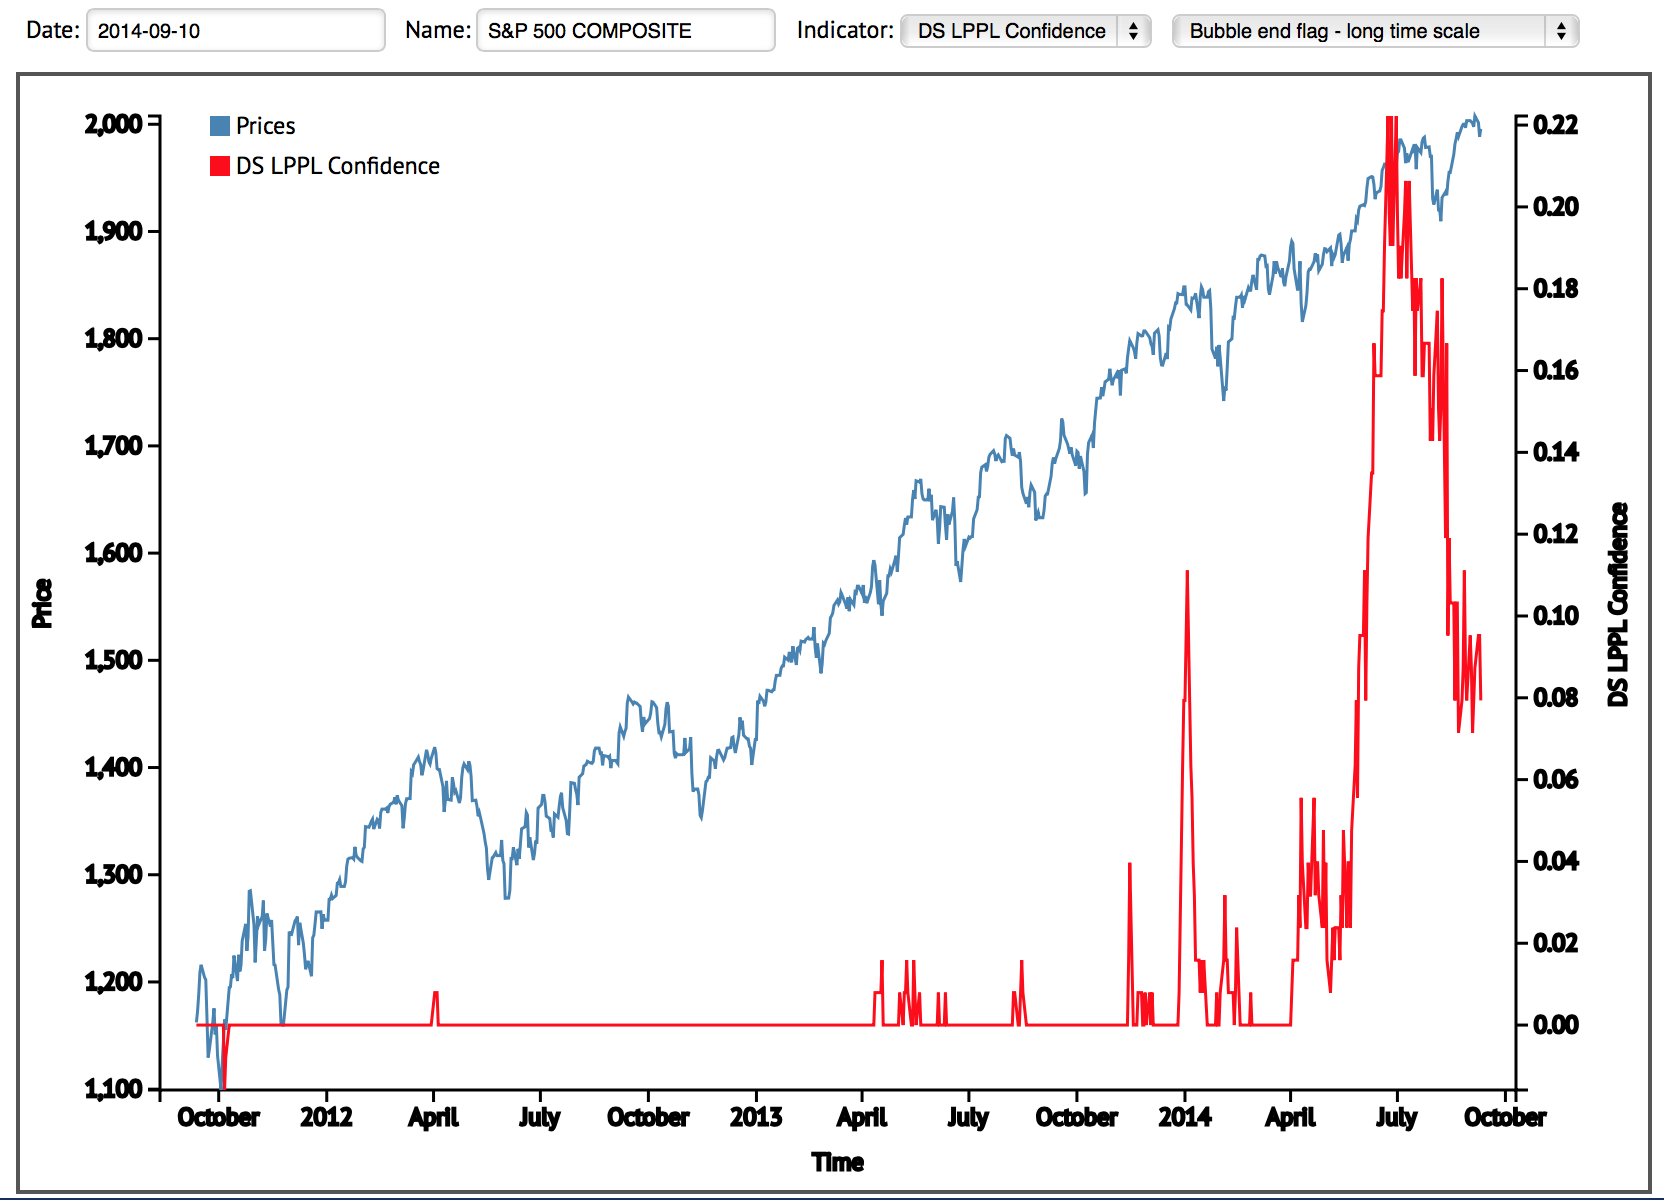
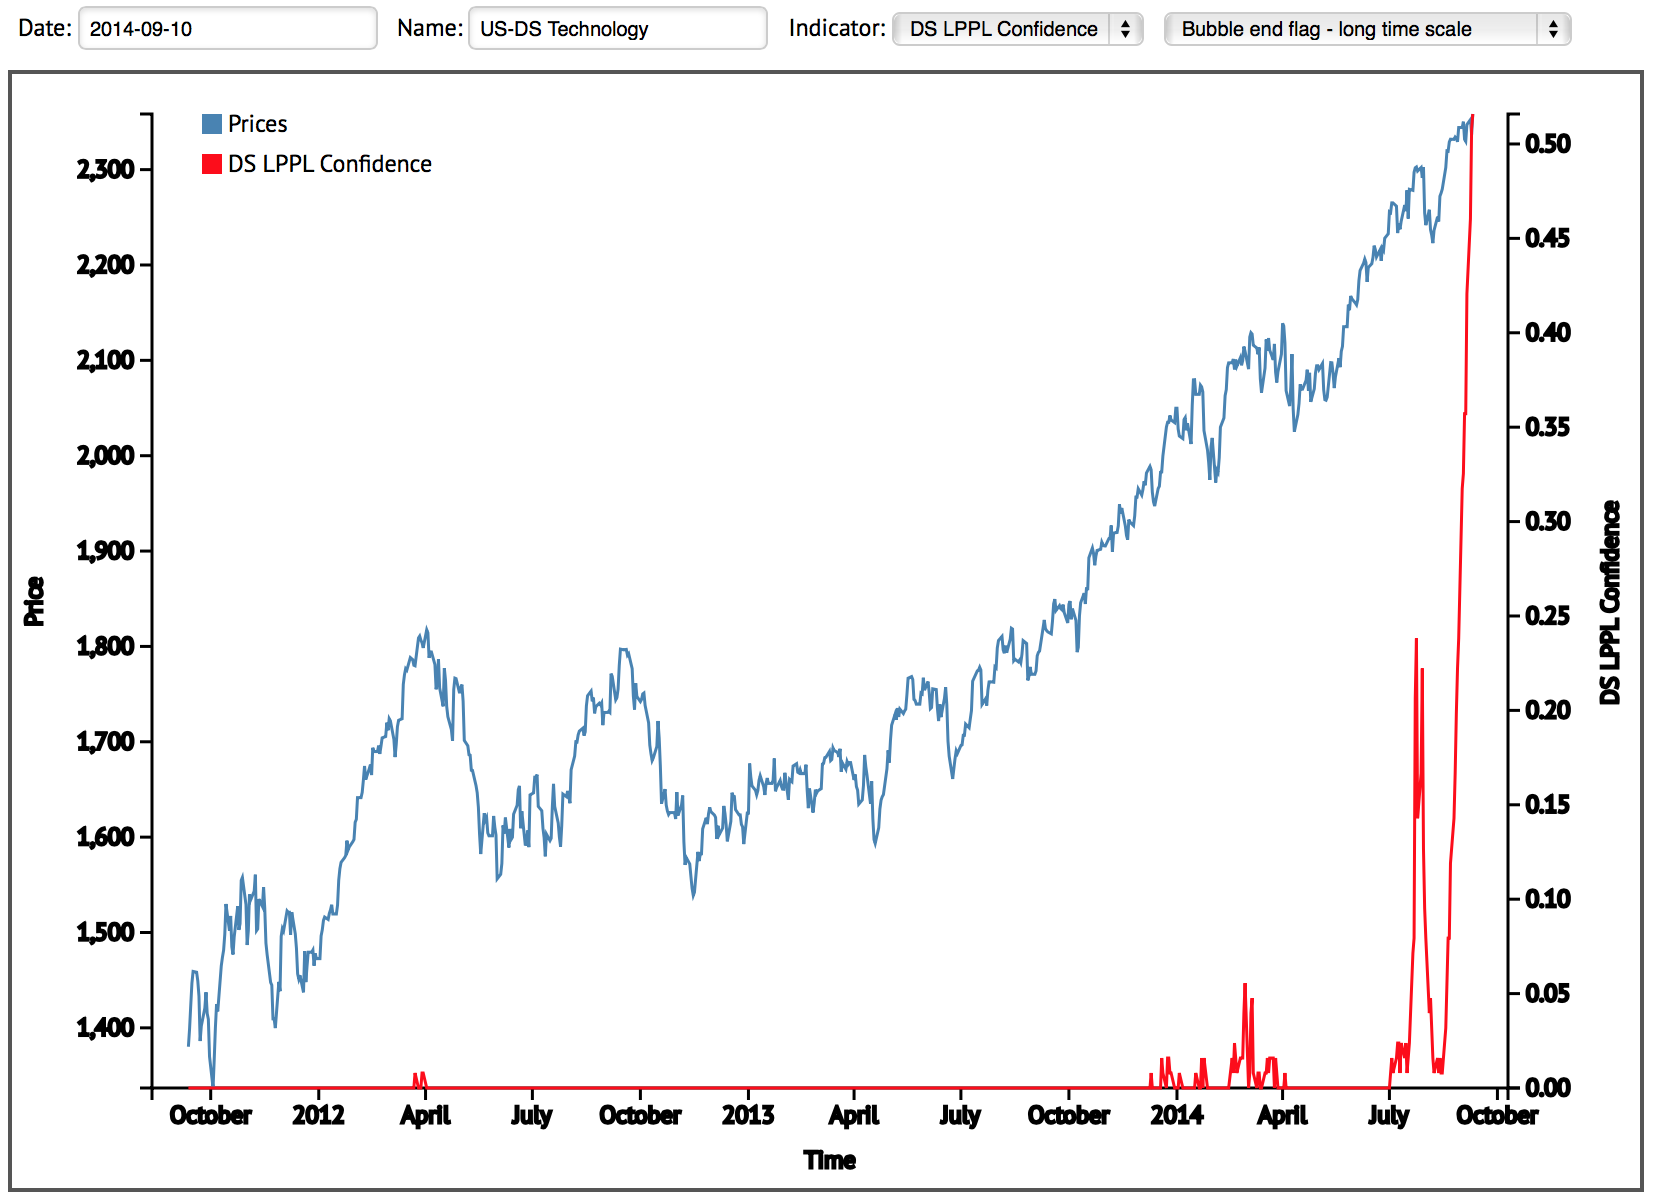
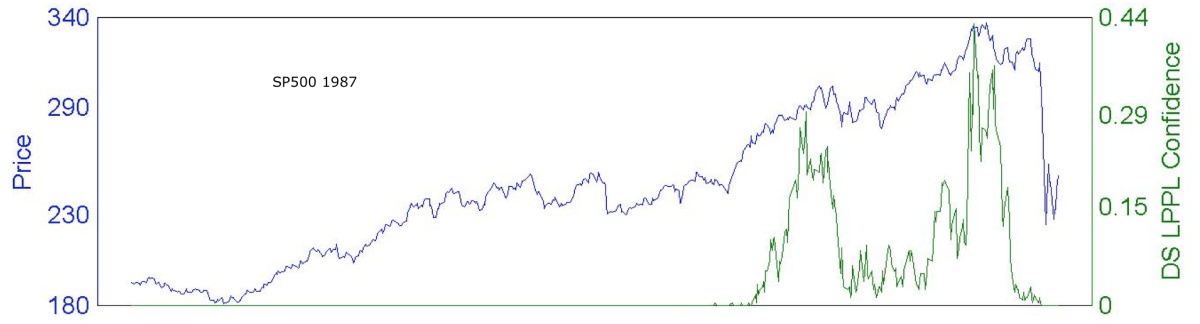
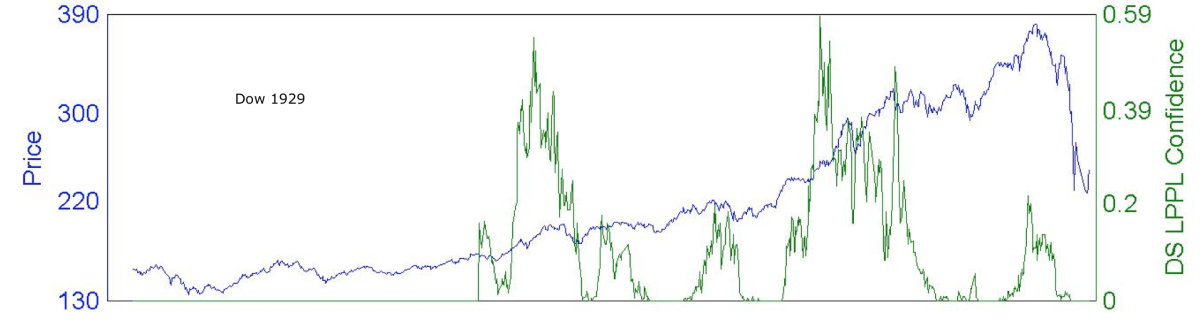
Compared to historic examples, the SP500 has not flagged at as higher intensity, whereas the tech sector now has. On the other hand, the tech sector flag looks fairly ‘new’, whereas the SP500 flagging has built up gradually. Neither have spiked multiple times in an extended period like in 1929 or 2000 (which both lasted around 2 years). At this point, the picture is most similar to 1987 of the three.
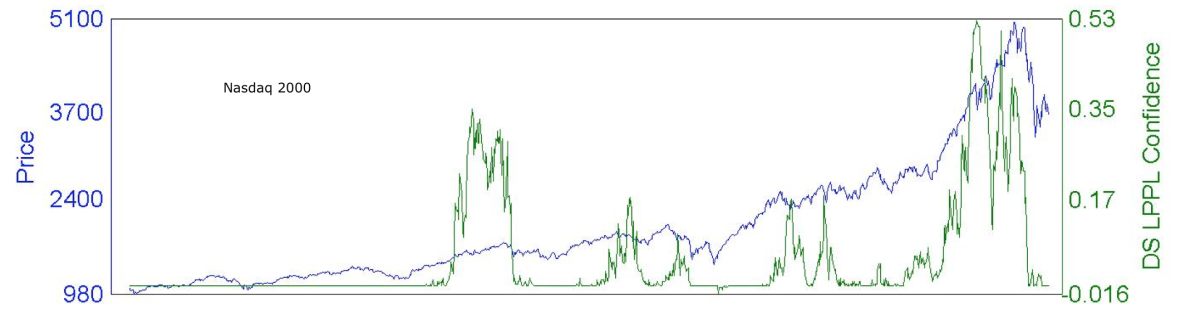
Source: Financial Crisis Observatory
10. Solar maximum
By most solar models, the smoothed solar maximum is behind us, circa March 2014. If this is so, then the last four solar maxima delivered the asset mania peak within 5 months, which makes the current peak ripe.

There are question marks over how close the timing ought to be (looking further back in history), and we cannot yet be sure the smoothed solar max is behind us. However, this is where cross-referencing comes in useful.
Investors Intelligence argues the top should be before 2014 is out, whilst NAAIM calls for one straight away. Rydex, Skew and HYG:TLT all argue a sharp correction circa 20% or a bear market is overdue, and margin debt tentatively does too. Meanwhile, Q ratio and household allocations argue for a sharp correction circa 20% imminently or a bear market too.
All these indicators cast great doubt on the speculation peak being some way ahead in 2015. Collectively they argue for us to be in the last gasps of a topping process that began at the turn of the year. If stocks were to continue to rally into 2015 then we would print major anomalies in all these indicators: they all worked historically, but this time is different. I don’t buy that.
The Sornette bubble either places the market at a 1987 style peak now, or will come again at a higher intensity any time up to the end of 2015. The solar cycle places us either ripe to fall, 5-6 months post smoothed solar max, or also may allow for a peak up to the end of 2015.
I therefore believe that the logical case is for the eight market indicators to work once again and deliver a peak now, which then fits with the 1987-style Sornette reading and the most likely smoothed solar max / speculation peak lag combination. It all fits together, it all fits with history.

“It all fits together, it all fits with history”
As per my last post John:
You know something is nearing an end, when most think it will go on forever 😉
John
Many thanks again for all your great insight & effort which you generously share.
One question, one poster mentioned a likely geomagnetic storm hitting US tomorrow. Should this have a negative impact or boost speculation?
Thanks
Appreciated. A negative impact, if hits with the intensity predicted.
Hi John-
As we appear to be moving through a topping process, am I right in assuming you believe roughly a 20% correction rather quickly will occur then what? Do you believe we run back up to the peak again and fail? What is your timeframe and ultimate low on S&P as a bottom to go long again? I believe the Greedometer from his blog is also now rather steadfast in believing regardless of ECB QE that we will turnover and correct 20% the next month and a half, then try again at the peak only to fail and run possibly to triple digits in S&P sometime in 2015 or even below our last bottom in 2009…
Thanks in advance,
Ken
Dow 1929: 3 weeks 44% declines
Dow 1937: 8 weeks 38% declines
Dow 1968: 8 weeks 18% declines
Dow 1987: 2 weeks 34% declines
Nikkei 1989: 6 weeks 27% declines
Nasdaq 2000: 3 weeks 35% declines
SP500 2011: 2 weeks 18% declines
So I am expecting something swift and severe lasting 2-8 weeks and a minimum of around 18%. Thereafter I expect a multi-month partial retrace of the falls: circa 3-4 months and retracing 50% of the declines or so. This is all based on historical analogs. Then after that a long bear market. So, when to go long? Not for a long time, but there should be an opportunity for a counter trend rally once that initial 2-8 weeks panic selling is out of the way.
reposting the link to watching the 2 CMEs hit:
http://www.swpc.noaa.gov/wsa-enlil/
I expect a high on the 18th of September and after that the decline John mentions into october 9th. This would be 2-3 weeks. After that the recovery into nov/dec.
Allan, I do not think there is one person here who
thinks it will go on forever, certainly you do get a
sense of frustration in some recent comment and
people giving up attempting to time the
next large decline.
The only real debate imv is on timing, duration and
depth.
Haha Phil, what I should have said is.
You know something is nearing an end when most see no end as near.
Here is the stock market peak in 2000 versus daily geomagnetism. See how three major storms hit in July-Oct following the actual solar/stocks peak of March 2000, helping tip the sentiment over. We are in the same seasonal geomagnetic window now, so for the bear case, a big storm this week would be timely.
Wow John that is really eerie to say the least if it does occur. Well done.
You know the saying, history doesn’t repeat but it certainly rhymes.
All this is amazingly elegant.
Does the upcoming 2nd Blood Moon lunar eclipse of the Lunar Tetrad play into this at all?
Do you have this same chart for 2011-present? I don’t feel like the storms have been that large this time around.
On the geomagnetism page
John, call me crazy but I get migraines when there is a geostorm. That drew me to the possible collective effect on humans. Currently, I am having one, but it hasn’t hit yet. Any ideas why?
There was a solar radiation storm already in progress yesterday but I don’t know the effects
Valuation to demographics should be enough to cause a correction. Being bullish despite these facts seems like incompetent investing advice, or blatant market manipulation.
looking strictly from the pattern perspective, it allowed for and suggested a wave 4 pull back to approx. 1984 spx. Then we would see the beginning of one more 5 legger up. The 5 legger up will likely be the final 5th wave. It is always difficult to know exactly where a final 5th wave will end because it could be a truncated failure, or a normal 5th wave to 2020’s SPX, or it could even be a 5th extension…blow off top maybe going into the 2030’s.
So far we have seen a bounce at 1983ish, as expected. Now we need to watch this next leg up carefully. It can end abruptly or extend for a week or more. The wave 4 down to 1983ish was complex. If the wave 4 chooses, it can add an “x” wave here rather than the 5th wave, and continue to grind sideways for another 3 legger in an effort to kill more time. Why would the SP want to kill time as it has done? Maybe because of the FOMC next Wed. I don’t expect it to start another 3 legger sideways move, but it can do it, especially since we have an important old yeller announcement coming next Wed.
$NAHL:$NATOT posted above is NEVER WRONG…
tends to confirm the net line trading with the 13 ema and elder power…
signaled long on the 16th and gave a sell yesterday –
http://stockcharts.com/h-sc/ui?s=$NAHL:$NATOT&p=D&st=2014-03-31&en=today&id=p20212675063&a=344670944&r=1410445599996&cmd=print
Distribution at the top in play. Important question is how far the first stage of decline will progress ? My bet is around S&P 1900 in rather straight line, maybe next week.
I definitely lost my heart for gold and I don’t see any upside for that PM. 900-1000 may be final target for gold. Continuing strength in USD may last longer then.
http://stockcharts.com/h-sc/ui?s=$SPX&p=D&st=2014-05-21&en=today&id=t69125189745&a=366970903&r=1410443421456&cmd=print
1984 still needs to break and XRT needs to get back below 88!
Until then it is just a tentative sell but we arent neutral no more here.
I have been 60% short, 25% leveraged bonds and rest cash here though
Excellent post, John.
Thanks
pomo is a fair amount today so expect some futile resistance from proprietary trade desks! lol $2.00 – $2.50 billion
http://stockcharts.com/h-sc/ui?s=$SPX&p=D&st=2014-05-21&en=today&id=t69125189745&a=366970903&r=1410443421456&cmd=print
$OEX 886.28 an important level.
YOU GOT THE POWER!
http://stockcharts.com/h-sc/ui?s=$OEX&p=D&st=2014-05-21&en=today&id=p63877024766&a=367235959&r=1410451678562&cmd=print
RUT looking very bullish, big wave up with abc correction
neutral to neg until 117 (iwm)…
again, why does everyone see bullish indications at the tops of the cycles? blows me away.
it’s one thing to look for continuation patterns but to ignore the fact that IWM clearly has failed to rally past the top of the cycle is nuts
elvis, you are correct and it is unfortunately a factor of the conditioning that has taken place in recent time and something that became widespread during the dot.com. bubble. BTD!
ben, a look at RUT longer term charts tells a different story. I would be very careful.
All rallies are getting sold on the SPX and other indices look vulnerable.
Allan –
I believe the bear case will come sooner than later myself but 4 of the last 5 days we have closed at highs and rallied off lows in the SPX. SPX is also up roughly 9% for year. I find it interesting that you believe the rallies are being sold. Hard to disagree right now with the bulls not being in charge. We are also only 10 handles off the closing high for the year after todays close. This seems to be hardly a bearish setup. I’m not short or long, just waiting for a trend change which is why I find John’s analysis invaluable should it play out…
Don’t think the market can make progress with credit markets selling off. To me, it’s been a piece of the puzzle that’s been missing for the bears…no more. We’ll see if the weakness is more than just a ST draw down.
http://stockcharts.com/h-sc/ui?s=HYG:TLT&p=D&yr=8&mn=3&dy=0&id=p75497479647&a=360644868&r=1410454682667&cmd=print
Peggy – thanks for the link. If that model is correct, then we will miraculously dodge most of the second bigger and faster CME a few hours after the US open tomorrow!
The first one is due to impact us near the US close today – but we’ll miss the worst of that one too.
I’ve watched the model for a while and never seen anything this large and/or this large and headed right at us. Past CMEs (smaller) and glancing created volatility. I’m interested to see what happens later in September – according to this 27 day forecast – very high Planetary A levels. http://www.swpc.noaa.gov/ftpdir/weekly/27DO.txt
Some older smoothed Ap records: http://wattsupwiththat.files.wordpress.com/2009/01/ap-index-1932-2008.png
Observed measurements can be 50% higher than these smoothed ones – the highest was 44 during 1991 I think.
thanks Mark
Do you know how they predict Ap so far in the future if the solar flares just take a few days to reach earth?
not sure. I’ve noticed that it’s pretty accurate although they do change the daily forecast totals occasionally. guessing it’s based on the previous 27 day rotation and estimates based on that solar activity.
another way to use Stowell’s net line system – it’s really accurate and cool this way
gave a sell on 9/4 as shown
TY Elvis……….
continuation of the uptrend will be signaled if…
the indicator moves above (with zeal – ha) 26.33 and the bull/bear power goes positive
As I wrote before, analogy between 2007 and 2014, with EU indices advancing tops in spring-summer, hand with hand with Russell2000.
One month before now.
Always talking about DJI, topped in the end of dec13-jan14, 2nd top in jun´14 and 3rd one in sep´14.
Might see a rebound in nov´14 like dec´07, above?, below? prior top?
Anyway, 17-17.5 K would be a great opp. to be short, in my case, with no-leverage, or little in extreme case.
This is my 2014roadmap.
After I pointed out 3 possible scenarios:
1>-0,5 fib from 2009 to 2014, like S&P 1980-82 (upward prior top structure is the same), to the 200MMA, around 11-11.8K
2.> -0,618, common retracement, like 1978-80-82 levels> 10-10.5K
3> 1909-16-19 upward structure. After last peak in 1919, retrac. -0,76, or even a little more to the 2002/09 bottom> 8K, even 7K.
I operate by levels, with no-leverage in long runs, can add some laverage in particular-extreme cases.
Time will tell.
Best regards, John and all of you
@apanalis
oh my, i’ve had enough with the bearish scenario. My advice is to jump on the bandwagon and ride the trend. Some people say we are only in the early innings og this bull market.
WHAT TREND!??? CAN YOU EVEN IDENTIFY AN UP, DOWN or NEUTRAL TREND?
like it or not, OBJECTIVELY, we’ve been in a DOWNTREND since the 3rd. That can change on a dime but can you tell me how you will know???? or are you just a parrot on the bull pirate’s shoulders hawking “bull market, bull market!”
xrt is mighty and unyielding!
Nicolas LMAO…….early innings…… over 5 years and 200%…………tell me you forgot the sarc?……….PRICELESS!!!!
Psst …. did anyone notice the VIX closed below 50sma? Bull Friday anyone?
duncan – do you actually have any money in this or is this just another video game?
http://stockcharts.com/h-sc/ui?s=$VIX&p=D&st=2013-06-07&en=2014-09-11&id=p02016516959&a=303385635&r=1410467442473&cmd=print
vix technical buy but last time it looked like this was early march before that correction…
AGAIN it is the top of a cycle and we have continuation failures all about like soft stuff in a pasture! all we have is trace of bull but no real bull stuff to be found! lol
Im long
the simple CIT indicators I posted today will either flip your way or not…easy peasy
Thanks for sharing John, good work. I am probably more bearish long term than anyone here. SPX 440 would not surprise me. So far however, the pattern has been correctly predicting the lows and highs. It predicted the low at 1903-1904spx, then a new high. The actual low was 1905ish SPX and we have seen the new high in 5 wave fashion. Next it predicted a wave 4 low at approx. 1984spx. Actual low so far is 1983ish. Now we should expect another wave 5 up to new highs. Probably in gap up wave iii:5 right now. Wave 5 may end near 2023ish + or -. Nobody can accurately predict the final wave 5 because they come in 3 sizes, truncated, normal, and extended.
I am super bearish, but the pattern says to stay long for now. We all want to jump on the “short” train, but patience might be a virtue for several more days. We might get a mid point measuring gap in the morning that will get us a little closer to predicting the final top.
Thanks again for all your hard work.
Appreciated
Dips are being bought folks, as Ken referenced earlier.
This does not suggest an imminent change of trend to me.
The path of least resistance appears to be up, for now.
Will the FED do anything to upset the consensus next week?,
highly unlikely.
Ukraine could flair up at any point, and as Duncan said
this is the bears current best (short term) hope.
Appreciate many others will see it differently
and I reserve the right to be wrong )
It is true that every dip has been bought back. I am not sure if this is considered a super bullish sign though. imho the Dow movement the past few days mirror the pattern in March 2000. VIX vehicles are also moving the same way like March 2000, whipsawing,. hitting bottom for a few weeks before the real spike.
FOMC meeting on 09/17 – another chance for the Fed to save the market. The sell-off, if imminent, might not happen until the week of 09/22 as the earliest.
Why the week of 9/22 erick ??
http://armstrongeconomics.com/2014/09/11/should-the-us-give-up-the-dollar-as-a-reserve-currency/
Armstrong’s array show volatility for Oct/Nov…still, today he says we may not get a correction and blast off into a Phase Transition. If this occurs I feel a peak will be more predictable…
I personally don’t trust or base my analysis on amstrong… He has changed his opinions quite frequently, more so recently.
Hi P. Here is my post a few days ago. The Feast of trumpets signals a major turning point. First day of the FoT will fall in on 09/25, the 09/22 week. This might either signal a significant top, or the major crash…
The bible says every 7 years God commanded for the Land to rest for a period of 1 year. The Feast of trumpets, 9/25/14 to Feast of Trumpets 9/13/15 is a Shemittah Year
The last Shemittah year was from Feast of Trumpets 9/13/2007 to Feast of trumpets 9/30/2008. The Dow topped out just after the Feast of trumpets in Oct 07, and the crash came the same week of the FoT in 2008.
The Shemittah year prior to 2007-8 was 2000-2001. The FoT started in Sept 30th 2000 and it was just right after that the SPX completed topping and started tumbling.The end of the Shemittah year was at the FoT in Sept 18th 2001, exactly 7 days after the attacks on 9/11/01.
With that said, I will continue watching with great interest and extreme caution the market development from 9/25/14 to 9/13/15.
If you panicked and sold in 1987 you missed another 12 year bull market…just pointing that out. So if this resembles 1987 why waste the effort getting back in?
Summation Index FALLING bearish
If this resembles 1987…those who panicked and sold missed another 12 year bull market. There is no mania in this market. CNBC has 20 year ratings lows. Nobody owns stocks, my neighbour isn’t telling me about his gains. Nobody is day trading at work. Margin data and NYSE Advance Decline stats no longer work, because margin data includes hedge funds that offer collateral off market and NYAD data includes ADRs, bond funds/ETFs and closed end funds.
So why bother timing the market, since this “one resembles 1987” according to John. If you ignores your brokerage statement for 6 months after 1987 you continued to ride the bull all the way to 12000.
This is the most hated bull market of all time and it peaks at DOW 32,000 and S&P 3600 and some will hate it all the way up and then say “I told you so” when it collapses.
This market most resembles the 1937 peak. Look back through a few recent posts.
http://davidstockmanscontracorner.com/when-the-algos-hit-the-sell-key-look-out-below/
http://wolfstreet.com/2014/09/10/goldman-sachs-lbo-volume-plunges-to-post-crisis-low-because-stock-prices-are-way-too-high/
http://www.theguardian.com/commentisfree/2014/sep/07/deflation-secular-stagnation-europe-economic-nightmare
The lower Euro will help, that is what the region needs
if the Euro itself is to sustainable longer term.
Thanks all. New post out.
This is an alert from the Rice Space Institute issued on Fri Sep 12 21:54:00 UTC 2014
Value of the Boyle index warrants Condition RED
Pretty sure the analysis I posted is right. Means John has this here. If that support breaks (what I think does not matter but I think it will) it’s all over baby blue.
Nice work Solar Cycle Blog!!!!! This is your time.
This is your time. Until this high gets taken John is 100% correct. Snap the rising support (1928ish today) and it’s all over baby blue.
Thank John, I don’t need to subscribe to sentimentrader.com anyomore.Even better
It does seem like every SPY dip is being bought. Quite frustrating to be short the indices, but meanwhile TSLA and other speculative stocks are tanking.
$NYADV:$NYDEC, and $NYDNV…are both instructive. Another bottom in progress. Shorters be careful. Don’t add more shorts.