

We have many historically reliable indicators of a major stock market peak in place: valuations, sentiment, allocations, leverage, negative divergences, risk-off money flows, all clustering around the smoothed solar maximum of April 2014. IMO, a compelling, cross-referenced real time test of the theory with too many angles all united as one, to question whether we are considering the wrong dominant cycle. If some other king cycle were at work with some peak in the future, then we would not have seen all those topping indicators and topping process characteristics coming to fruition in 2014. Rather, they would have only begun to form at at a later date. Therefore, there are only two possibilities in my eyes: either we are indeed seeing the last gasps of a topping process, or there is some other agent at work keeping price rising that is anomalous to historical peaks, namely the manipulation by a few big players fuelled by ZIRP-enabled leverage. With those two options in mind, here’s the latest picture:
1. US stocks to bonds and stocks to dollar ratios have tentatively turned down again, maintaining the downtrend since, and real peak at, mid-2014:
 Source: Stockcharts
2. SP500 is at rising resistance, whilst volatility, breadth and risk-off divergent indicators are at downward resistance. An appropriate point for a turn if it is to occur.
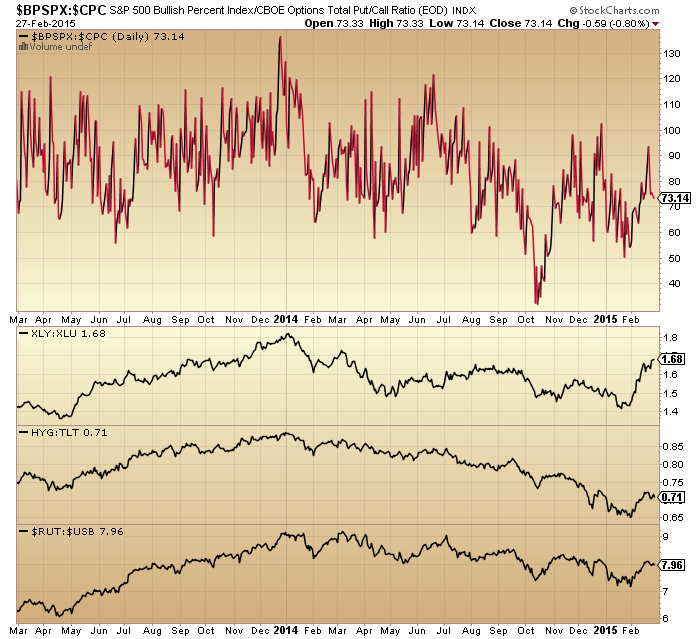
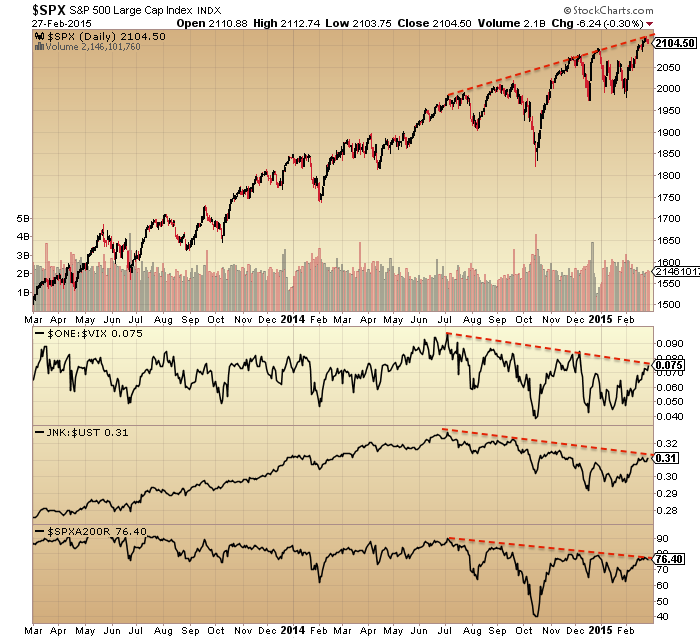 3. Four more risk-off measures below are in downtrends since the turn of 2014. Other than XLY:XLU they also give the appearance of turning down again at resistance now, keeping those downtrends in tact.
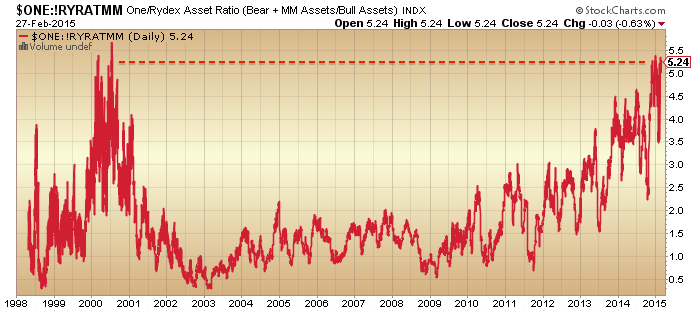
4. At the same time, Rydex allocations are back at their peak:
 5. Plus, investors intelligence sentiment is also back at its peak:

Source: Not_Jim_Cramer

Source: KingWorldNews
5. Fund manager allocations are back at their peak too:
 Source: Fat-Pitch
6. And NAAIM exposure is also back testing all-time highs, with 99% long exposure currently.
 All four of those sentiment/allocation angles suggest a correction should now come to pass, even if only short-lived or shallow. I’ve highlighted on the NAAIM chart that we previously saw NAAIM diverge before we saw a more significant correction – something to bear in mind.
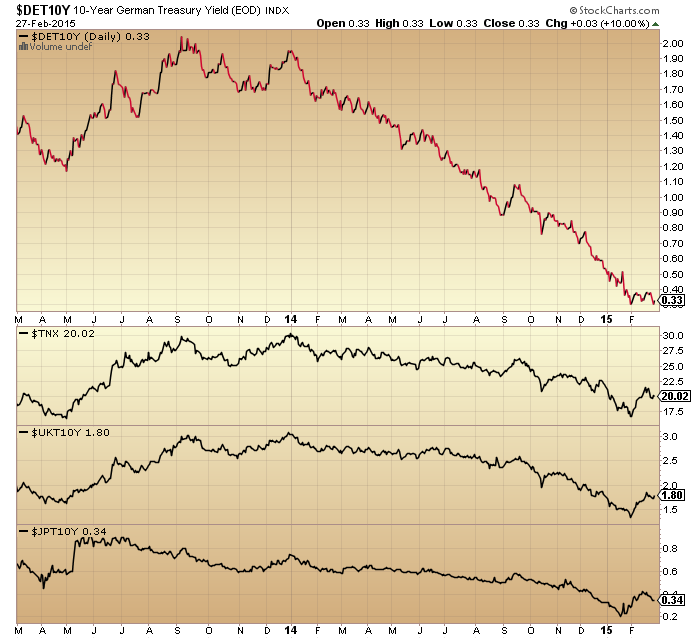
7. Bonds yields appear to be rolling over again, which would also fit with a stocks pullback.
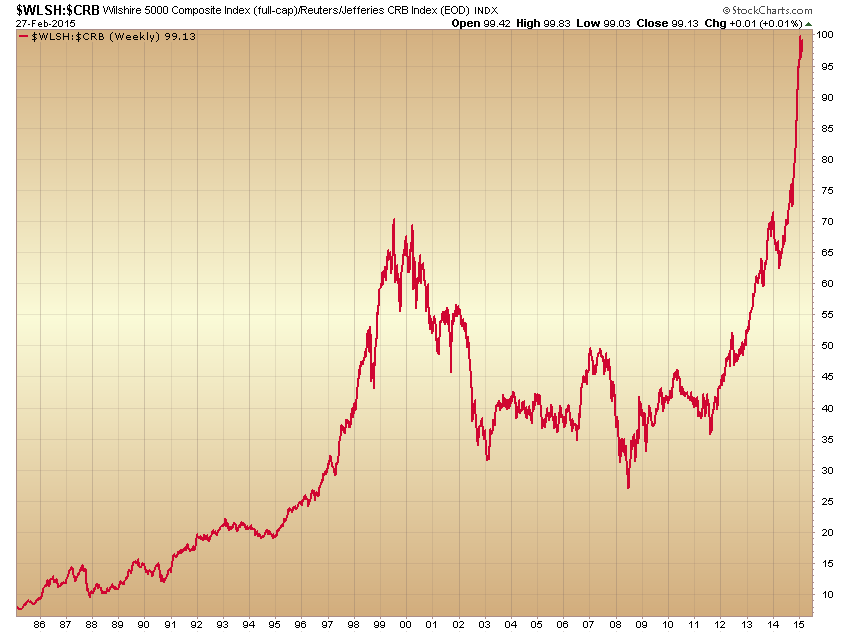
 8. Stocks to commodities, suggested by Simo, looks exhaustive and ripe for reversal.
 9. Margin debt declined in January, keeping the peak to date as February 2014. Meanwhile, leveraged loans have risen again and are well correlated to the Dow Jones World stock index, namely either at the end of a topping process or heading for new highs.
Source: DShort

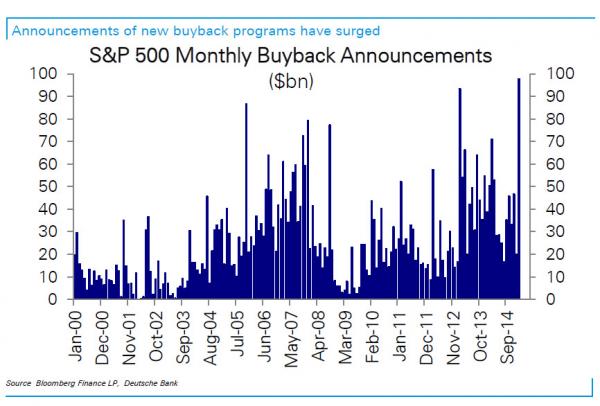
10. Buyback announcements, indicated by Allan, hit a new record. The previous spikes of start-2006 and mid-2013 corresponded to consolidation periods in the SP500, whilst the 2008 ones were contrarian.
Source: ZeroHedge
11. The negative divergence in earnings projections is shown in two ways here: arguing for a sharp correction in SP500 prices and the ushering in of a recession:


Source: Not_Jim_Cramer
12. There is downward pressure into the full moon of March 5 and we have geomagnetic storming in progress:
Source: NOAA
In summary, the current saturation in sentiment, allocations and exposure, together with what appears to be a renewed roll-over in various risk-off, breadth and volatility measures, sets the scene for a price correction in stocks, assisted by the twin negative pressures of lunar phase and geomagnetism. The triple fundamental negatives of earnings, economic surprises and leading indicators provide the justification, and the potential short term basing in gold and exhaustion in the dollar both cross-reference.
A price correction in stocks may or may not be ‘significant’. Cumulative advance-declines and NAAIM trend would both argue that prices need yet to continue higher whilst both make renewed divergences. On the other hand, a host of other indicators continue to pin us at the very end of a topping process that is 12 months old.
I’m going to start a short position again tomorrow morning playing for this correction. I opened long gold again already. We’ll then see how it develops: short and/or shallow, or increasing in momentum and more significant. If there is no correction and stock prices march higher, then by a process of elimination we can increasingly point to the historically abnormal: the dark pools and primary dealers. However, even if we assume an abnormally large influence on their part, they are still logical and self-interested. The case is strong for a near term correction or consolidation.

thanks John for the citation and thanks for your work, a good diary of the state of the markets people should read. This is the problem with central banks and money printing…obviously United States are not like Argentina, and Merval collapses despite of worthless paper printed by Argentina. The question is when and where a bubble will burst and it is very very difficult to say.
http://stockcharts.com/h-sc/ui?s=$MERV&p=D&yr=3&mn=0&dy=0&id=p17707404256
The gravity cycle gave an orthodox high early December. This was the end of the cycle that started in 2009.
A gravitational inversion changed the December high into a low and delayed the top to feb 27th. This date is logically and harmonically tied to major past changes. It couldn’t have been an other date.
I won’t call this a forecast but my analysis says that the trend is down deep into 2017/ early 2018 and the inversion has ended last Friday.
We’ll be down now into march 20th, with the first low on the 6th and a lower high Friday 13th.
Last weekend I said the Friday 20 low would lead to a high the 26th. My new theoretical inversion on Thursday pushed the high to Friday. So my gravity system with the new inversions is now razor sharp.
The first leg down in this multi year decline will come by the end of September (28/29).
Inversions can alter timing, but not change the trend. When a gravity cit is met by an inversion it tends to be a w3; the high in momentum. The inversion brings w4 and 5 with a gravitational divergence.
Don’t let yourself be fooled by inversions. The swing from the 2009 low to the 2014 high was 100% gravitational. Central bankers are not the cause of a w5; they are the result of it. In a w5 everybody goes crazy and bankers are as human as you and me. Thinking QE will support this market forever is simply not true.
Again; not a forecast. But John is right. The problem has been timing the inversion. And I have just done that.
The HC mars-uranus cycle gave the turn in February. As they are both slow movers, the aspects must be seen in a period, not a moment. A few orbs either side of the exact date gives a few weeks. So astrology confirms this massive CIT.
I have lots of other reasons that support this view, but I want to stop now.
Many people bullish so I’m either a fool or a genius ;-). Please hold your vote until September.
Cheers,
André
Andre, thanks. I am not clear on what your overall expectations are for the period between “march 20th” and “by the end of September.”
lion1
I post every weekend. I have given the timing for the next 3 weeks. Should be enough. Next weekend I’ll update the forecast.
Cheers,
André
Andre, got it. And appreciate it!
The end is nigh. You’re neither a fool nor a genius Andre, but you and John use various indicators that have historical track records.
When you read comments like this one from Valley:
‘Seems like Nicolas’ thesis that CBs have the reins on the markets leading to a permanently high plateau in stock values could happen.’
and you know that most market participants share this view, it can’t be long until the bull dies.
There is nothing new under the sun as far as markets are concerned, this time is no different that dozens of others.
John Hussman nails it this week too, worth a read of his update.
Thanks.
GREAT WORK ……. PROSPERITY TO ALL
Andre,
A few weeks ago you were looking for a low on May and a bounce into September 28th. Why have you now switched to it being a low.
I completely agree with you on its importance, it’s a major Fib/Geometric pivot.
Thanks.
I am just updating my techniques and learning all the time.
The inversion made me doubt – I am only human. Now I understand the inversion my faith has returned. My forecasts should become more stable.
do you have a blog/website Andre?
george;
Not yet. But have plans to start one this year.
Andre…if you are going to discuss a new concept to all of us that sounds interesting or intelligent, please be sure to include something semi-scientific to back it up. A simple Google search for ‘gravitational inversion’ turns up absolutely garbage search results. I’m a open minded person but I don’t buy snake oil.
Valley, they are some extraordinary index targets you
mention in your last post.
Possible if we enter a complete mania phase,
as per tech valuations circa ’99.
However I find anywhere near those levels difficult
to see, even allowing for a parabolic blow off top
earnings would need to begin trending sharply
upwards again.
I was quoting some websites that outline the bullish scenario based upon the 5th year phenom.. Seems like Nicolas’ thesis that CBs have the reins on the markets leading to a permanently high plateau in stock values could happen. Will try to swing trade the markets whichever direction.
Lunar Chord 5D:
Daily Seasonals: – MTW, +ThF
Depth of Tides: +MTWTh, -F
Distance/Apogee: on Thursday, -WThF
Declination: -MTW, +ThF
De Planets: no effects
Summary: No idea how to trade this. Seasonals and tides which are the most effective are at odds. Would expect a selloff on Friday as apogee and post high tide are pretty strong negative, though last day of first trading week tends to be positive. First time this month seasonals and tides are in sync is third trading week of March.
Hmmmm Valley……your
“. Seems like Nicolas’ thesis that CBs have the reins on the markets leading to a permanently high plateau in stock values could happen”
Remember Irving Fisher’s famous quote three days before the 29 crash?
“Stock prices have reached what looks like a permanently high plateau”
Thanks John.
The way I see things over the coming weeks is a period of weakness in March leading to a buy the sip event in April to what I believe will be a significant top in June with bearish multi week action ensuing into the end of the year.
Cheers
Daniel
https://www.twitter.com/tradingtweetPRO
Thank you John.. and Andre…and all others also…n
In 2000 we had the dot com crash, In 2008 the bank melt down, wondering which sector will lead the next melt down? social media stocks?
if you look at the biotech indexes, they are textbook examples of parabolic rises.
i would be looking in their direction for the real melt down.
I haven’t posted in several weeks. Today’s spaceweather.com is reporting that something unusual happened with this year’s Southern NLCs.
China’s CB cuts interest rates again that take effect today:
http://news.yahoo.com/chinas-central-bank-cuts-rates-again-boost-economy-104642203–finance.html
Also note that Macau (Chinese) gaming revenue is collapsing.
China’s PMI shrinks for second straight month:
http://finance.yahoo.com/news/china-feb-official-pmi-contracts-011430612.html
These week could be exciting as many CBs will meet and many of those are expected to cut rates. The week will end with the American NFP that could “focus” on wage gains and not the usual employment numbers:
http://finance.yahoo.com/news/ecb-braces-qe-others-shift-091552346.html
A very good post, John… Thank you…
As to my current market thoughts, here’s where I am…
My trading system is still at 100% long, from an average of SPX 2027…
The oscillator components of the system are all on sells, the moving average components are still long, but starting to weaken, and the HY bond components are still long and strong…
I’m actually pretty surprised by how the HY area of the market has literally been a straight line trekking higher since the beginning of the year…
Barely even a “little” squiggle in it’s rise…
Still, I think that’s a good “canary in the coal mine” for the market, so when that rolls over, I think we’re done…..
That said, I’m personally holding shorts, and added to them Thursday/Friday…
Some very short term indicators I watch are 4 out of 4 short, as of COB Friday..
2 of the 4 went to sells on Friday, the other 2 a few days before…
Also, the RSI and Money Flow indicators I watch are collectively starting to roll over, from generally very elevated levels, on chart after chart….
T-bonds are looking like they want to turn up here, and I just can’t see why anyone would want to be long the refiners at their current levels….
Energy stocks, in general, look like they are starting another leg down, but refiners look like an accident waiting to happen….
That’s all I got this morning…
Hi Barry, I agree on the refiners. Lot of sheeple looking there for trades.
As i understand the situation, there may have been/is intent on the part of the producers to cheapen oil prices to the point that the 42 year old laws preventing oil exports will be repealed. Certain companies have been allowed certain liquids exports prior to this year, and i have heard that so far in 2015 most oil companies are exporting oil and/or liquids that have been only slightly refined in a test of the law. And the administration has chosen not to prosecute.
Seems like a recipe for higher gas prices in the U.S. even if domestic demand falls.
here is my trading chart of refiner VLO,one of my top ten stocks to trade for swings.. in at line out at largest target line…. making visual why caution warranted in refiners
http://stockcharts.com/h-sc/ui?s=VLO&p=60&yr=0&mn=11&dy=0&id=p40796434596&a=345656694&r=1425296399024&cmd=print
http://stockcharts.com/h-sc/ui?s=VLO&p=15&yr=0&mn=0&dy=6&id=p96776378409&a=338426126&r=1425297058136&cmd=print
Nice to see ur pitchfolk charts what other stocks do you swing trade
Crude and the Dax I reckon Barry
are the current two key indicators.
If crude is on the cusp on a renewed move
lower equities will find it a challenge to
remain around these levels imv.
The reverse of this with renewed strength
in commodities is likely to provide a platform
for solid further gains.
Opps, I think I see a grey swan approaching at speed. Just out a few mins ago.
http://www.reuters.com/article/2015/03/01/austria-heta-idUSL5N0W30OR20150301
http://www.zerohedge.com/news/2015-03-01/spectacular-developments-austria-bail-arrives-after-€76-billion-bad-bank-capital-hol
Thanks John…………and here we go. I said when the SNB peg was removed that there would casualties and it could take many months before it began to really unfold…….Austria’s bad bank in a big hole!
Hypo in a €7.6B hole and creditors will be forced to contribute in the wind down……..
http://www.reuters.com/article/2015/03/01/austria-heta-idUSL5N0W30OR20150301
35-40kDOW is an absurd assumption that would price the DOW at over 6 X it’s 29 peak and 2.5 X it’s 2000 peak in inflationary terms.
It would mean yields were effectly under 1%.
Certainly bond yields are worse but given the deflationary cycle underway a doubling of the DOW from here by 2017 is impossible!
“This strongly suggests that the US share market will make new highs after 2015.75 on a capital inflow.” This quote from the Martin Armstrong blog supports the Nicolas Thesis.
Ahhh the man whose name I said I would never mention again rhat has thrown out there pretty much every conceivable scenario possible which thus guarantees he will be right…..and boy will he let the world know it.
Whose the man?
If recent history repeats, a drop to 13EMA, then a weak bounce to be followed by a dive. Watch the internals. Watch $NYHL, $NYADV if they would fail to support the longs.
I took all my profits I can and started a scout short position last Thursday. Watching and hoping the above scenario will play out. A correction is welcomed because there will be a bottom to be bought. Ride the waves.
No one knows the future but the odd for an correction has increased.
$SPX to $SPXA200R negative divergence since December may play out.
Far too early to call a definitive turn, but watching the 4-week MA of initial unemployment claims closely…
http://research.stlouisfed.org/fred2/series/IC4WSA/
Very interesting timing – US unemployment bottoms 5-9 months before the true solar max (see 1968, 1979, 1990, 2000 in your graph).
The ISN (monthly mean sunspot number) is getting close to the bottom of its plateau. I personally think it is likely to bounce from here, temporarily (for a few months). http://www.solen.info/solar/images/cycle24.png
This plateau continues to develop similarly to those of SC1 and SC16. Compared to SC16, the SC24 ISN highs and lows are mostly in sync with a couple of inversions. For SC1, they are mostly inverted but the timing is still remarkably similar.
Looking at the other most similar cycles to SC24; they are SC1, 16, 12, 13, 7, 10… There was speculation associated with all of them (especially 16, 13,7 and 10) but unfortunately market data from those times is limited. In all of them, speculation continued beyond the SSN (smoothed max), as it has this time around.
So expressing the market peaks from those earlier cycles in terms of SC24, we have:
SC1: late 2016/ early 2017
SC16: September 2015
SC12: July 2017
SC13: November 2017
SC7: February 2016
SC10: June 2017
If history repeats, then there is lilkely to be some time to go before excess speculation finally recedes. But the comparison is not that simple, because the volatility was massive in most of those comparable cycles, involving intervening falls of 12% to 40% before the final market peaks at the dates shown above.
So on that basis we are likely to see a large fall and subsequent rally in US stock prices, or several of them, over the next couple of years.
Due to all the CB activity this week along with a change of “focus” to the wage gains instead of job creations in this Friday’s NFP this week could be the just the beginning of the parabolic blow off top that many are expecting.
I am now looking for the “top” in the S+P 500 index to be in October, 2015.
Mark,
When was the market crash for SC7? I don’t even see one.
Thanks in advance!
There was no crash then John – there doesn’t have to be a crash, but there was definately volatility during those similar cycles. During SC7, Dow reached a high at the second SSN peak July 1830 (equivalent to February 2016), then fell by around 14% (significant, but not exactly a crash) until the equivalent of August 2017. Then it doubled until February 2021. These dates are all notably similar to Gann’s Financial Timetable. During SC13, the mid-solar max fall was -40%
In most of those previous similar solar cycles, stocks simply continued higher after the solar max-induced volatility, SC16/1929 being the notable exception. I’m sure most people will be thinking, well, its different now to then – these are the same people who normally laugh at “its different this time”.
So what could cause stocks to sell-off by 12% to 40% (or more) during 2015/6, followed by massive surges to new highs out to around 2021? Almost everyone is now sceaming about deflation – apparently convinced that it will cause the world to collapse, and feeling that it will continue forever. A prudent investor should now be starting to position for the next unexpected: the return of inflation. When it gets going, very likely in the second half of 2015, it will quickly get out of control (given the amounts of artificial paper having been created, and the public’s accelerating loss of faith in those they elected to serve them).
Government bonds crashing. Stocks not knowing where to turn at first. Gold prices heading skywards. And not too long to wait now…
I agree on SC16, but I either have different dates for the market peak or I am using wrong dates for the ISN peaks. Definitely agree it is hard to find the comparisons before 1900s. For SC13, what are your dates for the ISN and market peaks?
“Stock Prices Have Reached What Looks Like A Permanently High Plateau.” Irving Fisher In October of 1929.
http://ibankcoin.com/bluestar/2015/03/01/stock-prices-have-reached-what-looks-like-a-permanently-high-plateau/
Just watched a documentary on ABC Australia about the abhorrent working conditions of Chinese workers employed by Apple contractors.
Certainly Chinese workers don’t have to work from 8 am in the mornng until 2 am 7days per week, but Apple also doesn’t have to make over $260 per iphone and then pretend that they are squeaky clean.
I won’t be buying another Apple product ever again.
I agree with your sentiments on this. But the follow on question is this: What will you buy? Don’t almost all multi-nationals employ cheap [slave] labor overseas and then keep the lion’s share of profits for themselves, their corporate execs and their share holders? What products are NOT made in China or other Far Eastern countries these days?
Richard not you now as well, looking
for a final high bull market in Autumn ’15.
My guess, which is all it is,
is becoming more popular by the day.
There is too much “faith” that low gasoline prices will be a boon this Northern Hemisphere summer for “panic” to grip most stock players at this point in time. With steady low gasoline prices it is proving difficult for “panic” to set in and selling to begin. Some are calling for the low in Crude to be with the May futures last trading day. Gasoline prices will fall again for two reasons, renewed selling of Crude, and refineries coming back on line after seasonal maintenance is concluded.
I think that religious “faith” in what low energy prices will due for the economy this summer will keep stocks moving higher until that religious “faith” hits the wall of reality in October.
I don’t go short markets or individual stocks,
as find the short side very difficult to call precisely.
With that said if I did, might to tempted to try
a cheeky short on the UKX around here 6970.
Disagree, the reverse is more accurate imv.
Another lurch down is crude will stoke deflation
and slowing global growth concerns.
Renewed strength in commodities has the opposite
effect forming a platform for equities to trend higher.
It’s earnings that are key to the next bear market imv,
crude is only one of multiple factors continually playing
out in the background.
Phil, it looks like you’re arguing with yourself! 😉
Re the oil price decline, one only has to look at the US spending/savings rates recently announced. Households are saving more, rather than spending the money they’re saving on fuel.
In isolation, that’s sensible behaviour for a household, but apply this across a large part of the planet, and it’s a disaster for the economy and profits. The irony of the house of cards that has been built since WW2.
This was only for fun – I mentioned earlier that
the UKX looked like at short when trading around
6970, you could now close that out at 6930 approx.
That’s a one off post, will leave the precise timing
to others.
only 9 points to go on the NASDAQ
Chinese rate cut highlights the danger if someone were totally short.
Not an impressive rally (yet). Watch if it will fail. Meanwhile, more profit taking. A nice gift from Mrs. Market.
Annual growth in personal consumption (70% of GDP) 3.4%, the highest in more than 8 years
https://twitter.com/ukarlewitz
Can’t give up on the long side yet. A dead scout short is OK for me.
NASDAQ 5000 POINTS !!!
Congrats to everybody. Well done ! Big party tonight.
When does the bull train take a breather?
Excellent, Nick. I assume you’ll be hosting?
Multiple posters were expecting pronounced
weakness this week.
Why would you attempt to short US markets
currently with the flight to safety trade in full swing.
The UK General Election is now looming large,
the UKX looks the market to short if you are so
inclined, a nice opportunity earlier today as per
this morning’s posts.
Thank you for sharing. The pattern appears to be in a wave 4 correction right now. A wave 4 that is probably not completed. The SP may drop a bit lower to 2080’s or 2090’s, ( to complete the wave 4), then one more impulse leg higher. Eye-balling the chart, we should expect the final wave 5 up to target the 2140’s or 2150’s. When we can count 5 waves up from a wave 4 low ( low probably seen on Tues/Wed)., then we should be able to short the SP ( long term) with some confidence. Kindest regards.
Short term I just took profits and just went short the USD. I will look for a “dip” or pull back to reposition. Consumer Spending was lackluster and Crude is trying to go higher. With lackluster Consumer Spending, Gasoline needs to decline to new lows to reignite the “animal spirits” (revive the HOPE) to push stock prices ever higher to October that, or, something else such as positive news out of the Eurozone.
Purvez. Let’s compare notes again. Nasdaq has tagged 5000 so my w5 count has been completed. Now I am expecting a reversal, then an impulsive wave down.
I had thought the Nasdoq would have tagged 5000 last Friday. Now we are at a crucial point, whether this move will be an impulsive wave down; or a bubble phase up to 5100. Either way, I see very limited upside from here, and lots more downside.
Erick, your Nasdaq 5000 was a good call. Congrats.
Since I’m a DJIA ‘person’, today’s new ATH has me confused as the previous decline was no where near big enough for a w-4. My immediate thought is that this new ATH is a w-b inside w-4. If that is the case then we have a w-c to go down further. w-c waves look very much like impulse waves but then reverse and go to further highs.
I haven’t looked at it in detail enough so I’ll hold further comment till later.
I now see the “threat” as a change in the “narrative” that “growth” is going to be seen as lessor in the USA and greater in the Eurozone. This doesn’t mean a USA stock crash but an Intermediate to Medium swing high along with money flows out of the Dollar into the Euro (for a while).
Note the “topping process” of lessor USA “growth” of its GDP combined with falling “consumer spending”. What this means is that the bubble of “hope” is deflating (for at least a while) as it concerns the USA and could be moving to the Eurozone (for a while).
I do not see an imminent world wide stock crash…..yet. I still look for USA stocks to top this October as “hope” for the USA will revive latter this Northern Hemisphere Spring when energy prices crash all over again.
Honestly, where is all the talk about last year’s USA unexpected decline in GDP for the first Quarter due to last year’s Winter with this year’s Winter being worst than last year’s Winter? Why isn’t there talk about expecting the American 2015 first Quarter GDP to decline more than the first Quarter GDP of 2014?
This week’s action by the ECB could easily see “hope” move from the USA to the Eurozone especially as the reality of what this year’s Winter has most likely done to the USA economy when nothing is being done to counteract it. There could be economic damage to the Eurozone by the Winter but it is going to be counteracted by ECB policy changes which is what will see “hope” move there and away from the USA –in the short term.
Not only could the expected action by the ECB latter this week be the “trigger” but so, too, could new all time record snow falls for Boston which could happen the very same day. New all time record snow falls for Boston could set off the reality that this year’s Winter will cause greater economic damage than last year’s Winter did in the USA. This could be a double barrel shot gun advent wherein both barrels are fired off at the same time for maximum effect (and a major swing top in USA stocks and the USD).
The DAX is currently Up over 16% YTD,
the huge outperformance has already happened.
It looks to me that March is going to be a bad month for the USD and US stocks but a good month for the Euro and Eurozone stocks. I kinda expect another V market sell off and bottom in US stocks (bottom probably in April) after the first Quarter GDP numbers are released. This event would also occur before heavy deliveries against the expiring May futures energy contracts that have been predicted by some to coincided with the year’s lows in Crude. (Recent heavy deliveries against the expiring World Sugar futures sent Sugar to multi-year lows for the front month futures plus one. The same has already been predicted for the May energy futures.) All this also points to an “inversion” of the ole adage “sell in May and go away”. Wave counts invert all the time but Cycles seldom ever invert and when they do the moves tend to be incredible.
Europe is very attractive with 60B+ per month in printing. Canada would be my next idea. Their central bank is cutting rates and will probably announce a QE program soon. Japan should continue to perform well as their central bank is officially buying ETFs to drive the market higher.
All in all, I still maintain my excellent outlook on stocks, based on strong central bank buying.
The time has come to take the money off the table and get the hell out of Dodge. Europe sounds like a great place to be for the next six weeks, or so, until the dust settles in the USA.
Hi Richard ! Well, I disagree. Europe is very well positionned in my opinion. Rates are negative in many countries (germany, Swiss bonds etc…) and we have strong buying from the central bank. I think we should increase exposure to Europe right now.
US stocks will continue to do well, but I’d like to see a little more printing from the FED. I hope will continue to see poor economic date and poor earnings so that the FED will be forced to print more.
I think that another V pattern sell-off in USA stocks is going to soon happen that will recover and go parabolic to October as the seasonal/cycle adage of “sell in May and go away” does in inversion that will be part and parcel of the parabolic blow-off top that I think is going to happen later this year.
http://finance.yahoo.com/news/why-smart-money-bailing-bull-110000874.html
traders trade…i showed the test and retest that set up on Friday
results
http://stockcharts.com/h-sc/ui?s=VLO&p=15&yr=0&mn=0&dy=6&id=p96776378409&a=338426126&r=1425322540132&cmd=print
amazing day again. Records for IWM, QQQ, DAX. wow ! very impressive ! I saw very strong buying by the ECB today, especially in Europe.
HYG (high yield) is underperforming though. Hopefully, the FED will correct that and put in some buy orders to drive it up.
OMG …. LOL
I’m a little embarrassed to use those acronyms but their perfect
I’m laying on the couch nursing my broken tail bone
And my wife is wondering what the hell I’m laughing at
I wonder if anyone with access to a Stockcharts subscription might be interested in monitoring and updating this chart on occasion (via ScrewTapFiles Blog):
When we see the descending trendline hit, it should signal a bottom in gold.
(And perhaps a top in stocks too).
It doesn’t get updated often at STF.
Thanks.
the pattern in circle is one of the oldest i know
rapids and waterfall
http://stockcharts.com/h-sc/ui?s=UVXY&p=5&yr=0&mn=0&dy=3&id=p89932906871&a=337841009&r=1425331725742&cmd=print
technical traders just try to do what has worked countless times before
the” 3 harmonics trade” shown here before(close proximity of gann,fib and lines from medianline set or sets) note again how price ran past the 1st two until it had kissed all 3.
off a swing low, the ideal retrace is an abcd that completes at fib.618 at x- marks the spot….followed by the 886 algo trade trigger
on friday’s close every tool in the tool box said short bonds long TBT..
CLASSIC TECHNICAL SETUP
http://stockcharts.com/h-sc/ui?s=TBT&p=5&yr=0&mn=0&dy=4&id=p19805269752&a=337816926&r=1425333869136&cmd=print
John,
From an Elliottwave technical analysis perspective, I’m focused on the Thursday full moon. It seems to fit with all of your hard and exhaustive work.
And here’s why:
1. The NQ (emini futures) has almost completed an ending diagonal, a 3-3-3-3-3 affair. It’s even done a “throw-over,” but will need one more up/down sequence before a reversal, which is usually sharp with these patterns. Both the NQ and ES are weak already tonight …
2. Major US indices are in the final fifth wave. Same situation. I’m expecting a smaller 4th wave drop tomorrow and then a final 5h of 5th up.
3. US indices completed a fourth wave triangle at the beginning of Feb. This pattern signals the end of a trend is on its way.
4. The dollar is about to reverse, as is the Euro. I’ve posted a chart of the Euro, showing the very small 4th wave triangle it looks like it will complete perhaps tonight. I would then expect it to head to the previous low before the bounce, which should send the US indices down.
5. And then there’s gold (GLD). It’s a little dicier. It did 3 up, which usually means a retrace. So it’s a crap shoot at the moment as to whether it comes down to the previous low before heading up (but this will be a countertrend move, so expect it to eventually head back down below the previous low eventually (didn’t include this chart).
I’ve posted these charts at http://www.worldcyclesinstitute.com/charts-for-the-upcoming-turn/
Let’s hope the magic starts later this week.
Peter
Peter,
Thanks; great post.
André
Is an E wave of a sideways triangle underway for the Yen that could end up being a “throw over” meaning a substantial rally for several days or weeks just getting started today?
Weekly trend lines of life-of-contract charts for the April, 2015, Gold futures doesn’t look promising for a new rally in USD based Gold but for a break to new lows. This is regardless of a declining USD which could be a real surprise for many (such as John).
I should have said “C of E” is just getting started as the “B of E” appears to have ended. If it is, then who knows how far the “throw over” could be before the trend to new lows reasserts itself.
Wow, incredible, utterly amazing; how else do you put it? It looks like that the rally of the Yen in a “C of E” has caught the metals Bulls by total surprise and a metals washout is breaking loose this evening.
Major Yen rally underway?
http://www.bloomberg.com/news/articles/2015-03-02/barclays-calls-for-japan-to-shift-weak-yen-burden-from-workers
I am not sure the $ makes much difference,
as the majority of this current bull market
saw a weaker US currency.
However re Peter’s above post I notice that
many of the EWT guys on various sites are
flagging up an imminent sharp drop in equities.
Let’s see how that develops.
The UKX again provided a decent shorting
opportunity this morning.
This may be the index to look at for a short
position IMV.
EUR/USD: Sell the rumor; Buy the fact.
The record in Japan for open ended money creation is that it did help the economy and caused 1 to 2% inflation. In fact the momentum of the economy, inflation, and stk market continued for several months afterwards just as the US appears to be doing now. I am a long time big time $ bull and think the actual EZ Euro will help the $ until after Euro CB stops buying. Buy the rumor, sell the news is frequently good advice but this is not a one time event, it is ongoing.
This stock mkt is brutal for us bears. Buying on the first day of the month can just be technical. What weird thing is happening to keep this market going up in spite of all the sell signals. Up until last month, it had the credit cycle positive, but it has now given a sell as a deflationary spiral has begun. The other is capital flows. Every CB but the FED is lowering interest rates and creating debt money. Therefore, huge amounts of money are leaving those countries going into the $ causing great strength in the $ and other investments in the US (stocks). Germany is issuing negative yield bonds, Ours are still positive plus the Euro is beginning a large Euro creation. One would think that this would have just about run its course. One would think the big in the know money would have already moved.
Macau’s casino revenues down almost 50%. Doesn’t that say the salad days are gone and the Chinese are hiding the collapse? Tesla has done poorly there, also. If it was still like the US 2000 dotcom and 2006 housing bubble, all these things would be flush, not wilting.
Kent, interesting posts.
I think the answer to your central question
is ZIRP causing a need for any type of yield,
that remains unchanged.
Earnings with growing dividends have provided
firm support, there are signs emerging that the
outlook here may be starting to cloud,
however this could prove transitory so would
not be keen to make further assumptions at this point.
Most regardless of positioning would agree that a China
slowdown appears underway.
This is at least partly intentional with measures taken to
drain some liquidity from the shadow banking system,
and China’s continuing transition to a more consumption
led economy.
China’s huge rates of year on year growth can not by its
very nature be sustainable longer term.
So we may just be witnessing a transitional period,
without some imminent collapse.
Phil you are right. Even though China’s year on year growth was unsustainable the ‘key’ was that it was a SUPPLIER.
For global growth we have to look at the DEMANder(s). Both US and Europe are struggling to fulfil that role. I can’t think of where else that role can be filled from. So in short order we are going to see some ‘realisation’ of reality.
At least I hope so. The more I think about it the CBs QE has been a side show and whilst interesting whilst it lasted, reality is a far far more riveting spectacle.
You may be right about transition, but 50% drop sounds as if collapse underway.
Macau casino’s past revenue growth had a lot to do with money laundering and corruption. The deceleration is due to crack down.
Gamblers used to sign an IOU in China. Cash in their winning at the table and ship the clean money to buy real estate in the US, Canada……and they paid their gambling debts in China. This trick circumvented all the currency export restriction.
Some gamblers broke the rule by refusing to honor their IOU while the Chinese government doesn’t protect the debt holders because gambling debts are not legitimate and enforceable in China…..You see the mess? lol.
You may want to focus on China’ over-capacity instead. But that in itself is no license to short either. Why? China CB easing tricks are short killers.
China stagnation is real. Just know it. Avoid it.
PS. China has 1.3 billion people. It has built enough housing for 3.4 billion. There are empty hotels with light turned off. Presidential suite for USD $35/nite.
China’s private is the problem and it follows the same path as Japan.
End of discussion.
Specie: Sorry to hear that you broke your tailbone… Ouch!!
Rest comfortably….
Or, as Nicolas would say, “You are welcome for my analysis…” 🙂
Thanks man.
things like this make you really appreciate all the good things/people in life
boom, in one second, a lot can change
current technicals
http://stockcharts.com/h-sc/ui?s=TNA&p=15&yr=0&mn=0&dy=4&id=p33951718599&a=338711245&r=1425401675949&cmd=print
at the lows,price was pushed to the targets given by tools…
technical traders covered….
now we see if something bigger is afoot
http://stockcharts.com/h-sc/ui?s=SPY&p=15&yr=0&mn=0&dy=5&id=t45276999297&a=338702695&r=1425401880107&cmd=print
An update for Nicolas’ recommendation for me to buy IBB:
Purchased at 338, currently at 334.58.
Nicolas, let me know when to add, sell etc ok?
Thanks
J
as a target trader
when the tools say it is time to go
it is time to go
http://stockcharts.com/h-sc/ui?s=NSC&p=15&yr=0&mn=0&dy=14&id=p31645197789&a=396443289&r=1425402327114&cmd=print
This is just so contrived. Surely it wouldn’t be as blatant as this?
What is so blatant?
John, all the talk and hoopla surrounding the Nasdaq hitting 5k with analyst after analyst stating that 5k would be a obvious level for a pullback/pause.
It just doesn’t feel right, but then again that may just be what’s needed…… Scepticism.
I am on the same page — I think we touch 5k again this week. But touch is the operative word. 5050 is probably the highest I can imagine.
the vix traders use their computers to move the indexes to reach their pivot point goals…. the last spike in SPX was needed to get to get uvxy to R3…..
http://stockcharts.com/h-sc/ui?s=UVXY&p=5&yr=0&mn=0&dy=3&id=t21977951163&a=337841009&r=1425403510149&cmd=print
Hmmm the round trip from yesterday to today reminds you of taking the ‘scenic’ route. You continue on your original route only with a detour.
I could have done without that unnecessary detour myself, particularly as it was not a very pleasant one for me.
Ok so now I need to continue charting my course forward.
Specie hope you recover soon. Doesn’t help to have your coccyx out of joint whilst the Yellen is roaming around. Lol.
We got the wave 4 dip as expected, but now the bears must be careful. There is a chance the wave 4 bull flag finished at the 2098ish spx low. It looks like one more dip is needed, but 5 legs down “can” be counted if the 5th wave extended slightly.
The final wave 5 up should take the SP to the 2140’s. Maybe a bit more.
Sorry GN are you expecting this pull back to be reversed to another new high? My 2 brain cells need some clarification please. Many thanks.
Oops sorry GN I read that as 2040’s in your penultimate sentence. Poor eye sight as well as 2 brain cells only. I’m going to get the begging bowl out soon. Lol.
Hi Purvez ! You have more brain cells than I thought. This pullback shouldn’t last too long. It was very predictable after the nasdaq touched 5000 points. So don’t worry and keep adding.
Thx Nicolas. I have added.. I’m stuffed to the gills with shorts and I’ve got plenty of time left for them to play out.
So kind of you to be concerned about me. Hope your ‘fizz’ was Ok and I’m truly sorry you ended up paying over the odds because I was bidding.
BTW I’ve found another fizz which is MUCH MUCH nicer. It’s called Dom Plonkingnon. It’s affordable to quaff daily which I very much like. Of course it may not be up to your ‘high’ tastes. I would however recommend you give it a try.
Sometimes the ‘plebs’ get it right too you know.
I googled Dom Plonkingnon and found no articles. Is this a factitious beverage?
Valley this one is special for people like Nicolas. 🙂
Purvez do you understand when you have been insulted or is it a case of turning the other cheek?
Allan I really DO have only 2 brain cells!! Nicolas for some absurd reason thinks I have less than 2. 😉
Guess it takes one to know one.
For the more budget minded there is always Charles Shaw at Trader Joe’s which sells for $2.50. Hence the name “two buck chuck”.
$NYHL must goes negative for bears to thrive.
A rotation into oil sector to pump the Market will destroy all shorts. Be careful. My scout short position is up only a few pennies. Lol.
Does anyone here see a H&S developing on the DJIA? IF it works out we are looking at another 140 point drop from the neckline for the DJIA.
For those of you that don’t (won’t) have S&P to DJIA conversion tables that is a 2084 marker on the S&P.
Hi Purvez, I see your H&S on the dow but in my experience the H&S usually are more dependable on weekly or sometimes daily charts, not on 5 or 10 minute charts.
besides, i’ve seen hundreds of these develop over the last few years with only handufl leading to any kind of decline. The strength in the biotechs this afternoon after a weak morning would tell me that the chances for weakness here are slim.
but here’s to hoping your right and my skepticism is misplaced
Yes Specie, sadly you are right about how often this particular pattern plays out.
Aah well I’ll just keep monitoring for that elusive drop pattern.
Hope you are feeling better. How did it happen….if it’s not too personal a question?
Hi Purvez, i’m glad to share if it prevents something similar happening to somebody else. Even though i am 55 i tend to take stairs fast both up and down. My son left some papers on the top step. I stepped on them in the dark and the next thing to hit was my tailbone on the sixth step down. Hit so hard i had a slight concussion. No real treatment other than muscle relaxers, pain relievers, rest and future rehab. I did learn how to spell Coccyx though.
no complaints, though, just thankful that it wasn’t worse
and no yelling at my son because i stick crap on the stairway too.
be careful out there
Aaah Specie, you are a spring chicken my friend (lol)….but yes let’s just be careful out there.
Just wanted to mention that, after crossing to bullish at the beginning of February, one of the charts Banned By Elvis – BBE – used to post, just went negative…
http://stockcharts.com/h-sc/ui?s=$NAHL:$NATOT
I have no back-test or anything like that on it, but thought it might be worth mentioning…
Miss that dude sometimes….
Hope he’s doing well, whatever he might be up to these days…
Yeah, what happened to him?
EUR/USD: Daily double bottom with late January?
Really do not understand your bullishness
on the Euro.
We have clear deflation in the EU, the QE
measured announced are inconsequential as
a % of Euro area GDP, it will do sweet FA imv.
What will help is a lower Euro,
and the weakening of the currency is the real aim
here imv.
looks like Barry’s little H&S top executed
Hi Specie;
Nope, not me… I’m not a H&S player, myself…
Looks like your pain pills are kicking in!… hahaha 🙂
But seriously, hope you’re doing a little better….
That said, unless the market can get some legs back to the upside very soon, I can see how my trading system can issue a sell signal in the next day or two….
DON’T get too excited, anybody, because there’s a lot of trading to do in the next two days, but the weakness in HY is becoming enough to cause the trigger to be pulled here very, very soon… Just a heads-up…
GL
Barry,
you’re right. good excuse those pain pills.
purvez H&S
but with BTK reversing and sporting a >1% gain
the downside is probably done for now, who nose
Hehehe Specie, ‘laughing gas’ time…or WCCG as BB Elvis would say. On the micro count I’m still looking for another lower low than 18025 on the DJIA, although I suspect on the S&P that may not happen as it is already considerably weaker than the DJIA and may have made it’s low for this wave.
$NYHL currently at +11. It must go negative (may be tomorrow?) for my scout short to thrive.
$NYADV currently at +619. It is giving a warning to the longs to get out if the market (typically) would rally back above the 13 EMA but fail.
There is hope for the shorts.
Riding the market waves.
Focus on the internals. Mrs. market has her own logic and reality. Play her rules and forget about the macro-econ. and what the market should do.
Took profit on my short when $NYADV rose above 750. The start of a meaningful correction would not have allowed it.
Good call Newt. You never know where a correction will retrace to. Best to take what’s been handed to you. Can always send out another scout later. eh?
My scout wears many layers of toupee to stay alive.
Newt, your scout is very brave!! 🙂 Hope you reward her/him well.
Erick, do you have a target for where you see this down wave going to, please?
Hi purvez. So far my SPX and Nasdaq counts are still validated. However, the BTFD still rules, that I would consider a recount later this week. Let’s see how this week pans out.
My March low target remains the same, 5%-7% from where we are now. It might take until the end of the month to get there though. I don’t think the Fed would let this rubbish corrected by more than 10% though. 🙂
On another note, an “impulsive” wave down I had expected is not happening right now, so that is definitely a concern. The BTFD is alive and well. I don’t think we’ll see Nasdog 5000 again this week.
Gold is a crapshoot right now. The bounce is not happening. Instead, we might see a wave down, an intermediate cycle low from here????
Erick thanks, that’s quite a target for the month end. Are you just happy holding through the volatility or do you bother to trade the intermediate waves?
Apart from my own count, currently Andre’s target of a low on Mar 5 with a lower high on Mar 13 (writing all this from memory – 2 brain cells only) and then a significant low towards the month end appears to be a good call. It matches what I’m expecting as micro wave counts as well.
~Thanks and take a bow Andre~
Thanks purvez. My 1 brain cell and my count indicates a short, so I am holding short right now. Might hold through the retraces, depending on how strong the BTFD or the potential reversal would be :). I will not go long until the intermediate cycle low is observed.
Yes big thanks Andre.
I have some tramadol, but use for emergencies
only.
Specie speedy recovery.
It must be a sign of my innate caution that
I grab hold of the banister on the way up
and down, as I have try cats that like stairs
it pays to be careful )
three cats – I could really benefit from an edit function,
or perhaps more attention to detail!
Excellent work by the central banks to pump markets back up today. There is no room to be a bear in europe. Long on dax from 11300 and waiting on the easy ride to 12,000 by end of March.
getting close to time to decide@1758
http://stockcharts.com/h-sc/ui?s=UVXY&p=5&yr=0&mn=0&dy=3&id=p18926287245&a=337841009&r=1425490885451&cmd=print
DAX is looking very strong folks.
On futures only approx 50 points from
the ATH currently.
Not sure that is shouting imminent declines
to me, let’s see.
DAX has been the best leading indicator of late.
Phil, on an EW count only, DAX completed a triangle in early Jan. The move out of a triangle is a strong one (thrust – and this one certainly qualifies as one). However since then we can count 5 waves nearing completion. I reckon early 11500s should be about it.
…..Sorry Krish, don’t mean to rain on your 12K parade.
Just looked out the window and noticed it was a full moon! So pulled up Valley’s rules about trading around the full moon and guess what…it says that most full moon days are down days!! Way to go Valley.
Next I’m going to look up when apogee and perigree occur as they too have some say in things.
I know Valley gave his 7Day Lunar notes above but ended up saying he didn’t know how to trade this week.
Me being a ‘micro count’ person am going to break down each day and see what comes out of it.
Thanks Valley and Andre for all this stuff.
You are welcome kind sir! Tomorrow is full moon and is also apogee. Many but not all deep discounts happen on or around apogee so would not be surprised to see a 5 % off sale by next week, just in time for the FOMC to “Nicolas” the markets once again. Nicolas is a verb which connotes the act or tendency to steady or elevate an object or situation.
I am hesitant to short the market at this time as March pre election year seasonals are very bullish and full moons sometimes have one day upward price moves of substance. I would consider it if tomorrow is flat or down and then only with proper risk management.
Oh heck I was confusing Nicolas with a noun. No wonder I was getting all confused. I can only blame it on my 2 brain cells. Thanks for clearing that up.
🙂
You are welcome. The beginning of wisdom is understanding the importance of words. And so I must be very wise because I chatter on so. This just in, lunar equatorial crossing is Friday. Based upon research best not to short market day of , day before, and day after. So given tides are dropping next week, and moon will have crossed equator idea short setup according to lunar tidal would be at close of market next Monday and exit short at close next Friday. This is probably what I will do even if price is showing strength.
purvez, appreciate your view, thank you.
My own view was for a minor pullback
of 3-4%, and then up towards higher highs.
I am sticking with my end of Q2/Q3 final top.
Just guesswork on my part.
Phil, I was only referring to the current wave since the triangle. Although it does (at the moment) look like the ‘final’ wave it may well sub-divide further. However if you get the 3-4% pull back then depending on the waves down us EWers would be in a better position to provide a prognosis.
I really have no clear vision on timescales. I do however agree with your fundamental view that earnings will determine the next ‘MAJOR’ down move. All I do is count waves and …. hope for the best. I know people who can count time in Fibonacci scales but I’m just too mentally handicapped to be able to do such stuff.
I would however say that EW has managed to keep me out of trouble a lot.
Soap Box time:
I believe that EW is incorrectly used. Most people use it to project targets and direction etc and whilst it can be used for that…..my personal experience has been to use it ‘defensively’.
The one thing that EW gives you is an ‘absolute’ point of ‘failure’. What I mean by that is you look at the waves and project a potential path. However there is ALWAYS a point on the chart which if crossed means that your ‘projection’ was incorrect. To me that has been a HUGE benefit as it gives me my ‘get out’ point. No ifs or buts.
Also since EW works on all time frames I use it at the 5 minute level. Which normally means that my losses are tiny….although I may have 4-5 or more in a row. However once it starts to move in my direction then the hardest part is sitting on one’s hands until the waves say so. Ugh that is SO SO HARD and I’ve been guilty of taking profits waay too early.
End of Soap Box:
Sorry for the rant people but I do believe EW would get a better ‘press’ if people used it like I do.
Thanks for sharing, Purvez. It’s exactly this type of “rant” I find extremely valuable.
You are very welcome Gary, and my very grateful thanks to our host for the opportunity to vent.
Today is no shot across the bow. Just consolidation.
At the end of the day, $NYADV improved from the low of 383 to close at 1,177. The market is not ready to roll-over. $NYHL remains positive and down only 16 and closed at 85.
My Swing Trend Indicator closed on “tentative sell” today, that’s a warning.
Newt your posts have been providing me with an alternative set of tools that I really hadn’t given much attention to. Thx for that.
The reason I hadn’t used them is because FXCM, my data provider, doesn’t provide them in their charts. Would you or anyone else here know where I can access this data without having to fork out yet more money to a charting service?
Thx in advance.
Purvez – Your comments about EW are spot on. The benefit of EW is it gives you exact Stop Loss points. An invalidated EW count is sometimes the best EW count.
No other tool I use can give you risk/reward setups like EW.
Closed 2/3 of my puts this morning, will add back the 2/3 only under 2085.
Also, since 2011, when a down move has been retraced over 62%, it has gone on to make a new high 94% of the time. Those are pretty goods odds for trading.
Best to ya Purvez.
geno, it’s good to know that others use EW defensively too. Regarding your retrace statistic…wow that is very good to know.
Swing Trend Indicator Chart
wher can i find thit
what indicators are this
http://www.marketwatch.com/story/investors-just-got-another-wake-up-call-on-the-bull-market-2015-03-04
“Margin debt is heading lower, suggesting bearishness is setting in.”
I really appreciate some of the comments that go beyond simple trading parameters and ideas such as purvez, allan and others share.
I’d like to add a small one of my own if I may.
I keep waiting for this central bank powered advance to subside. But then I remember, the same powers that were behind world wars, the jfk assassination, 911, and all terrorism are fomenting this market abberation. I shouldn’t expect it to end easily. But if/when it does, it will/would be epic. Just my 2 grains.
Specie, sadly I have to agree with you. I think (hope) this time people will realise that it’s not their neighbours with whom they have a quarrel but with their own ‘leaders’.
Have a supply of white sheets and sharpened pitchforks ready. Lol.
Crude and the DAX ahead, Euro weakening further.
If there is any imminent fall in equities it has to
be US lead IMV.
That’s another new high for the DAX.
If anyone cares to look at the DAX hourly chart you will see a clear 5 wave advance from yesterday’s low to today’s high.
This of course could just be w1 of w5 of W5 or it could be ALL of w5 of W5. EWers will hopefully understand this. Any way the point is that there will be either a very shallow pull back which will stay above yesterday’s low or it becomes the ‘world is nigh’ wave. Sadly too early to tell but ‘micro’ wave counters can take a short with an out at 11535. The downside is HUGE compared to what you’d lose at that stop level.
Sunspot numbers have very recently started to become unresponsive to surges in solar activity, and the important monthly mean (ISN) is tentatively just above its lower plateau boundary. If this continues through March, then we will have suddenly reached the point where speculation ended in previous similar solar cycles.
The next three weeks are critical, while we see if northern hemisphere sunspot numbers can stage a recovery. If they can, then we will likely see speculation continue towards September 2015 in line with SC16 timing. If not, then SC12, 13, 7 and 10 timing indicates huge volatility setting in very soon (April, May, June) which will involve a significant fall in US stock prices (typically between 12% and 40%). And after that, typically a doubling of those prices into mid/late 2017.
With SC16/1929 being the latest of those most similar cycles, thay are all too old to be within anyone’s personal experience, and the same can be said about the forthcoming interaction of solar and lunar cycles – that’s why I’ve been saying that we should expect to see things we’ve never experienced before.
Right now, we are at the solar equivalent of mid-1896 during SC13: http://www.chartsrus.com/charts.php?image=http://www.sharelynx.com/chartsfixed/USDJIND1800-1900.gif
Mark thanks very much for the research, very much appreciated. Wow so you believe we may be at the base of a MAJOR ramp UP?
Have I understood that correctly, please?
Yes purvez, but not in a straightforward way. In mid-December 2014 I said that I expected 4 to 6 weeks of failed attempts for SP500 to break cleanly above 2065, and when it did it would be something to behold. I thought the re-emergence of northern hemishpere sunspots would be the fuel to push it up in line with SC16/1929 timing. Although those northern sunspots have in fact started to appear, they have been quickly fizzling out within a couple of days, and that is something I did not expect.
So if solar timing is now starting to diverge from SC16, then the chances of SC12/13/7/10/14 timing is increasing. That would involve several months of very high volatility where stocks could lose up to half their value, washing all the indicators and divergences out, followed by continuing and accelerating stock prices for at least a couple of years.
Back in February 2012 here on John’s site I said this;
“It strikes me that the alignment peaks [V-E-J] correlate very well with geomagnetism peaks (as detailed in the last table on your “Timetables” page). Then, looking at the long-term DJIA chart (on your Ultra Long Term Models page) we can see that buying stocks at geomagnetism peaks during secular bears would be an extremely successful strategy – 1942, 1974 and 1982”.
“They appear to anticipate geomagnetism peaking during 2015, which would sit reasonably well with your other analyses”.
So here we are now very close to the geomagnetism peak (it falls at, or within two years of the sunspot peak), and also in the late stages of a secular stocks bear – just like 1942, 1974 and 1982. http://www.chartsrus.com/charts.php?image=http://www.sharelynx.com/chartsfixed/USDJINDlog.gif
I’m sure there are reasons to think its different this time (there always are); and I find it as hard as anyone else to envisage a new secular stocks bull starting from here – but I bet that’s what they all thought in 1942, 1974 and 1982 too.
Thanks Mark, I’ll just look out for the volatility as I don’t really understand all the Solar activity science behind it. However it is very good to know this in advance and thanks again for sharing.
I expect SP500 to make little progress during March, and be very strong during April into early May. If that’s wrong, and it were to drop by the 12% minimum of those previous similar cycles from current levels, that would only take it back to the 1850 level. That could conceivably be as good as it gets for bears right out until 2017…
Mark, if we are at the peak (diverging from SC16), then you expect a drop of anywhere between 12-40% or more (I also read even 50%)?
So even though there is the possibility of a new bull rising out of this possible correction, that correction may be extremely severe. Am I reading this right?
Gary – yes, and yes.
I expect an SC16 scenario would tend towards a single mania later in 2015, and then persistent falls closer to the 40% end of the spectrum. For the other SC12/13 etc scenario; a more messy, volatile churning period around mid May/June with declines closer to the 12% end (but possibly several of them).
Its also interesting, I think, that interest in the solar cycle has waned away to almost zero just as it approaches its most interesting phase.
Mark, fascinating research. Thanks.
new highs on the biowrecks
the sheeple are repeatedly anxious to get sheared
Hi all ! New highs for IBB. Abbvie is buying Pharmacyclics over 250$ per share. As I said, it’s obvious this sector is still way undervalued. I still recommend to increase exposure to IBB.
ALL IDIOTS OF THE WORLD SENDING IBB AND DAX IN THE STRATOSPHERE
Dax has surged by 40% in 4 mounths. SPX and DAX now are both in bubble territory.
For those playing along at home….
Just to follow-up on my post from yesterday, after running last night’s data, we have a confirmed Sell signal in my trading system…
That is, liquidate all longs from the prior buy signals (2027 avg SPX, from 1/23 and 1/28) today, and be 50% short by today’s close…
I use the closing SPX price for tracking purposes, but I’m already plenty short, so I’m good-to-go…
And probably needless to say, I am in the camp of NOT recommending increasing exposure to IBB… Nor much else either….
Good luck, all….
I hope JH kept his position size small if he opened
a new short position on Monday.
This DAX move will have blown up multiple accounts today,
as many appeared to expect lower levels.
This story is old but it goes on – bonus points if
you get the lyrical reference )
jegersmart….are you listening? Time to load up on IBB again. Sorry to belabour the point but didn’t want you to miss out on this announcement.
Barry, interesting, I notice markets often confirm
your system a couple of trading days later –
that’s not meant facetiously btw.
It’s been chopped-up a bit the past few trades, so it’s good to get a decent-sized winner going again….
US weekly jobless claims trending higher:
http://finance.yahoo.com/news/weekly-jobless-claims-continue-soar-135020428.html
US claims up and productivity down:
http://finance.yahoo.com/news/u-jobless-claims-rise-fourth-quarter-productivity-revised-133845977–business.html
Richard I, it is this continuous squeezing of middle level income via lower wages and joblessness which is going to tip the World into a recession. Without US and to an almost equal extent Europe’s consumers there is no other ‘large bloc’ of consumers left to require increases in productivity.
Although China has a large enough population it will take at least a generational change in attitude for internal consumer driven demand to occur.
That perhaps leaves India as the only other nation with a large population of possible consumers. Unlike the Chinese the Indians do have a propensity to consume (spend) but they suffer from per capita income which is miniscule. So even though they may have the will they certainly don’t have the means.
Unless the US and European Leaders come to their collective senses and drastically reduce taxation as well as small business administrative burdens I suspect we are at the ‘end game’. Unfortunately they are too busy trying to find the pennies to keep their pension funds intact.
It will not be pretty as Specie and most others have already said.
The simple equation is QE = Bull market. Worked for the last 5 years and will continue to do so I reckon.
Full moon, high tide, apogee. Moon looks really small in sky tonight. Opposite of super moon, moon will be 30% smaller visually than perigee would be. Price on full moon days very often marks tops and apogees frequently are followed by 2 to 3 days of downward price. Low tide reached in 8 days from today. Would expect weak prices until low tide, and the following week FOMC will Nicolas (verb) the markets back to ATHs.
Valley in the interest of correct grammar, you really shouldn’t capitalise nicolas here. After all wisdom needs to be in the context of good grammar. 🙂
If this short trade works out I will drink a glass of Dom Plonkingnon to celebrate.
I hope it does work out for you. As long as you cover the cost of the bottle then just be grateful as the CBs are still lurking.
Krish, in terms of US markets,
it will continue to work as long as macro
remains supportive.
apple ipad sales have been dropping for four quarters
now they’re going to have to delay their new unannounced larger ipad 6 months
if sheeple know(guess) that a new better ipad is gonna come out later
that’s gonna just kill sales…. i think
something to keep an eye on
I focus on the internals only and care very little about the macro while ewaves are too complicated for me to discern.
$NYMO turned negative EOD yesterday. I shorted (sent in my jumbo scout this time) again this morning near the top. It is all about probability.
$SPXA50R 5 EMA already rolled-over. Lower price ahead very likely.
A price reset (correction-bargain) is needed to attract new buyers. Never new under the sun.
Newt, I don’t know whether you saw my earlier comment requesting where I might get the info on these indicators that you mention. If you can point me to a place then I would be very grateful.
I am very keen to use some of these in my own trading because it is yet another set of ‘near live’ info which can support or contradict what I see via EW.
Thx in advance.
Go to stockcharts.com; ChartSchool and play with its technical Analysis tools…and become an “expert”.LOL. many of its tools/indicators/charts are real-time and free.
Good luck!
There are public charts posted by its members. You can see how they use the tools and set the perimeters.
http://stockcharts.com/public
Thanks very much for that info Newt. I’ll head over there tomorrow as it’s getting a bit late here in the UK.
Newt, just to say that I’ve been reading up on Stockcharts ChartSchool and the public area and it is very interesting indeed. Many thanks for pointing me in the right direction.
Can I give your name when my wife wants to know why I’m still looking at ‘squiggles on the screen’ at past midnight? 😉
If and when $NYLOW rises to 100+. I will deploy my Calvary.
Newt, I suppose you use whatever works best for you.
Fundamentals and price can be out of sync
for long periods, not indefinitely though.
Someone here pointed me to the ‘Alhambra Partners’ blog and it has been interesting if perhaps difficult to understand reading. However this one out today even I could understand. I would urge people here to look at this one.
http://www.alhambrapartners.com/2015/03/05/economy-and-stocks/
I also meant to thank the person who originally pointed me to the Alhambra Partners’ blog.
You’re very welcome.
My apologies for not remembering who it was. Thx again.
The sell off in American stocks to the final and last V bottom that occurs before the parabolic blow off top …is underway. I expect this V bottom to be in April. The reality of a greater than expected reduction in Q4 productivity combined with a negative Q1 GDP (caused by the hard winter just like last year) will accelerate the selling to a V bottom that will turn and rally back up due to the belief that low energy prices will be good for the economy –this summer. When this summer is finally over and the proof comes in that the summer economy was not as good as expected then stocks will top (October) and the crash of crashes will begin.
Here is a past chart pattern that I am following that presently is matching very closely. http://i58.tinypic.com/2427gqa.jpg
SPY drops from a Jul 29, 2014 high to Aug 8, 2014 low (+8TD) of about -75 points. +19TD it makes a failed secondary top, dips and temporarily bounces off the 20day-MA, and +7TD after the bounce makes a final top (only incrementally higher) and sells off hard for the next +10TD.
SPY drops from Jan 23, 2015 high to Feb 2, 2015 low (+7TD) of about -80 points. +19TD it makes a failed secondary top, dips and temporarily bounces off the 20day-MA (yesterday Mar 4, 2015).
If chart pattern repeats then in next +7TD from Mar 4 implies we retest the 52-week high by end of next week (Mar 13, 2015) and either make an incrementally new high (i.e. 2125) or possibly around 2120 again. A sell off after that in next +10TD implies a Mar 27, 2015 low, maybe -100 points or -5% again.
March is supposed to be a very volatile month due to the final passing of the Uranus and Pluto waxing square on Mar 16, 2015. I would have anticipated a decline starting the week before that date (i.e. next week on Mon Mar 9), but the chart and count of TD’s indicate it likely occurs closer to mid-March (if it were to happen).
Fed meeting on Mar 18 probably gives a temporary countertrend bounce of 15-20 points (just like Sep 24, 2014) and the action likely similar afterwards where it bounces up/down to extremes on daily basis for one week before the final 2 or 3 day drop.
Steve T, your prognosis is very similar to Andre’s who is also expecting a high (although a lower one) on the 13th before a sell off.. However you are arriving at a similar conclusion from an entirely different set of parameters that you are reading.
Wow this is eerie!!….BTW I love eerie. It’s to do with my 2 bi-polar brain cells. Lol.
Let’s see who is right. I am 75% sure that market will sell off until the 13th. High tide and apogee today. My trading system goes short on high tide until low tide, next one which is on 13th.
Valley, maybe it’s one of the ‘inversion’ periods? I haven’t got the hang of those.
Richard, not sure what sell off in US stocks is now underway?.
Unless less that 1% off all time highs now constitutes
a correction.
Hey Slater9, first time posting here. Was wondering what your thoughts were on UVXY?
The Euro is in complete melt down.
As I mentioned earlier this week lower
levels looked likely with clear Euro area deflation.
Phil, maybe…maybe not –
UK inflation expectations hit 13 year low. But in Europe they keep rising (see link/chart). http://on.ft.com/1BVIKBE
Hi Phil
I know you like to pat yourself on the back, but maybe you could give it a rest for a few days? Comments like “the DAX looks strong” is quite frankly just taking up bandwidth. We can see the euro is plunging, we can remember that you mentioned that it looked likely to do so. It is not in my view necessary to provide a constant narrative of things that we can all see. I would though be interested in hearing how you are trading at the moment and why:)
Thanks in advance.
J
Gold below 1200 again, it will be interesting
to see if this is just very short term or heading
towards a test of last November’s low.
With a strong DAX, a rebound in Crude and
a weaker Gold price, it does not tend to indicate
an imminent severe sell off in equities.
Is the Euro sell off over:
http://finance.yahoo.com/news/euro-zone-markets-inflation-gauge-104503512.html
Should the NFP disappoint then the odds will have increased substantially with the rise in Eurozone 5/5s that the sell off is over.
Valley, noted your call for next week.
Barry has also mentioned that his system posted
a sell.
If we do sell off next week I would be surprised if
this is more than a 3/4% minor corrective phase.
Richard, the more interesting point is if the $
stays this strong, will forward guidance from
US corporates weaken further.
I was asked what I thought of the UVXY.
Can not reply in generalities.
If trader would like, I will post my trading chart of last few days
showing the rational behind the trades of last few days
ALL based on the simple stuff I have shown here before..
Thanks Slater I really appreciate your charts. Excellent work!
These are extraordinary FX moves.
We may be nearing an inflexion point on the $
where levels begin to more significantly impact
US corporates.
It would also build a more powerful case for a bull
market top later in 2015.
Those who highlighted the prospect for possible weakness
next week may be on the money.
These thoughts I have expressed before The chart of the last few days
allows for a teaching example..
I watch the QQQ,SPY,DIA,TNA, FAS as a group
Even 5 years ago the computers would set up buy and sell signals
in these simultaneously..
About 3.5 years ago the game was changed..
The BEST SIGNAL began to be rotated through the group..
there was no longer a simple pile of signals
I have said previously that completed abcd’s at lines from medianline sets
are important tools in my tool box.
Over the last few days the computers have focused the BEST SIGNAL
in the QQQ using completed abcd’s at line.
http://stockcharts.com/h-sc/ui?s=QQQ&p=15&yr=0&mn=0&dy=8&id=p49042545802&a=338378191&r=1425650310858&cmd=print
Slater9, a simple question: in this chart could you point out what prices correspond to abcd – thanks
elliot traders cal abcd’s x-abc
medianline traders, because the point
where the move starts is equally important
honor the first pivot by giving its own letter
thus abcd
abcd’s are 3 leg moves
often the bc leg breaks down into an abcd of its own
thus when in discussion the larger is called ABCD
and the smaller abcd
the best and most complete discussion of this is in the work of a trader named
Jim Kane…
thus on this chart you have pink,red and black 3 leg abcd’s completing at lines
In a previous post I showed the exact parameters
of the ”ligtning trade” using BABA as an example
yesterday near the close those same exact parameters set up
on price bar with black arrow…. the selloff in bonds was already in the geometry of the market.
http://stockcharts.com/h-sc/ui?s=TBT&p=5&yr=0&mn=0&dy=5&id=p06248501544&a=337816926&r=1425652254851&cmd=print
No panic in the internals. An orderly reset is becoming real just to attract new buyers. $NYADV, 13 EMA weaken to 1,489, in the correction zone. $SPX 13 EMA is the now the ceiling.
A revisit of SPX 2000 (buy zone) would be nice.
My jumbo scout has returned with a set of full hair. Lol.
Up volume ( $NYUPV) collapsing. Longs gave up their commitment since Feb. 1st while price went up.
NAAIM commitment of 99.2% in the last week of Feb. must be punished according to Mrs. market’s rule.
Newt congrats to your jumbo scout!!
I however agree with you that this down draft isn’t all it ‘looks’ to be. My micro counts, although stretched, are still suggesting that this is a correction. If so then the Risk/Reward to the upside on the DJIA can be as very good.
I’ll post as soon as I feel we have reached a ‘bottom’ for this down wave.
Like the great Mr Livermoor’s “probes” Newt )
Would agree with your view, over 3/4% unlikely
at this point, if we even get that.
Keep an eye on oil low. If it breaks lower the markets will follow. Storage is filling up.
I would like to congratulate all of the investors who are short the market today! Short QQQ, IWM, SPY or whatever you wish. This market is going much lower!
I am going to open a bottle of Dom Plonkingnon next Friday if the market loses 3 to 4 percent by then. Cheers.
The key is $SPX1940. Below that the long term bulls would/should sweat a bit. Until then, this correction, if materialized, should be viewed as a counter-directional gift.
Nice one Valley! 🙂 You do however need a starting greeting…perhaps ‘Goood Mooorning Bears’ or something?
On a serious note however, clearly your call for downside has been pretty epic today. My own count (below) is suggesting that we may have hit the end of the line temporarily and it seems to jive with Newt’s call that there doesn’t appear to be any panic here. Also I keep remembering Andre’s words that we’ll go up from the 5th to the 13th but not to new ATHs. Now Andre was late by a day in calling the ‘down’ i.e. 2nd was an up day so I’m wondering whether that one day slippage also affects the tail end.
What I’m trying to say here is that if you’ve made some moolah for a crate of Plonkingnon then I would certainly bank some of it.
I must really insist that you see the value of being short the QQQ, SPY, or IWM right now! The market will certainly be much lower Monday and maybe even Tuesday. Don’t fight the short term trend, which is down. Time to savor the beverage I love, Dom Plonkingnon. Stay thirsty until Monday.
I may be alone in thinking that Nicholas only posts facetious remarks but
even though posts aren’t time stamped, i think he nailed the exact top of the biotech bubble yesterday around 10am. We’ll have to wait and see.
$NYADV is currently at 455. A sense of urgency to sell.
Hold your short.
Today’s observation. GLD gets a haircut. Mrs. Market doesn’t like justice/opinionated trades.
I have said this before and today offers another good teaching example
THE VIX traders use their computers to manipulate the indexes to set up the geometry for their vix trades… the short term bounce this morning was orchestrated to set up the 886 algo trade in the UVXY…
as you can see, it is the 3rd time this week they have pulled this off
http://stockcharts.com/h-sc/ui?s=UVXY&p=5&yr=0&mn=0&dy=5&id=p97804596200&a=337841009&r=1425658127239&cmd=print
have added two red arrows to chart
because the primary focus of the vix traders is to move
price to R 3
will look to take half the trade off there
and see if they will let the indexes to collapse so price will reach medianline
SPX should find some support around 38% retrace of February move (2070 level) or even higher. Then it should turn up again. My estimation is that bull market should finally reach its high at SPX in 2220-2230 range. Should happen in May-June or even later, after weeks of tedious consolidation.
GLD-THOSE USING THE TOOLS
to be short GLD are using the panic selling to cover their shorts at
the target line…
http://stockcharts.com/h-sc/ui?s=GLD&p=60&yr=0&mn=4&dy=19&id=p66844887763&a=343963542&r=1425663249746&cmd=print
Hi all ! This is just short term profit taking, i’m not worried at all. ECB buying starts QE on monday with 60B per month, so I do expect heavy ECB buying starting next week.
I wanted to congratulate all those who are short gold today. I’m seen many posts recently (Allan’s posts) encouraging us to buy gold, which proved disastrous yet again.
Nicolas today:
” “Tis but a scratch…. ”
Nicolas, weeks from now:
“Alright…..we’ll call it a draw…”
May the “shorts” be with you.
after a piece of crap comment like that i’m gonna have to admit i am wrong
Nicolas is a bugger of a troll
still LOL
HWLLLB
886 PART ONE
Always hard to sort out discovering from creating
and then deal with the natural human impulse to want credit
for one on the other.For me what is important in my trading is to discover
repeating patterns and then REPORT my findings to my fellow traders.
In that light l will share my history with the 886.
FOR NOW , just look at this chart
it is clear the volatility traders use it extensively
note how they have defended the last 886
knowing that if it breaks they lose a key reference point in the market
http://stockcharts.com/h-sc/ui?s=XIV&p=15&yr=0&mn=0&dy=7&id=p05866841878&a=345013549&r=1425667200843&cmd=print
slater9, what I’m about to say will sound negative and rude but It’s meant to help both yourself and those you are trying to help.
I spent upwards of a week of near full time effort looking through the website that you suggested and I believe I started to get an understanding of your trading patterns….although ‘started’ would be the operative word here.
You, I believe are a great trader and have a clear mastery of your craft, however like many great professionals you are a ‘lousy’ teacher.
If you really want people to understand your 886 pattern then you need to
1. clear your charts of everything extraneous other than the median line set and perhaps the associated fib retracements.
2. You then need to explain what you mean by 886.
3. Then explain the 5 minute opening gap.
4. How you arrive at the right point to start your median line set.
Only once you’ve done that in simple steps will it be possible for people to start to understand your method.
It would be a real shame for you to spend time thinking you were explaining and yet the pupils remained clueless.
NOTE TO PUPILS: Please pipe up if you believe what I’ve said above is out of order and that slater9’s explanations are clear to you.
My reason for writing this is because I DO BELIEVE there is trading knowledge here that would benefit people but it either needs slater9 to become a teacher or for someone else who can teach to learn it off slater9 and then explain to the rest of us.
AS always, my ten year old student who I TEACH THE MARKET AS A GAME
finds what I show so simple it is boring…but when I show adults I GET RESPONSES LIKE THIS…..
NOTE; it says PART 1
it had been my plan to do a 13 PART PRESENTATION
so that every last trader here would understand as a gift to this blog
I do think it is out of order to make a lengthy post after a trader says
PART 1
Purvez, I prefer all of the data to be present on the chart. To distill it down into a single line would remove the educational value as each separate line represents an input that controls the price movement. Kind of like a bee hive with bees flying around it and quite beautiful. Maybe someday I will be able to understand how to read it expertly.
slater9, PLEASE PLEASE accept my apologies for what I have said. However understand that I DID SPEND a lot of time trying to understand your patterns.
All I’m trying to say (for the last time, I promise) is that PERHAPS you are NOT the best person to explain your system. I DO BELIEVE your system has a LOT to OFFER but you are not (in my humble opinion) to teach it. THAT is all I’m saying.
NOTE: My charting system includes out of hours action. So all my comments below are based on the info I get from that service.
I know today’s action feels like the wheels are FINALLY coming off the wagon. However today’s low I believe MAY be a fake down (on the DJIA at least). By my micro counts a 5 wave down ended on Mar 4 low from the DJIA all time high on Mar 2. The subsequent rise (from Mar 4 low) to today’s (Mar 6) intraday high down to today’s low (17850ish) is an ‘a-b-c’ (Expanded Flat – i.e. the b wave down goes below the start of the a wave). Which means that we should retrace everything back to at least 18180 although I personally prefer 18220 which is the orthodox 76.4% retracement from the Mar 2 high to the Mar 4 low.
I started writing the above up around 10:30 EST (Now 13:45 EST – nothing happens quickly in the EW world – LOL.)
I have taken a ‘small’ long position on the DJIA at 17860 with a STOP at 17840 to give it some wiggle room.
The final part of this move since 17950 has the distinct look of an Ending Diagonal which tends to reverse quite hard and quickly.
Also the RSI on the 5 minute chart has been showing a positive divergence since 17925.
FULL DISCLOSURE: In arriving at this point of the trade I already have 3 losing trades since 17950 amounting in total to about 24 points. Provided we don’t have a final ‘surge’ drop down to 17940 the R/R on this trade is going to be amazing…..IF I can keep my hands off from taking profits early!!
Confused why you would want to go long here. Price is pulling back after a month of upward trend. Wouldn’t you be worried about a follow thru correction on Monday? It could be sizable at least that is what I am hoping for. Days following full moon are rarely upward days especially after recent price strength and with apogee being yesterday. Apogee usually has 2 trade days of weakness following it.
Valley you have to understand my ‘limited’ abilities here. I can count to 5 in either direction…. then I HAVE TO (usually) take the opposite side.
Ok people everything I said above has been vindicated. So although I can see some AMAZING divergences between price action and RSI I have also seen SIMILAR before so I’m currently out of the game. Once I take a position that I feel comfortable disclosing I will.
UGH UGH UGH!! Not ‘Vindicated’ but ‘NEGATED’. Sorry.
note too that on the last spike down in UVXY kissed its own 886 at1844….
it is a make or break moment in the markets
chart
http://stockcharts.com/h-sc/ui?s=UVXY&p=5&yr=0&mn=0&dy=5&id=p97804596200&a=337841009&r=1425668133785&cmd=print
What kind of chart is this? Looks like something my 5-year old with a doodler went crazy on! I am sure you have something important to say here with this chart but too many lines and curves everywhere to really understand what it is ….
I understand….this is my trading chart.
IF YOU KNOW HOW STOCK CHARTS WORKS..
in order to teach the importance of each thing on this chart
i have to create 12 more separate UVXY to show the importance
of each detail… Something I was planning to do this weekend..
Steve, while I understand your point, I think you might have expressed it differently. Slater9 has been very generous sharing his work, and your comment could be construed as gratuitous, if not worse.
Slater, very interested in further explication of your chart work.
Mark, regarding “I expect an SC16 scenario would tend towards a single mania later in 2015, and then persistent falls closer to the 40% end of the spectrum. “, do you see any chance we get the -90% of 1929?
I don’t think so John, no. Solar activity back in the late 1920s was of course almost identical to now, but the moon’s relationship to the sun (as we see it from here) was at the opposite extreme. In 1929, and for the following two years, the sun’s movement in our sky was losing its dominance over the moon’s – the major lunar standstill. At present, and for the next year or two, it is the other way around.
Humans have never (as evidenced by Stonehenge etc) liked the feeling of the sun losing that dominance. We don’t like the opposite period of change while the moon loses its dominance over the sun either, but when that change (the minor lunar standstill) is completed feelings quickly get back to normal.
Mr Gann’s wrote (20 years in advance) that stocks would have a major crash in 1929, followed by four years of falling prices. That Financial Timetable has rarely been wrong since, and is telling us now to expect a lesser panic during 2015 or 2016 followed by increasing stocks prices towards 2019.
Mark, I spent all night thinking about this. It is true that 1873 and 1929 were spot on at major standstills, but other than these two datapoints, there is no real evidence that major depressions need to occur at major standstills. 2000 was at the standstill mid-point, while 1972/1990 which could be considered the great depressions of Japan/Brazil occurred in the middle of the major/minor. If there is a great depression now, it is likely from China, and I am not convinced that we will wait until 2020. I am however open to the possibility.
1948 was an example where both the sun and moon both “peaked” as it did in 1929 and 1873, except there was hardly a crash.
re Andre’s work
not once not ever did I comment negatively
about his work as others did as price went to a new high
on Monday
From my own work on forecast time lining up with market time and geometry
I thought his work might be one day off
as it was…..
I hope all those who were so generous with their scorn
will note that he called for a move down based on time
into Friday MARCH 6
TODAY
Yes I can’t see ANYONE here saying that Andre’s work didn’t pan out. Do You?
By the end of the day, $NYHLR at 0.8235. $NYADV at 445. $NYHL at -15. Correction has started…..
Elder’s Force index (which I like since it combines both volume and price) triggered a sell signal for the SPX. Lets wait and see if more sell signals are coming.
Today is glorious if you have the skill to read the market right in the past few days.
Again. I just focus on the internals and ignore other noises. Internal indicators are the summary of mass (actual participants) psychology.
Yes Newt, very much like the EWaves as they too represent actual participant’s psychology. However I have to say despite having spent most of today looking through the $NY* indicators I’m still struggling to decide which ones to focus on…there are SO MANY of them.
Any thoughts or guidance would be very gratefully accepted with Thx.
Hi purez, it took me many years of studying the market internals ($NY…..plus a lot more indicators) to become proficient in TA and consistently profitable in my trading.
You live in UK?….I was invited to have lunch with Princess Margaret. The year was 1966. Ancient time… Bless her soul.
there is a bubble in stocks but there is a bubble in bonds too:
http://stockcharts.com/h-sc/ui?s=$BNDGLB:$CRB&p=W&st=1980-03-07&en=22222-09-09&id=p48065632054
http://traderfeed.blogspot.com/2015/03/taking-fresh-look-at-stock-market.html
Gary, interesting read, thanks for posting the link.
Interested to read John’s take on his next update.
I said on Thursday:
“$SPXA50R 5 EMA already rolled-over. Lower price ahead very likely.”
A drop to the buy zone SPX2000 area would be Mrs. market’s way to correct all the negative divergences present in the internal indicators and more importantly, to attract new buyer at a “bargain”.
Since many here like to discuss the macro.. Let me join in by suggesting a close watch of the Citi Econ. Surprise Index which may be bottoming.. I also try to discern the successful narratives coming at me.
With regards to Slater9’s charts, like most every one here, I find them difficult to decipher. I’m hoping he can start with simpler ones and build on them over time.
newt, invited to Tea with Thatcher! – wow
that’s something not many can say.
1966 was one of her first notable speeches at
that year’s Party Conference.
I’m a bit of a politics buff.
Phil not Maggie T but THE MAGGIE.
PRINCESS MARGARET. Wow Newt you are one lucky soul. Did you get to speak to her OR EVEN BETTER shake her hand.
She WAS/IS/AND ALWAYS WILL BE my favourite ROYAL.
The rest you can keep!!
Looking for April and May of 2015 to exhibit weaker prices within the context of a bullish year. Balance of March to be neutral. Will trade lunar chord with negative bias until June July which should be unseasonally positive. This is based upon the bimonthly cycle that Danny at Lunatictrader.com has outlined in archived articles.
You can research it if interested but basically:
12/04 to 1/05 weak (fire)
2/05 to 3/05 strong (earth)
4/05 to 5/05 weak (metal) metal chops wood and stock certificates are wood
6/05 to 7/05 strong (water)
8/05 to 9/05 strong (wood)
10/05 to 11/05 weak (fire)
12/05 to 1/06 strong (earth)
Thanks all, new post