
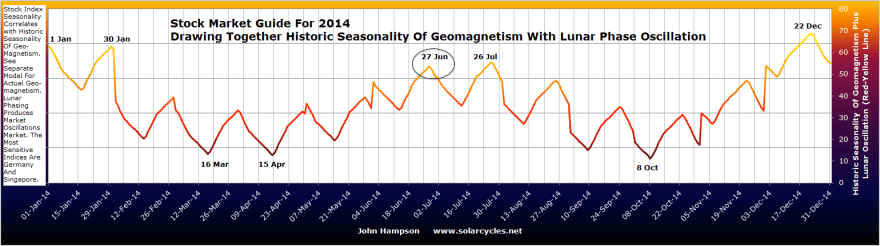
New moon today, and a seasonal geomagnetism (inverted) peak around now:
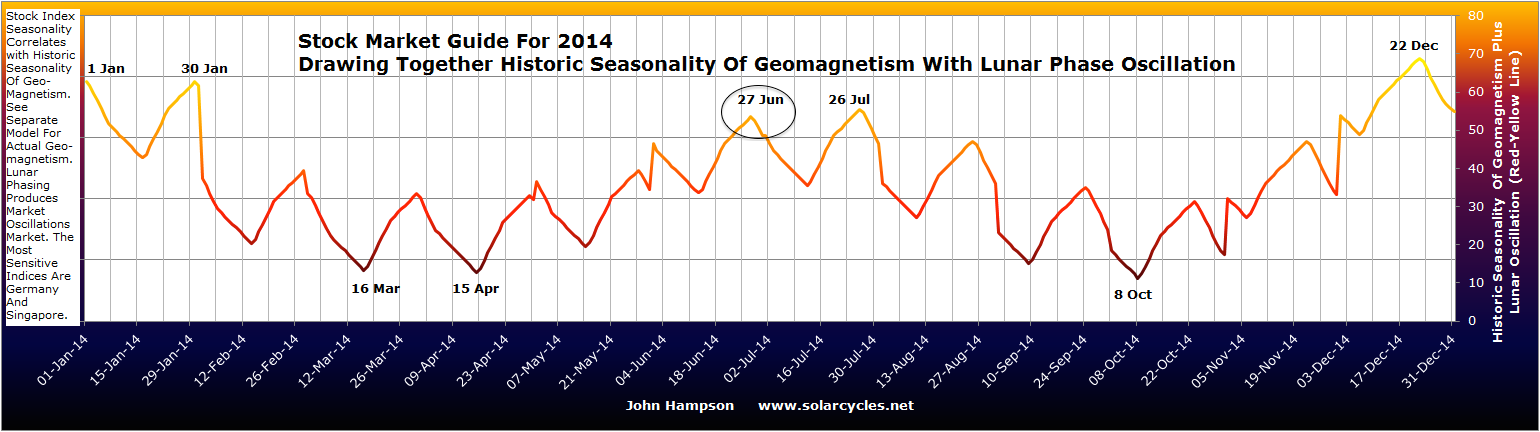
Sunspots have been rapidly waning too.
Price action in US equities has been up and down this week, but there has been a more pronounced trend change in European indices. Meanwhile, precious metals have consolidated their breakout and treasuries have advanced again.
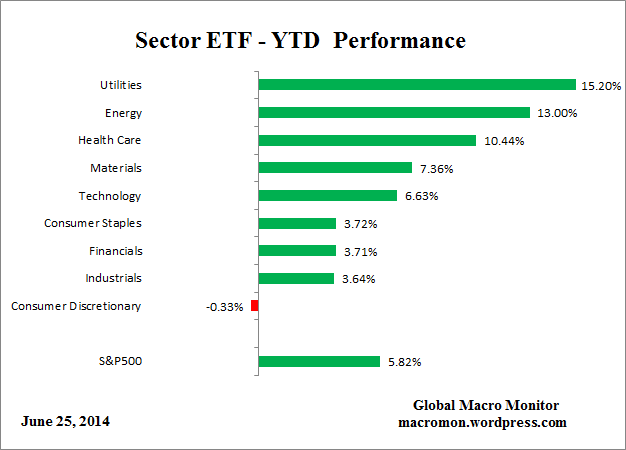
Utilities continue to outperform and at the end of Q2, YTD sector performance looks like this:
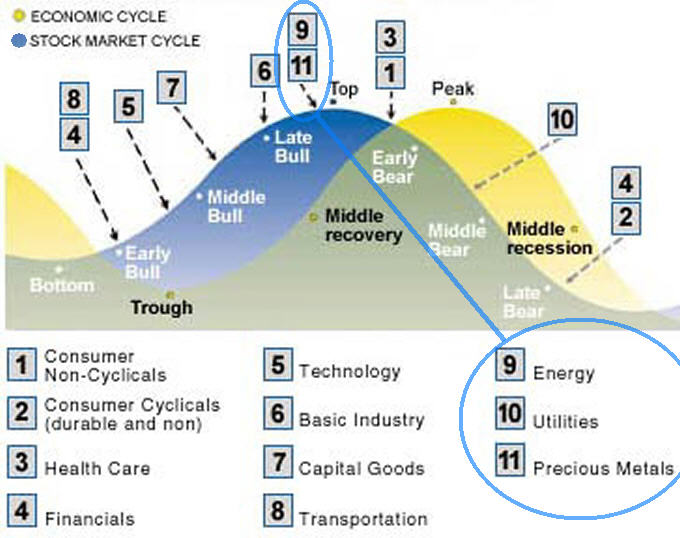
Which fits with this:
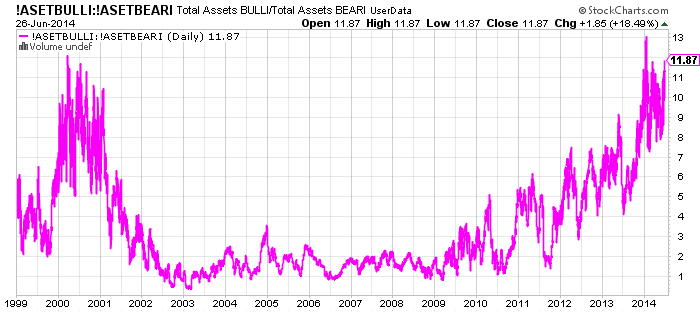
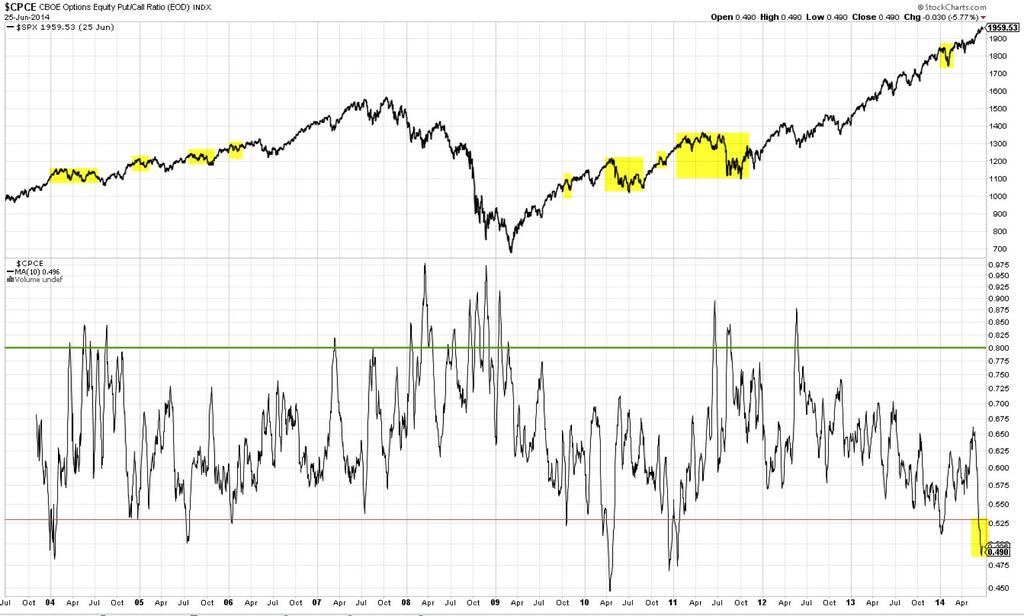
Bears have largely capitulated, as evidenced in readings in Investors Intelligence, NAAIM, Rydex, and more, whilst complacency is extreme, as evidenced by put/call ratios, Vix and more.
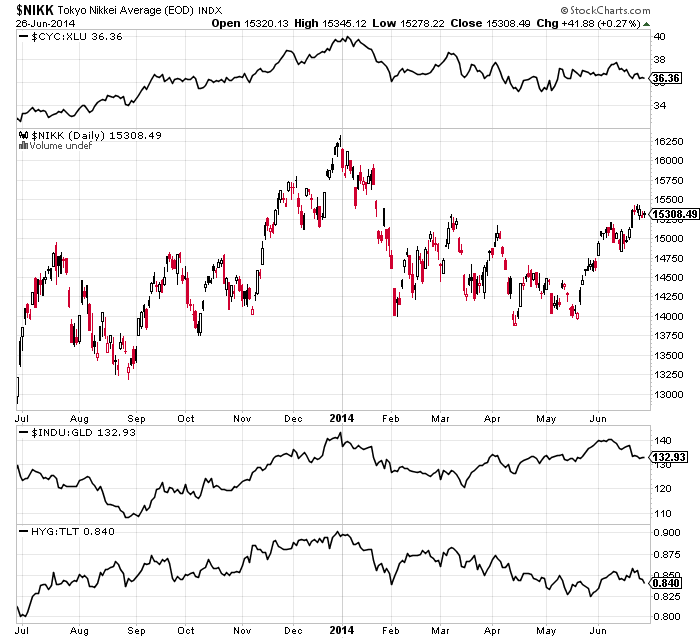
Cyclicals to utilities, high yield to treasuries and Dow-gold ratios have all turned down again, signalling risk off:
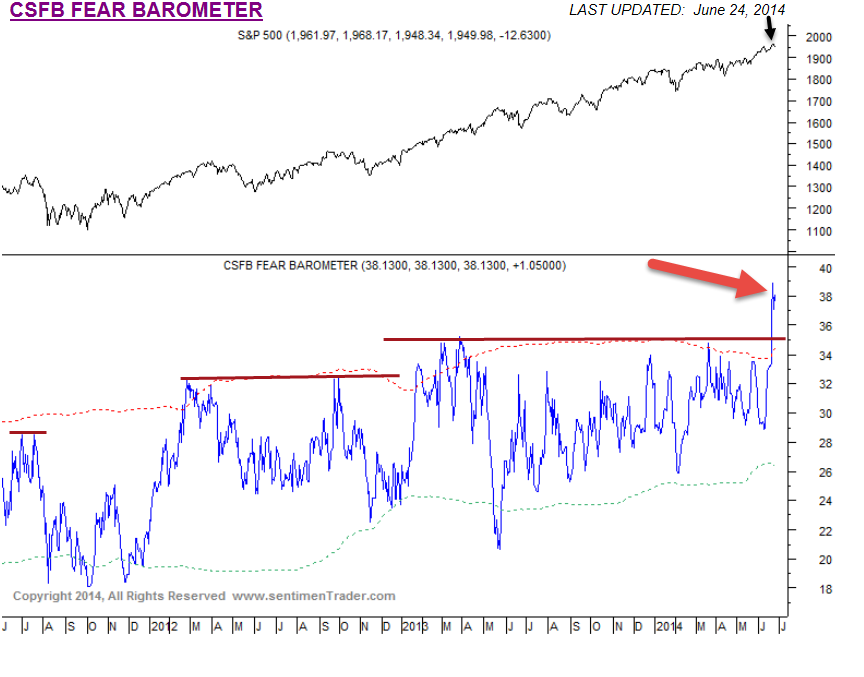
Several Sentimentrader charts are signalling a trend change:
 Whilst the Sornette bubble continues to flag as ripe to pop.
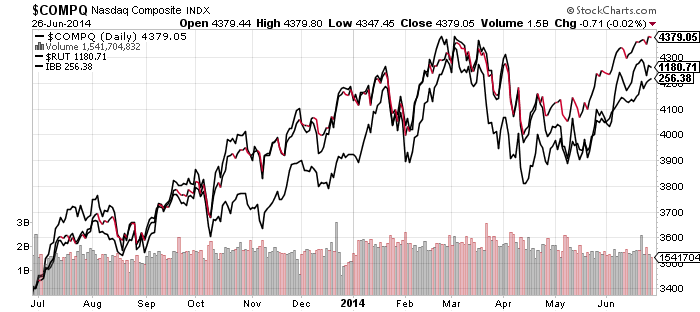
The US indices are ideally placed to turn, with the Nasdaq Composite at a double top, and RUT and IBB at potential lower high second chance peaks.
 And we had a major bad economic data item this week in Q1 GDP:
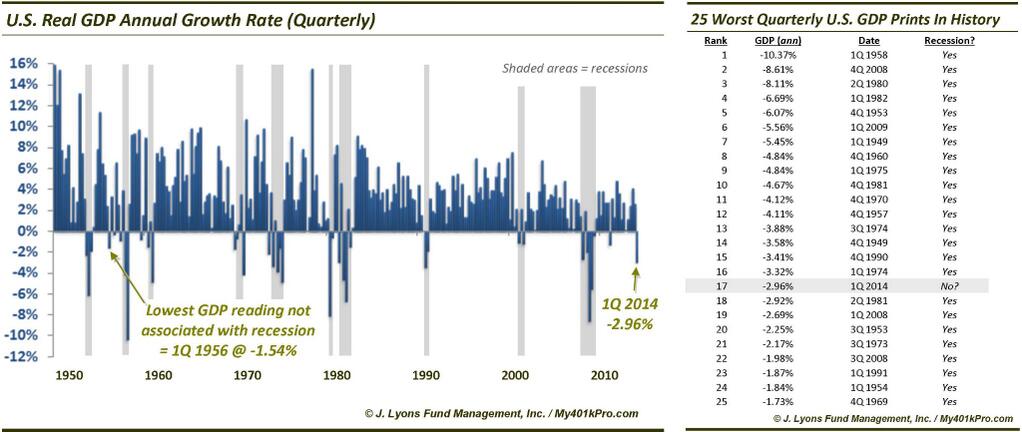
Equities have frontrun a return to ‘normal’ growth in both the economy and earnings, yet neither are occurring. Earnings season beginning early in July has the potential to add to the GDP disappointment and help cement the doubt and feed a downtrend.
To add to all the above, various divergences and indicator flags are mature. I maintain the reason for price advancing despite all these headwinds is the solar maximum driving speculation. If price continues to advance from here then I suggest the solar maximum isn’t done. However, evidence still points to the smoothed max likely being behind us, befitting peaks in markets spreading from December to June, around a Feb/Mar centre. If so, equities are ripe to fall here and deliver the potential of the combined above set-up.

Thanks for sharing the great analysis John. It is appreciated.
Thanks Peter
Thank you, John. Some time ago I also had a look at the correlations between astro-indicators (Bradley Index, etc., but also ‘space weather’-data like sunspots, solar flux, geomagnetic indices) and the financial markets. And I noticed that inversion of polarity oftentimes occurs in a time-window of +/- 2 weeks around equinoxes and solstices:http://time-price-research-astrofin.blogspot.de/2012/07/proposed-reason-for-inversion-of.html Regards. Georg
Interesting, thanks Georg
My gut feeling……..steady until the end of the quarter. New quarter……attempts rally for maybe even a few days then fail.
So basically Monday, then a futile rally attempt til end of week a full fledged correction? That’s your gut feeling?
market is making new highs and we are looking for bear market.
bill, yes market is making new highs. From your comment I take it you are not trying to time the top. How do you decide when to reduce longs and/or get out of longs completely or even go short?
Thanks much John. Great post! John Hussman who I greatly respect has the research paper released couple weeks ago. It is a great read for those who are interested in any confirmation of the imminent crash.
http://www.caseyresearch.com/cdd/dont-invest-like-sisyphus
Thanks
Recap and look ahead as we head into Independence Day weekend
[video src="http://videos.videopress.com/in8s8J7Z/05-july_hd.mp4" /]
The link has changed. Thanks
http://tradingtweets.wordpress.com/
Hi Bill , Ken et al
I have total respect for John. He does his homework and he sticks to his guns.
The problem is he has recently been talking about crashes and in my opinion that has slightly polarised the opinions on where the market is going.
I am selling here not for a crash but for a normal move in the 3 quarter. Maybe 5-12 %. I sense the day one cannot even question that a normal retracement might be upon us without being accused of being foolish would suggest we are closer to that retracement than some would think.
Thanks John for your update. One thing i agreed with Will preston i don’t think a crash is coming ahead. (Crash must accompanied with some systemic risk) What i think is that a correction of 10-15% for SPX in very close with those extreme, with Fed continue to taper what lies on the economy is fundamental, if fundamental doesn’t bit, then market would have tremendous drop.
For timing, i personally read it as very close but a good risk / reward ratio should be RUT at old high and SPX at 2000 Based on percentage wise, as of 6/29 firday close RUT is 1189.50 where as old high was at 1212 (1.89%) and SPX is at 1960.96, 2% to 2000.
Good luck and good trade to all here.
“the reason for price advancing despite all these headwinds is the solar maximum driving speculation. If price continues to advance from here then I suggest the solar maximum isn’t done”
With the revelation that Central Banks via their controlled public entities have been by far the major drivers of the global bull in stocks (motivated the desperate need for yield), and have accumulated over 50% of global holdings and since they have endless lines of credit, this must surely be a real physical brute of an “influence”.
I doubt the market will achieve a reverse until the majority of the major drivers camp see reason to break ranks and favour the short. After all, they have driven markets for a desperate purpose and continue to do so.
Again,
Great work John
Thanks Mat
Some more confirmation. Guess all we need is a spark.
http://www.zerohedge.com/news/2014-06-28/crushing-q2-recovery-dream-1-simple-chart
In a 3 year time frame (Jan 2013-Dec 2015), the moon reaches its max apogee on July 28th 2014. I see gravitational pull as one of the driving forces of mood.
From June 30th, the moon will come closer until July 13th. So my negative lunar period starts monday. (Analysts will explain it’s the end of the quarter, but it’s the moon).Then one last positive swing towards the apogee high.
From then on the gravitational force will grow at least until the end of 2015.
May the force be with you 😉
Hello Andre
Are you saying the markets will continue upwards until the end of 2015
ss999@live.ca
What I meant is that gravitation pulls the market down. So markets should go down if my analysis is correct.
I’ve recently experienced some back pain, therefore I am no longer long, although the charts don’t worry me that much. As I said a couple of months ago, the weakness used to come in the mid year, when crashistas go on holiday and devote themselves to sausages on the grill
http://www.google.com/trends/explore#q=stock%20market%20crash&cmpt=q
Also we still wait for that correction since March 2013.
We may have the last move to the upside in the first/second decade of July, but later we may go down. I will remain flexible in looking for signals in both directions (I don’t go short in a bull market for most of the time).
In the mean time, gold has probably bottomed and this is the most important event of June 2014, not the stock market which has done nothing to make me think that the Bull is over. The bull is still hungry for bears money, so if bears survive 2014, they will be crucified in 2015.
If gold goes down from here back to 1300 area, bounce up from there will be the first buy signal on hourly time frame to hold for 2000 and beyond.
Last week, I ‘ve been learning to play texas hold’em. After few days, I win games vs online computer. I think that good traders should be good at poker. I like to act slow to attract money when my cards are good, especially I love when someone low on chips goes all in, when I hold a pair of ladies for example. I love to bully the others when my cards are average, I act as if I had a good pair. I play risk averse vs few opponents – fold often, and go more aggressive as I got more chips and some players have been already knocked out (by me of course). In the end, poker is more a game of money than skill, so if anyone wants to win big games, make sure you have deep pockets.
Much to the disapproval of my commission driven financial advisor, iv sold 70% of my pension from equities to cash, a little bit of silver and what I can see is safer bonds.
Mainly down to the fact this medium risk pension made so much money in the last five years, iv sill got 20 years before it matures, so happy to stay like that for a couple of years.
Not just because I see manipulation or geographical events occurring, or the fact that BoE see interest rates at 2.5% next year (5x higher )
I just don’t want to end up loosing what I did in 2008 when it was a much smaller pension pot. Its still not 100% safe, but at least I did something this time to reduce the losses.
I think the market makers have polished this turd with tremendous success in the last 5 years but at the end of the day, it still just a turd.
I watched Million Dollar Traders recently. I thought that it was an absolute waste of time. To think that there is no structure in the markets and that the markets are based on sentiment and feelings. The stock market is a tool for distributing wealth from those who arent in the know to those who are. So in some capacity it is very much like online poker, one big virtual game.
Algorithms have been designed with input from psychologists. I have that information from a former algorithm developer.
I’ve watched Million Dollar Tarders some time ago. I was amused by one particular moment, when one of the ‘traders’ said that he didn’t feel that bad since he was getting a divorce (if I remember correctly), which brought to Van Dam face an unspoken satisfaction, as if he wanted to say : you thought that markets are easy, now you see what it is.
Lex made 0.7% in two months and was out performed by randoms. That speaks volumes. Ive watch antons lectures too. Mere puff!!! They never tell you how they actually trade……
yeah. I don’t get the denomination ‘ex-trader’. The lectures ve been about some shares IPOs? I don’t know what ‘former professional trader’ mean. If he is a trader, he lives on the market. If he is ex, retired, is he too rich? If so, why all this media circus? If he failed, he is not ex-, he is a loser.
The chart showing this is the weakest non-recessionary economy since 1954 rang a bell, W D Gann’s Master (MTF). The MTF is the 60 year cycle. IE, now should be a rough repeat (rhyme) of the 1950’s. The 1950’S saw a tremendously bullish stock market and a flat commodity market after it had dropped 20% from its 1951 peak. The previous corresponds well to today. Interest rates were low but had started a 30 year rise. Could be but a clear bottom in rates is not certain. Infation was low but @ 3%. Not that different to now. The $ was extremely strong but generally in a bear market. The $ has been flat for over 8 years. The FED manipulated rates by restraining rises to settle the extreme debt from WW II, similar to now.
The birth rate and population were exploding, very different now. Solar cycle 18 was bottoming in Apr, 1954. 24 is peaking now, opposite to 18. The US consumer was virtually debt free and Europe and the rest of the world were rebuilding from WW II. The debt of US consumers is opposite but the emergence of China and the 3rd world could correspond to rebuilding after WW II. I have thought the tremendous demographic and debt difference would presage an opposite response in the stock market. And the collapse of the world wide debt would at least temporarily strengthen the $ as so much debt is denominated in $’s. Therefore, the demand goes up for $ to sevice overwhelming debt service. At least to this point, going against the MTF, has not been profitable.
I’m fairly new to John’s site and having found it gave me confirmation on what I’ve come to understand so far. It’s not based on fundamental or technical analysis per se but on money flow of the big players. There is a chart that came out weeks ago from Bank of America which showed the cumulative net buys of their clients up until the end of 2013. It also appeared on zero hedge but I found a good explanation of the chart on this link.
http://www.uniocapital.com/blog/2014/6/1/what-bonds-ma-and-individual-investors-are-telling-us
Essentially, the big players have been exiting for quite some time and selling to retail. And when an institution has assets that cannot be liquidated in a few weeks without letting everybody know what they’re doing (esp HFT), creating a panic and taking a huge loss in the process, they do so gradually manipulating the market higher and selling into it in a period that could take many months. There is only a small door to the exit and they’re not going to go through the door all at once. I learned this from an analyst I follow so this is as simplistic as I can explain it with my limited knowledge.
I was thinking more about the 60 year Master Time Factor (MTF) on my evening walk. I was thinking this cycle (2010-2070) should replay 1950 to 2010. Possibly a better way to look at it, is that this is a time frame for major turning points. Commodities appear to have peaked in 2011 as they did in1950. They were very overvalued in both time frames. The stock market was very undervalued in the early 50’s and are very overvalued now. Bonds were extremely high (low rates) then as now. Gold was undervalued due to price fixing, overvalued now. Real estate especially housing was in short supply and undervalued. Now housing in the US is overbuilt and prices still high. Population was exploding then, and topping out now. The $ was extremely overvalued then (my aunt who was married to a US Air Force sargeant had a Japanese maid in Japan). The $ was king. US gov’t debt levels were astronomical then as now. US consumer debt levels were nil vs too high now. So it looks like it could mark major turning points, not necessarily which direction.
Thanks all
Can anyone post the latest citi us economic surprise index.
thx
Page 4 Will
Click to access PEACOCKBULLBEAR.pdf
WORTH NOTING!
John points out above that the summer earnings season will start shortly and may disappoint. Well I mark the earnings reporting windows on all my charts as 5th Jan to 9th Feb…..5th April to 9th May …and 5th July to 9th Aug.
The largest pull backs this year have all taken place in the previous two windows.
From what I remember the Citi Eco Us index has been negative for a while and therefore tended to mean revert to the upside giving the market a nice tailwind. that would explain why the best performance has taken place between earnings seasons.
If and I say if , as I don’t know what the latest citi …looks like but if it is above the mean we could be entering a period where the earning and macro could join together in potential disappointment just as John suggests.
Thanks John
You are a star – as usual!
So looking at that nothing major has changed. It is still slightly negative which obviously suggests that consensus forecast for macro data are still cautious – with room for actual to surprise to the upside. Of course that may not happen. But it would explain why the periods between the earnings seasons, when attention tends to switch to more macro news, have produced slow grinding up moves.
Back to the original point …..we are entering a more interesting 5/6 weeks!