
Superficially a bullish breakout, but behind the scenes both the SP500 and Dow met DeMark’s exhaustion topping criteria yesterday.
Supporting that, the breakouts/rallies were on low volume, the put/call ratio for the indices (CPCI) finished at one of its lowest ever readings, and the CPC and VIX also reached contrarian low levels:
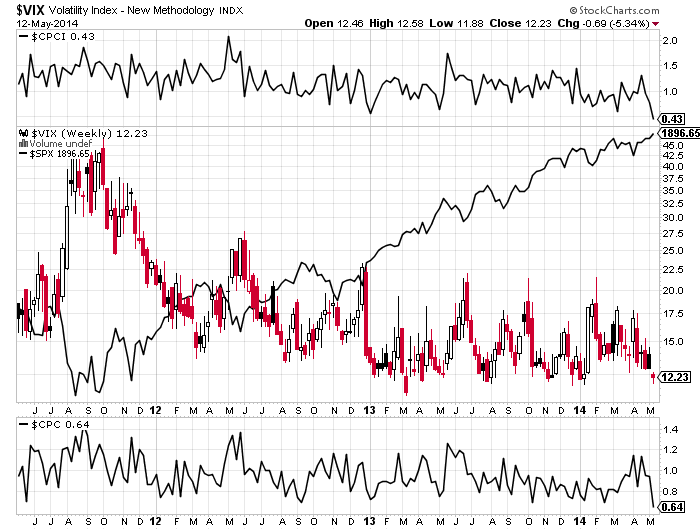 Source: Stockcharts
A longer term look at stocks volatility plus treasuries volatility reveals historic compression:
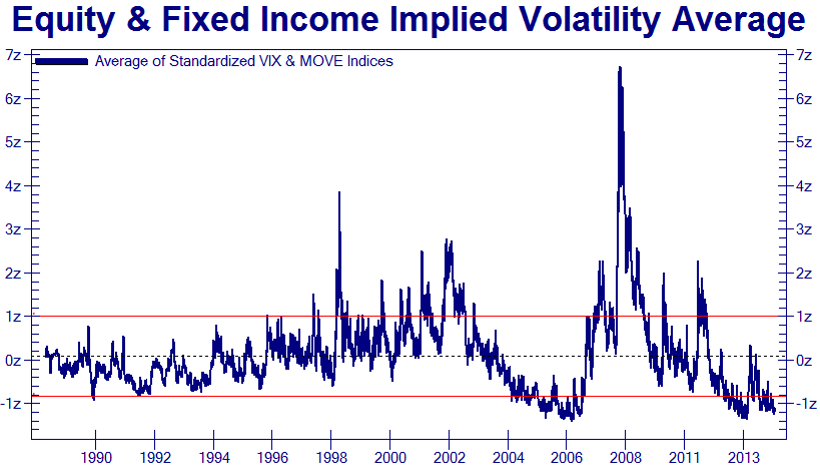 Source: @Not_Jim_Cramer
Sentiment remains elevated, as the March/April falls in the Nasdaq and Russell 2000 made little impact:
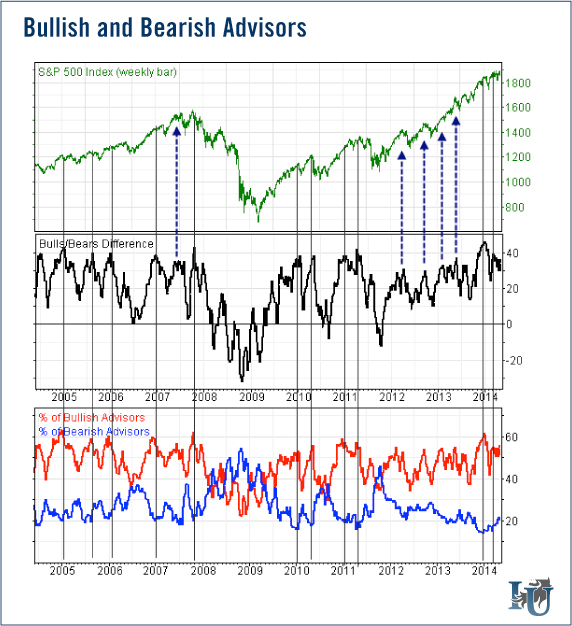 Source: Investment U
So, put/call, volatility and sentiment all signal high complacency, whilst the last time we saw such persistent money flow into defensives was 2011:
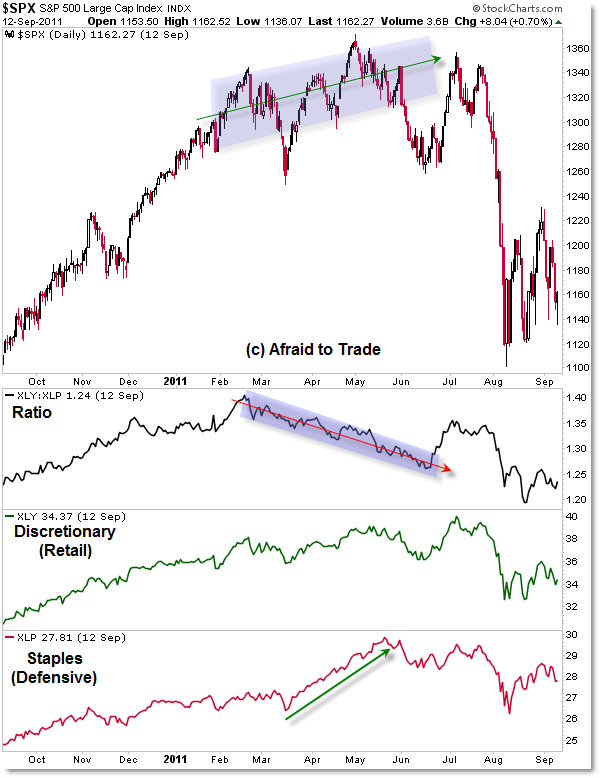 Source: AfraidToTrade
I’ve added again to the SP500 and Dow short positions. Tomorrow is the full moon, let’s see if we get an inversion and bull trap.
To finish, this is how the Dow peak looked at solar cycle 20 maximum, namely a topping process at a turn-of-year solar top:

Underlying Source: FiendBear
As things stand, the current solar cycle (24) smoothed peak is likely to have fallen circa Dec 2013, the monthly sunspot spike in Feb 2014, the real Dow peak likely end of Dec 2013 and the secondary high here in May: all very similar to 1968/9.

Insane to add shorts.
Not adding, but the last two days IS hurting.
Thanks for updating the progress of this Solar cycle John. Always appreciated.
I will leave you with this:
That’s a very compelling chart, and of course its very unlikely to be different this time. But on those two previous occasions it took 3/9 months from that scenario, and significantly higher prices, before the US stock market rolled over.
That could easily put SP500 at 2088 sometime between July and November.
Considering going long NUGT, just need a tad more confirmation on the charts and from gold also. Gold still looking like it has definitely bottomed and headed higher intermediate term.
I think it is only a question of time before the dollar takes out support around 79.00
http://stockcharts.com/h-sc/ui?s=NUGT&p=D&b=5&g=0&id=p22270081326
Part of the bullish case for Au. Those three candles, that I will name “The Three Sisters” after a rock formation in the Blue Mtns west of Sydney and the associated volume.
http://stockcharts.com/h-sc/ui?s=$GOLD&p=D&b=5&g=0&id=p00188001905
You are contradicting your own research. The only thing were you have an edge is lunar cycle and we are soon entering into positive period so why do you wanna short. You are betting on the exceptions instead of following your reseach because you want to be smart instead of being profitable. The research for the solar cycle does not have and edge even though it is interesting in fascination. Stay to were there is and edge instead of trying to fit your own bias to the market. You have been wrong for 2 years.
My first Dow short was entered in November, my first R2K short was December, my first SP500 and Nasdaq shorts were February, and I have built up those positions since. If you are going to be critical, be accurate, be respectful and back it up with evidence. Or be deleted.
While I admire the conviction of adding to shorts
with continuing market gains,
that appears a high risk strategy.
Interesting US session in prospect today.
On the surface the high risk strategy is short. Beneath the surface the high risk strategy is long. Beware price-cheerleading.
And you know this how again? The only strategy that is low risk, is cutting losses.
John, do you have stops for your positions, hard stops or “mental” stops? Do you have a price that if the SPX exceeds you will reduce your short exposure, hedge the shorts, or close short positions altogether? Tough game here, most of us know that tops are a process rather than a single event, and they can take months to form. Staying short thru the entire topping process takes conviction and fortitude! Good luck to you!
Thanks for your posts. I am torn right now on this market. Usually new highs mean more new highs, but the VIX is at a really low place…..that that is concerning. The next few days will be telling. I was short and got stopped out yesterday by a penny……
A trendline has been developing on SP500 since 24 June 2013, and tested from above six times (temporarily breached October 2013 and February 2014). Price has been below it since 7 April 2014, with two failed attempts since to break back above. It is around 1905 at the moment – any signs of a reversal there will be another opportunity to go short I think.
However, the longer it takes the higher the trendine will go…
The problem with comparing to 1968/9 is that the secondary high never exceeded the first high. We are due a correction but QE has significantly distorted anything that has happened in the past.
This is how I see it:
John’s work on solar cycles and demographics certainly suggest that the overexuberances of this cycle will most likely come to a sticky end. The big question is when is it LIKELY to take place.
There is a well understood pattern of a “normal” presidential cycle. the incumbent administration dampens pro economic expansion for the first 18 months and then stokes the economy for the rest of the cycle. There is so much evidence for this that to ignore it is like arguing day is night.
in an effort to get easy answers people like to crunch all the cyclical data so they get an easy to follow path. In this case you can do this up to a point as there are two term presidencies. As a general rule,in the second term the administration will hardly dampen things and will, if possible, let things run to the upside for fear of killing their legacy. The obvious danger to this management is that they may, and often have, let things develop into some form of a bubble. It happened under Reagan and Clinton and Bush. So will it take place under Obama. What is his achilles heal.?What are they putting sticking plasters on now when they should be doing invasive surgery?
I’m no expert but from a common sense viewpoint it would seem the the man in the street may not be rich but he has sorted his finances out to a degree. But only to a degree – and the disparity between the rich and poor has grown under successive governments, left or right, to the point that one feels that it can’t carry on without something giving- I’ll come back to this. The banks and companies have again to a great extent bolstered their balance sheets – so this leaves all the debt sitting with governments. This at some point has to be the greatest unravel. Is this what the US should have applied invasive surgery to 18 months ago?
At a super macro level we do indeed have a world where, to use John’s expression, everybody is ….all in…..yes ….to capitalism. After the post war debt/inflation was worked through I believe the massive asset run was fuelled by technological advance but also the collapse of communism. Hundreds of billions worldwide were gradually redirected away from arming nations and put to more effective use. At least in Europe, the physical “fall of the wall” set a new environment where free movement of labour acted as a major wage deflationary influence – this in turn fed into the deflationary loop which encouraged a desperate search for yield – hence over securitisation etc.
So here we are. Solar and demographic analysis suggests that the western developed nations are still unwinding or contracting. The whole of the world is all in into capitalism with really only the North Koreans left.The Chinese have effectively adopted capitalism and even the the Russians are ho humming about whether they want to give a bit of it up in lieu of a land grab – but you can feel they don’t want to give up. The problem with super macro politics is that it has a self feeding element to it just like stock markets. But just as markets swing back and forth to see where the buyers and sellers are so does accepted political views. Just as with a stock markets inexorable rise positive feeding to the point that no challenge to its direction seems sensible, ” the canary in the mine” is often divergent internal stresses. I wonder whether the divergence of rich and poor to amazing degrees just maybe a warning sign of tectonic economic or social movements ahead. Are we looking at the US desperately trying to keep the whole thing going and praying for a soft landing? Maybe we are seeing signs of self doubt as the recent best seller in the US by Thomas Pickerty calls into question the amount by which laissez faire economic fiscal intervention has been allowed to run. We’ll see.
Back to a shorter timeframe. So IF there is to be a major wobble when , by history, when is this likely?
The drivers, economic/political, behind the scenes that produce the environment which in turn produces price action put in place by the major nations have a natural cycle length. The US is still world dominant in this respect. Obama’s presidential cycle is very similar to all others but very slightly different. His first year was used to prime things. He entered office after a crash, just like Bush snr and therefore, the risk was depression so just like Bush snr he pumped straight away. So year one into May two was strong.In term two this is where we are now. If you view a graph of 2009 – 2012 you will see the general shape of his term. Remember the sweet spot of any presidential term is from Sept yr 2 to the end of yr 3. This is when you get the peak excitement – whether in stocks or commodities. It has happened in stock markets and the top in PMs was 2011 – yr 3.
So the second Presidential term, where we are now , is characterised by a similar shape to the first term but with smaller draw downs. The drivers are ratcheting it up with no obvious break. When mid year 3 is reached if fundamental problems exist then history tells us that markets have a tendency to crash.
Currently, we are just inside one of these relatively poorer performing periods, corresponding to the mid two quarters of 2010 but I personally don’t think the drawdowns will be as large as 2010. Shorting the market in this period makes sense but given the historic second term upward bias a careful approach is needed. If no sizeable retracement takes place by say september this year then again the stats suggest it won’t happen until summer 2014.
Will,
Re-posting link of Grantham’s quarterly letter where he writes exactly what you are saying about presidential cycle. But I do feel we will see sharp 18-20% correction before May end / Mid June 2014.
Click to access GMO_QtlyLetter_1Q14_FullVersion.pdf
Hi Jigs
Thx for the reply.
Let me be clear. I am short and will short higher because I feel that even if it rallies to 1950 in the next week or two it will go lower than this at some time but I’m not convinced of a crash yet. But who knows?
Will, What is your plan if SPX goes to 2250 (Jeremy Grantham’s target)? Thank you.
Hi Alex
Well first I took 90 points out of the SP500 in February on a highly leveraged trade and have only shorted it again at 1890 about a month ago. I am not very big for two reasons: I felt if it hadn’t been for the Ukrainian situation the market would have gone to 1950 in that run – so a rally there was a distinct possibility ; and the short position in the Nasdaq was so great.
If it rallies I will look for sell set ups or if it breaks back down into value I will sell it.
I’m not saying that it won’t go to 2250, but I don’t believe it will run away over the next 3 or 4 months. Within this period there is room to trade the bear.
Hi, again: the structure is similar to the upward wedge 1909-16-19, surpassing it in 1919 in the Dow Jones. Patience. If you trade with ETF´s levels around 16- 17K , -even 15K (Industrials) are appropiate to salivate this year.
Observe that 2nd and 3rd scenarios I talked before indicate tops ending may-beg jun´14 in the way 2007( 2011) (2nd) or sep14 (3rd), within a intermediatecorrection among 1st and last one.
Anyway, can make a mixture of the 2 scenarios and insist that 15-16-17+ leves for the Dow Jones are (for me) are suitable to be short and if we see a euphoria next days/weeks/months I will add laverage.
In the other hand, yesterday break in Dow Jones, Transport and S&P is what we need to see bullish trust in equities and bearish exhaustion.
Don´t be discoureged, John it is a matter of time, and price.
@apanalis
John, your charts show low VIX and low CPC didn’t work in 2013, by themselves are not sufficient to mark a top.
Nasdaq breached 50-day MA resistance yesterday and closed above and that is bullish.
Mutual funds sitting at 5% cash, which is the highest in past 2 years. That is also bullish.
Did you cover your short then?
John, I am short from 1897, stop still at 1901 which to my surprise was not touched yet. I am not bearish except we may still be in a choppy trading range. I would likely be out of this short for 20-30 points, will update here.
Stopped out for -4 points.
John,
I am seriously doubting your theory.
I think there is fundamentally something wrong with the research. You are not fully considered co-ordinated Central Bank efforts. Your case of sever decline will only pan out if CB’s of the world give up. Now whats the logic or incentive for them to give up. They have a job to keep the markets under control. may be we get some corrections from higher levels.
Bill
And you are only realizing this… now? News flash: No one has the Holy Grail. Use a stop and protect yourself because no one else will. Then you don’t care if his theory is right or wrong because if stopped out, small loss is no big deal. Always protect yourself. Keep your loss small. Keep your gains big.
Regrading “co-ordinated Central Bank efforts”, we know that due to ‘tapering’ the liquidity will be drying up gradually towards the third/fourth quarter, if one believes the Fed is actually ‘tapering’, that is.
Bill,
Obviously the CB’s are working to keep the system from falling apart. But this is something they’ve been doing for a while a while now, right? During the past few years of QE, we’ve had some sharp moves down in the market. In 2010 the market moved down nearly 20 percent, and in 2011 the move down was over 20 percent. CB’s were alive and well then, and yet the market seriously corrected. So that can certainly happen again–and will happen again, we just don’t know when–regardless of what the CB’s do.
Very sensible, pimacanyon.
For those who think this is a liquidity-driven market, please note that the corrections in 2010 & 2011 were related to the absence of QE liquidity:
The Fed is said to be tapering towards the end of this year, so the QE liquidity will once again be drying up in the 3rd/4th quarters. Take a look again at the above chart to imagine how the stock market is going to respond when the punch bowl is taken away.
With the dismal GDP in the 1st quarter (and possible downward revision in the future), and today’s poor retail sales report (70% of GDP):
http://www.advisorperspectives.com/dshort/updates/Retail-Sales-in-Review.php
The gradual decrease of liquidity will sooner or later bring the stock market to a more realistic level.
I am out of SPY shorts but I am buying UVXY (VIX) now 45.27. Regardless of what market does, VIX is very low.
UVXY 45.60 now at 11:17 AM, stop moved to breakeven. Time to relax.
you are ADDICTED to cheering leading your own trades. .
From Ben Hunt:
1M implied volatility on the VIX fell to an all-time low last week. Generally speaking, this means that options on short-term market volatility increasing have never been cheaper. How is this possible, you ask, with outright war simmering in Eastern Ukraine and China flexing its muscles in the South China Sea? Because Mario Draghi is “signaling” that he’s going to launch a European version of QE. Because the Narrative of Central Bank Omnipotence has never been stronger, and for markets this is the only thing that matters. Because we continue to live in the new Goldilocks environment, where mediocre growth is not so weak as to plunge us into recession but not so strong as to take central banks out of play.
If the news gets a lot better the market will go down, and if the news gets a lot worse the market will go down. But what I call the Entropic Ending, a market-positive gray slog where global growth is more-or-less permanently crippled by the very monetary policies that prevent global growth from collapsing, can go on for a looooooong time.
From the tradetrekker.com blog today:
In accordance with Tom DeMark’s recent interviews, the Dow Jones Industrials (DJI) is in the realm of a top. All of his price conditions have been met, which were a new all time closing high above 16,581 and a higher high above 16,661. The Dow closed at 16,695.47 and the high was 16,704.84. If the DeMark scenario holds, the Dow and the SPX needs to start showing weakness, as soon as the 4 hour SPX hones in on their exhaustion points outlined below.
Seems to me that some of you are letting fear change your hypothesis. If sunspots play such a critical role then why aren’t you looking at what is currently going on? Just because we may have reached peak in Dec 2013 really doesn’t give you the timing since history has shown that there is a large window that the actual decline will occur. If you look at the current “weather” on the sun we are in for a surge in spots in the next few days and coupled with a positive lunar phase indicates a short term BUY according to YOUR philosophy.
I suspect it would depend on whether the euphoria for the extra spots are balanced with the depression from geomagnetism. I feel like this is like trying to predict when a happy drunk will crash. He keeps drinking in the sunspots and we keep thinking he is going to crash real soon…the window is probably 1 year or greater around solar max. For example in 1929, the peak was way past the window.
I can understand why someone would be bullish on specific stocks, but to say that the whole market has significant upside seems quite strange given John Hampson’s collected data, declining global economic momentum, and time based exhaustion. The 90’s rally is not the normal market, it is an exception. Wall St. and fed are desperately trying to recreate that momentum but it isn’t meant to be.
Who is to say there isn’t significant upside. Billionaire trader Paul Tudor Jones says “There is no training — classroom or otherwise — that can prepare for trading the last third of a move, whether it’s the end of a bull market or the end of a bear market. There’s typically no logic to it; irrationality reigns supreme, and no class can teach what to do during that brief, volatile reign”. GMO’s Jeremy Grantham says 2250 for a top. Is that significant to you?
You are thinking the market repects “data” when it is in fact chaos driven by psychology and greed. No level is too high and no level is too low. Use stops, manage your risk, and it won’t matter.
Bill, have you actually considered that QE may end up imploding the markets?
Also what happens when we get another recession which will happen at some point? QE will have failed and CEntral Banks will have no other weapon left to fix the economy and this will lead to John’s theory of short and hold far into the future.
Agreed but as John said, the key is not to blow up. Being short by definition means using margin. Unfortunately, that contributes to the margin debt shown in John’s charts, which might not have the same meaning before hedge funds.
This reminds me of May 2013. After non event FOMC statement, the Dow broke out to new highs. The session after break-out day was a narrow range day, although it was UK bank holiday (6th of May). Then the price crept up and reached 700 points from break-out before end on May. June 13, with it’s taper FOMC statement, retraced all the gains. Personally, I wouldn’t recommend to anyone to be short the maket, hoping that it will retrace, as it usually does. What if it’s different this time, a parabolic move ahead? I don’t trade fundamentals, but here’s what I have to say about fundamentals : respect the price, it bears what you may not know.
‘In price there is knowledge’.
If Obama says fuel prices go down, while you pay more every month at the station, whom do you trust, Obama or the price?
How often did the market crash during earnings season?
I am not sure if it matters. Crashes are by definition rare.
I think it never crashed during earnings season but I might be wrong. If anyone has any data on this that would be appreciated. Many thanks.
First there will be the explosive advance in the stock market.
http://armstrongeconomics.com/2014/05/12/crash-or-collapse/
Who knows !!
THE MARKET WILL PEAK ON THE 19TH OR 20TH
This is the best chart a trader can have
http://screencast.com/t/Rnu7QudaLcF1
Price 1920-1923
BBC Documentary
The Secret Life of the Sun
http://www.youtube.com/watch?v=zhasW2STixg
At 52 minutes information about sunspot magnetic field strength decreasing the last 10 years.
Sigge
It is easy to convince me of the bear case, so 40 indicators overwhelm me, but tops can really wear one out. The recent action in the $ could be a major bottom. That would give credence to a decline in commodities. Frequently, stocks go down with a rising $, but not always.
Overall, I am looking for another deflationary hit. Strong $, weak commodities, and stock mkt, higher bond prices. Possibly, a credit squeeze causing rates to rise first. So possibly, the $ is leading the way on some sort of squeeze.
Qe is only one side of the fence.
Reverse repo.
Is the other side
http://www.newyorkfed.org/markets/omo/dmm/temp.cfm?SHOWMORE=TRUE#TOP
Tommorow will be a down day..
Joe
Hi John, I agreed with your views. it is not a free market. what I see is that the ‘plunge protection team’ is working very hard to hold the market. However, everything must have its cycle of high & low. Let’s those with firm conviction will smile till the end.
Yes, John is right and this smacks of exhaustion move that is defying logic and insulting even most hardened bears. But this is as we all know completely normal for stock market to defy logic in the short term. Of course everything is possible, including further run up until Sep-Oct but my bet is that this 2009-2014 bull is finished after maybe one more move into SPX 1910-1920 zone. Patterns are clear and there are many examples of such final exhaustion thrusts in the past. They all look similar and all defy common logic. It would be interesting omen if SPX tops at 1914 or 1918 level as this may give hints for future events awaiting us… Currently investors are not afraid of international politics exactly as were in July of 1914. What if trading is suspended for few months like in 1914 ? US will not be safe haven as it was seen in September 1939. NYSE was closed on July 31 1914 and stayed closed until end of that year. If conflict breaks out there will be “torschluss panik” event as described by Charles Kindleberger in his classic book on financial crashes. Major markets will close for weeks or months and OTC platforms will not provide enough liquidity. Shorts will not get paid as well… Closing of exchanges was unthinkable for investors in 1914 exactly as it is today. I am not saying that “event” will take place next month or even this year, it can happen in the middle of downtrend in 2015 or 2016. But its possibility increases by day and each investor has to bear it in his mind. In the meantime I am closely watching Gold and particularly USDJPY chart which is big warning sign.
Right. Though, the exhausting stock market needs more liquidity to pump it up. However, with the punch bowl being taken away as the taper continues toward the end of this year, where is the liquidity? To get away with it, the Fed might as well let the market fall by engineering a manageable crash, such that another round of larger QE is to be warranted. Besides, who in the right mind would believe they will really stop printing money to finance their budget deficit, just look at the dismal GDP in the first quarter. Let’s keep our fingers crossed.
Nasdaq sitting at the top of its right shoulder.
RUT
hourly – http://imgur.com/92OXdug
2.hourly – http://imgur.com/qAo3Ywa
daily – http://scharts.co/1jGj1me
INDU
2.hourly – http://imgur.com/phNqmUC
daily – http://scharts.co/1jGitge
This is why HFT has to be abandoned NOW!
Aside from the fact that it is unethical and IMO just plainly corrupt, sooner or later it will lead to an all out market collapse.
http://thekeystonespeculator.blogspot.com.au/2014/05/flash-crashes-and-flash-spikes-occur.html
I’ve said it before and I will repeat it again.
When this market really goes over the waterfall, all short positions will be cancelled.
Only those that have exited their positions and taken their profits well before hand will gain any benefit.
10 year Treasury note ($tnx) rate just broke below February”s low and trading at 2.568%. . …so could bonds and stock bulls both win?
This can go on for a while because the 10-year yield is still quite low compared to Europe and Japan. Meaning it is attractive to foreigners buying bonds and the drop in yields may not have any negative effect on stocks.
Buying of treasury says investors see no economic growth. Perhaps the financial boy scouts are buying in preparation for a flight to safety and worse, stocking up for a demand for quality collateral.
I see the best the stock market can do in 2014 is to go side way or slightly down..
US treasury (10 yr at 2.54%) is such a good deal when German 10 yr bond is yielding only 1.37%; Spain’s is at 2.86%; Japan is sub1%.
Short term that kind of thinking will not help your shorts. Treasuries have been going up since April 21. How have shorting since then work out?
My input is not about shorting (stocks)…it is about the yield curve and how to play it.. The curve starts to steepen again…Owning some steepener in your portfolio may work for the future.
Can you image the effect on the yield curve if the Fed can successfully ignite growth and/or inflation?
There are steepeners sold by the big banks that guarantee 10%/ per annum payback for the next 4 years..
Charts don’t lie when correctly analysed. Just look at the JSE futures index (South Africa) for example. It is in the final extension of the most classic example of a Diagonal Triangle (one of 13 types of Elliot Wave) that I have seen and from which all is made abundantly clear. It is a fully confirmed pattern and unless it becomes warped into a 3rd extension (presently in beginning of (iii) in the extension of the 5th wave) then it points directly to end of May for an overthrow capitulation. If extended further it could make end of June, but not July. The JSE daily volume is typically 80% foreign. It most certainly does not have a mind of its own. The straight retracement of the Diagonal Triangle pattern will be 15% from current level which will still rise and probably overshoot the steep boundary. I expect 20% from an end of May top.
Wednesday’s action was very promising for the bears. Of course from bullish point of view it looks like classic move to broken resistance and nobody is afraid. That is why VIX is at record lows with even Monday’s gap not filled. I am looking for continuation into last consolidation zone and SPX 1830 possibly next week. Of course bulls can gap up on tomorrow’s job report and VIX can drop to 10-11 zone but I treat it as lesser possibility. Bull markets do not significantly extend with levels of optimism such high. On the other hand exhaustion pattern would be more clear if we reached SPX 1920 after some consolidation. If we immediately drop from here then I would be considering retest of the top in Aug-Sept.
If it starts to drop in big way I will not be looking for support zones to close positions as old bull market logic will simply stop to work and it will be very hard to join the trend again.
Yes, all now depends on how the week ends. Yesterday’s full moon inversion at Demark exhaustion levels needs to be followed by a break back into the range to complete a fake-out. R2K has already rolled over again, and treasuries broke out, adding to the set up. Vix, as you say, is at contrarian levels.
You are not studying the VIX far enough. You sound like CNBC VIX analysis. Show us a statistical study that the VIX matters by using all data instead of a time period of your choice. Many thanks.
Many times in history the vix stayed pushed down for a long time i.e. several years. It is not a good indicator.
Again over personal. All that is being said is that the volatility is low and therefore there is considerable room for the tempo to pick up.
On a daily chart using 67 data points and 2 sd bollinger bands …….the bands are the tightest they have been since July 2007. Thats not a prediction of direction merely a fact.
My theory is that the moon causes volatility. The moon travels from apogee to perigee; comming closer to earth and drifting away.
The amplitude of this movement is not fixed; it varies in time.
This month we have seen the smallest amplitude in a very long time. Now this amplitude will be up for a long time.
This would fit nicely with a bb squeeze on the vix. It certainly explains why the vix has been so low so long.
very good thank you
Definitely, we should have the answer soon. One of my favourite set ups in a directional channel up is to buy straight at the open on Wednsesdays and Thursdays, where the price is most lively – likely to go somewhere. I was stopped out yesterday, buy after a down Wed, we may have an up Thu. I am not saying I like the price action, but I enter the predetermined set ups even when I don’t like. I may be right not to like, but since I don’t have a rule or knowledge why I don’t like, there is no disagreement. Looking at selective stocks, the charts point to futher range. If the Dow slips into the range, I will switch to my range set ups straight away.
As to Gold, Silver, Platinum and Palladium, they all went up a bit, but the weekly charts don’t give buy signals, only a gamble as to the direction. My long gold was a gamble, it’s not what I do usually, but I like gold now, have no knowledge why I like, therefore I permited myself a trade whose size won’t hurt me.
FWIW, DeMark called for an imminent top in India on Bloomberg radio yesterday, and reaffirmed his expectation of a top in U.S. markets.
Perhaps it’s time to have a macro view after debates on short term movement.
Here is a little study of the US economy vs. the international economy, with the conclusion that “one of a growing relative concern of the domestic [US] economy over the international economy.”
http://gavekal.blogspot.ca/2014/05/should-we-worry-more-about-us-economy.html
Russell 2000 about to break below low, or double bottom?
Maybe, just maybe, 10 yr yields drags the Nikkei below 14,000 and gets this thing moving. Very close to breaking prior swing lows.
Oscillators on the 10 yr suggesting this move is the real deal.
FAS- as it has been the last four years, the BEST trade signal is rotated through the etf’s… in this case the best sell with tightest stop came in the FAS basis the 1.128 red line green set …. a setup i have shown multiple times and referenced….. price has now traded to target line…. let us hope that line gives way an price heads sharply lower once again
http://stockcharts.com/h-sc/ui?s=FAS&p=60&yr=0&mn=0&dy=19&id=t60219463421&a=333551866&r=1400169259850&cmd=print
A note on the history of red line green set variations…. used to be the highest probability trade I had IF took profits at the medianline…. probability of reaching lower line was much less…… it rarely went there….. but recently probabilty of move to medianline has reduced at the same time probability of move to lower line has increased… only know this from tracking and trading endless examples…
From Jeffries:
We looked at the last 20 years to see how long it took for the Russell/SPX underperformance to trough following 5%+ underperformance of the Russell.
It takes a while.
In the 14 instances of 5%+ Russell underperformance that we examined, the median peak to trough pullback was 12%, and the median amount of time it took to get from peak to trough was 152 days (about 5 months), which would take us to August 17, 2014, based on the Russell peaking on 3/18/2014.
In terms of magnitude, if the last 20 years of history is a guide, we’re due for another 3% of underperformance–we’ve seen 9% underperformance since the 3/18/2014 peak, and the median underperformance is about 12%.
Once the momentum and psychology around the small cap trade breaks, this data shows that it takes a while for it to come back.
Bubbles waiting to burst in the art and stock markets? Or the early stages of a race to get out of currencies? http://www.artinamericamagazine.com/news-features/news/christies-racks-up-7449-million-at-contemporary-art-sale-largest-in-auction-history/
“A third of buyers were new to Christie’s”. What effect would 33% more buyers have in the stock markets?
And we have two more years of a solar maximum that doesn’t want to completely say goodbye. http://wso.stanford.edu/Polar.html#latest
With a lunar orbit perfectly set to cause maximum disruption, as evidenced by the forthcoming total eclipses…
I see a global theme of worker uprising. Profits are not making it to those that actually do the physical work and take risk in industries, while wealthy are flaunting their success. Latest is Turkey mine disaster. Trend started in ~2000 but is picking up steam.
Bollinger Bandwidth (20,2) on S&P500 weekly chart, currently at the lowest level since the 2011 crash, signals a large move ahead.
Why those bollinger numbers? Are they magic? Why not use pi squared?
If one is unable to see the obvious correlation, I guess they are not.
Quad G has a great chart on the 26 week cycle in gold. He also recently posted a great chart showing the correlation between gold bottoms and tops and full/new moons.
I think I’ll be adding this guy to the top of my favourites list right along side John.
http://majormarketmovements.com/golds-26-week-cycle-bottoms/
http://majormarketmovements.com/gold-and-the-moon-cycle/