
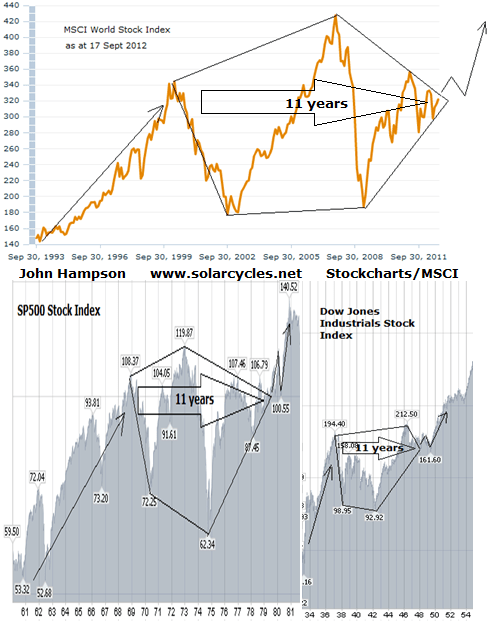
Secular stocks bear markets track overall sideways in nominal terms due to inflation, whilst price/earnings valuations gradually fall from expensive to cheap. The shape and development of the current secular bear market, which began in 2000, bears resemblence to the secular bear of the 1970s and the secular bear of the 1940s.
Here is the MSCI world index and the secular bear that began in 2000, compared to the SP500 in the 1970s and the DJIA in the 1940s.

Here are the individual SP500, Dax and FTSE charts overlaid on each other for the current period, showing that they all made the similar pattern.

In the last couple of years of the pentagon patterns in the previous secular bears, the markets contracted into a range and coiled, before breaking out to the upside, then backtested the breakout level before advancing in a secular bull of real momentum. In that pre-breakout phase, the markets were characterised by a loss of appetite for equities – the final washout after a decade long sideways grind.
We see that in the current market environment, through shrinking stock market volume, declining reading/viewing figures for financial media and equity fund flows persistently negative despite the stock market performing fairly well and bonds at extremes of expensiveness paying negative real returns. The chart below shows the difference in fund flows into those two asset classes despite equities yields at record attractiveness compared to bond yields.

This next chart shows that flows into bonds or equities largely followed the fortunes of the two classes, but since 2009 there has been a disconnect, whereby funds have flowed into bonds despite equities’ performance improving in relation to bonds. This also demonstrates a washout in appetite for equities.

Source: JP Morgan
A common way of measuring the end of a secular stocks bear market is by price/earnings valuation, with the rule of thumb that valuations have to reach single digits to become extreme cheap enough to bring about a secular inversion. However, the valuation reached depends upon the measure of inflation used, because, for example, for p/e10 a higher inflation estimate increases average real earnings over the 10-year period, and thus lowers the P/E10 ratio. Official CPI inflation stats calculations have changed since the 1980s but these form the basis for most p/e calculations.
Nowandfutures generate their own inflation data to compensate for the CPI changes, and the real inflation adjusted long term Dow moves from the blue line to the green line in the chart below. That makes a big difference, as it makes the 2009 low an extreme secular low and our current position still below the long term trend, i.e. a longer term buy rather than a sell.

Source: Nowandfutures
Similarly, Shadowstats provide their own inflation measure that attempts to keep inflation calculations consistent over time. Dshort’s real S&P Composite Index adjusted for Shadowstas inflation paints a similar picture to the one above, which is that 2009 marked a secular low extreme and that equities are still an attractive buy at the current level, 45% below long term trend.

Using the same Shadowstats data, a discontinued Dshort chart reveals that the S&P p/e10 would be currently around 15, having come down from around 35 at the secular 2000 peak. With history as our guide, we should expect this p/e10 to drop again below 10. This can be achieved by stocks falling, by inflation rising, or some combination of both.

A look at price-to-book valuation also shows that both US and European equities are approaching previous secular lows, but could drop a little further yet.

Shiller p/es reveal Europe to be closing in on secular cheapness.

Looking at Japan, the cyclically adjusted p/e shows a similar picture: getting there, almost extreme.

MSCI’s global equity index forward p/e valuation is currently around 11, which is also approaching secular cheapness, but could fall a little further yet.


An alternative view of secular bear progress comes through US consumer confidence, which reveals similar developments in the 1970s and today. A further dip in confidence would complete the pattern and this would probably occur with an economic slowdown or stocks bear.

Underlying source: Sentimentrader
Returning to the secular bear pentagon patterns at the top of the article, after stocks broke upwards out of the pentagon in the 1940s and 1970s, stocks retreated again the following year in a successul backtest of the breakout level, before advancing in earnest in a secular bull of momentum. I suggest we are currently breaking out of the pentagon in the final third of 2012 to complete an overthrow for equities as we move into 2013, before we make that retreat in stocks to retest the breakout. That retreat, accompanied by rising inflation, should provide the drop to single digit valuations for those indices that still haven’t hit extreme cheapness. Bear in mind that not all indices will hit single digits as, for example, Japan ended the last secular bear at CAPE 20.
Following the secular bottom, in this instance 2008/9, there is a gradual process of repair. From financial system meltdown in 2008 to European debt crisis in 2011/12, that’s improvement in terms of global accuteness and that improvement is reflected in stocks moving higher.
Recall how derivatives had mushroomed into a major system threat by 2008. Since then the size of these markets has gradually come under control.

Source: Nowandfutures
Recall the accute sovereign default risks in certain countries in 2011 and earlier this year. The past 6 months has seen reductions in default risks across the globe.

Source: Bespoke
Recall the major real estate bubble into 2005/7. Since then real home prices have been fully deflated (in the US).

Recall household indebtedness, related to the real estate bubble, had reached excessive levels. This too has been repaired with time (US chart again).

Clearly not everything has been repaired. Global economic growth is currently fragile, and leading indicators generally weak. Central banks are still intervening with support and stimulus. However, secular stocks bulls don’t begin with everything repaired, they begin from very dire circumstances. I can argue that the secular stocks bull really begins at the secular nominal bottom, in this case December 2008 / March 2009, which was when things were at their worst. Federated Investors echo this view:

Source: Federated Investors
What secular history shows us is that stocks are unlikely to return to those 2009 lows or get anywhere near them. Our closest historical mirror is the 1940s secular bear because interest rates were kept negligible due to excessive debt. With central banks committed to keeping interest rates low in our current environment until recovery is entrenched (which will by association mean a secular bull is entrenched) we have even more reason to expect stocks to perform well, because their attractiveness strengthens relative to bonds and cash. Stocks dividend yields are at record highs versus treasury bond yields. This could mean that this time round, US equities do not need to drop to single digit p/es, because they are already at secular cheap valuations in terms of comparative yields.
Let’s draw in solar cycles and understand that a recession has always followed a solar maximum, and the solar maximum is forecast for 2013. Based on previous timings, we might expect that recession to come to pass 2014-15. Using the 1940s as our closest historical mirror, the recession could well be mild, as ultra low rates and central bank support are likely to persist through it.

Usually, stocks turn down roughly 6 months before a recession begins, as a leading indicator. This is how I see the price action in equities unfolding:

The topping out in the stocks cyclical bull (since 2009) should be a process – a trading range at the top, as seen in 2007 and 2000 on the chart. A high and then a retest of the high, but with negative divergences telling at the second attempt. I suggest stocks will top out as commodities really take off, with a big move in commodities bringing about an economic slowdown / recession. Stocks should therefore act as a leading indicator of that slowdown. I suggest stocks can reach 1600 on the Sp500 before topping (1600 is not my call for a top but a reachable level), and then retreat in a mild cyclical bear to go with the mild recession. As per the pentagon charts at the top of the article, stocks may pullback to 1300 or so in that cyclical bear, before advancing in earnest in a secular bull as of sometime in 2014.
Let me finish by contrasting my forecast with the very bearish projection that some others are promoting, because it clearly has huge implications for positioning. This is a chart with text from the Financial Tap, but I’m not singling them out – there are several well known sites publishing something similar.

Source: FinancialTap
It looks technically compelling, and the supporting arguments run something like this: despite all the easing and stimulus the world economy can’t get any sustainable growth, and when the penny drops that central banks are impotent, the bottom will fall out of the market. Not only that but excessive debt has not been resolved, and a sovereign is going to default sooner rather than later. Excuse me paraphrasing, but you get the idea.
My argument is this. There is no historical precedent for that major third collapse from previous secular bears. Any ‘third’ low is much higher. The shaping out of the 1940s and 1970s bears from this point is bullish, not bearish. Furthermore the current environment is one of ultra easy monetary policy, together with central bank commitment to stimulate and support like never previously, which really provides great support for yielding asset prices from underneath (cash and bonds are paying guaranteed negative returns, which improves the picture for equities yet further). What is more, equities are historically at cheapness extremes versus bonds, and also cheap in relation to commodities. Some European countries are at absolute secular valuation lows. The Eurozone is committed to staying together and to not allowing a default in any of its members. Their step by step measures, and other repairs in the global economy and the markets since 2008/9, are genuine reasons for equities to be much higher. Sustainable growth will be the last piece: once we are growing sustainably (technological evolution continues its parabolic ascent), the secular bull will be mature and some way higher.
What if this time is different? It is absolutely concerning that exponential trends in population, consumption and debt (brought forward consumption) are unsustainable in a world of finite resources, and our debt-based money system and policies of permanent inflation threaten to eventually accelerate to either system collapse or hyperinflation if no changes are made. However, none of those issues are at crunch point YET – we are just further up the curve. On current trends, humanity faces a true crunching of these issues from around 2030 to 2060. Between now and then things may change and exponential technological evolution has the potential to deliver solutions to some of these issues. Should no solutions be found, then we still have ‘room’ for a secular bull market in stocks before the crunch. An acceleration of the debt parabolic has defined these last few years, but once sustainable growth re-emerges, we will see an end to these large debt accelerations (not a resolution, just a slowing). I predict debt to be maintained at ratcheted-higher levels, and inflation to be permanently ramped higher, with the latter assisting in containing the former.
Coming Next: Forecast 2013 Part 4: New Secular Bonds Bear Market

John, but the sp500 fell 20% 1978 after +78% 1976, but now +121% from mar09, only -22% oct12. The structure from marc09 is so different.
You can see the Industrials, drop in 1975, 46%, after recovery +80%, but 76 -28% and in 1978 nearly -30%. From 09, +130%
More purge now, in medium term. About 25-30%.
Similiar from 1906-23.
Thanks.
The worst drop we’ll probably have in the short time this secular bear’s got left is a drop of 20%, any major crash like we saw in the mid 1970s or 2008 is highly unlikely. This bear market is mature and as John said, the markets tend to oscillate in a narrow range, coiling before blasting up to a new high at this pount. Using precise numbers is risky, as the past doesn’t act as a totally perfect prediction for future percentage movements.
It’s made even harder given that the markets are more volatile, so a crash or rally can happen in just a couple of months.
About -0,618/ -0,76 from march09 to sep13?
Famous last words by all the bulls…
Hi Antonio, I place us as at 1979 or 1946 or 1916, using solar cycles. I know you use a different sequence of peaks and different timings. Clearly that makes all the difference. I try to draw together the range of possibilities from the past 3 cycles, and the similarities are greater than the differences, which makes it more compelling. I concur with Pete that the past is only a guide and we can’t be too precise about what’s going to occur. Which is why I cross reference solar and secular history forecasting by time with technical indicators and measures and fundamentals to gauge whether we are straying from the former.
Sorry, about -30-35% is my scenario!!
In other words, Who says the truth, the sp or the industrials?
In other words, the movements are steepers nowdays than in 70ths
In other words, is the USA in the corner of a soft recession?
And, finally, how, will the stock markets develop this situation, have you seen Bovespa 1 year ago, China, Hong-Kong, India, etc?
QE3 on the top of the Industrials, the sp500, and Russell? Intriguing
What about the Transport?
John, excellent work as always.
Thanks Gary
John, thank you for a great deal of very interesting analysis. I have been following your reports for some time now (struggling to understand the technical stuff) but find your arguments very compelling. I feel that I have gained much insight into the workings of the various markets and always look forward to reading your latest reports. Enjoy your extended holiday with family over the next few months – kind regards Fiona
Thank you Fiona
Many, many thanks, for this excellent work.
Thanks Jose
Good work John
Just a couple of points. Your analysis is spot on when looking at periods of several decades. But would your bullish equity call square with a once in a generation type event: i.e. debt deflation.
Do you beleive in the K Wave cycle and how does the 30’s Dow crash figure into your thinking? Thanks.
Thanks abc. My predictions are generally inline with Kondratieff, in that we should have had a K-winter from 2000 to now where gold and bonds have been leaders, moving to a K-spring ahead where equities and real estate are leaders, with each season lasting 10-15 years, i.e..assuming such a transition is occurring around now, then the actuals are in line with the K-theory.
I see the 1930s crash differently to others in that it was an mega excess of buying/greed and a mega excess of selling/fear cancelling each other out on the way to a secular peak in 1936/7. Most consider the 1929 peak a secular peak, but I believe that’s wrong and hopefully this chart helps clarify that:

To your point about a major event such as a debt deflation, I can just repeat that whilst I see certain trends as unsustainable dead-ends, and the debt parabolic is one, I don’t see evidence that the crunch point is yet. Debt to GDP ratios shouldn’t max out until the 2030s for the major nations as a whole, and what we should see is that debt growth slows in the years ahead as real economic growth reemerges and inflation is permanently ratcheted higher. There have of course been multiple occurrences in the past of major events, if not specifically debt, i.e. crashes and panics and major drops in the markets, but they have largely occurred around solar minimums, as per this chart:

Great, exceptionally presented analysis, as always. An absolutely compelling long term view that no serious analyst should take lightly.
That having been said, the only tongue-in-cheek interrogation mark that comes to my mind goes to the maybe “this time is different” theme as I contemplate the possibility that this may be the first time a secular nominal bottom (2008-2009) was signaled by a sitting U.S. President recommending the purchase of stocks!
http://abcnews.go.com/blogs/politics/2009/03/bullish-obama-s/
Thanks High Rev
Going back to the Chinese demographic story, the website Dshort focuses on the Chinese situation. I want to rectify the bit of information I gave about the ages of peak spending. Peak spending actually apparently peaks between 45-54yrs of age, and so some are saying growth may continue for 5-10yrs, based on personal consumption.
Thanks for the reply. John.
Maybe with this solar (animal magnetism) peak being the weakest in over 100 years…

http://solarscience.msfc.nasa.gov/predict.shtml
…perhaps the blow off top for commodities was April 2011. It does seem to fit the 5-wave pattern depicted below from nowandfutures…
Thanks Mike. I haven’t found a compelling historic relation between strength of the solar cycle and the strength of the secular conclusion, but it’s something that I’ve considered. You are not alone in your suggestion that commodities already peaked – Barry Bannister and Kent on this site – and that’s a very nice supportive chart. I’ll include it in the next post.