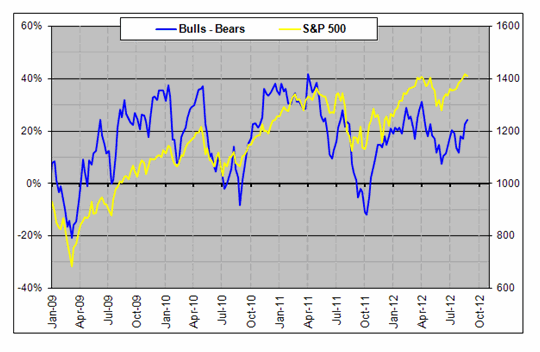
1. AAII bullish sentiment this week has fallen back to 34.7. It can be seen that bullish sentiment in this recent rally did not hit the kind of extreme levels of 50+ that previous signified a top.
2. Investors Intelligence sentiment showed a marginal increase in bulls this week but, again, sentiment has not reached bullish extreme levels that previously signalled a top, as evidenced in the chart below.
3. Bullish percent over call/put ratio similarly has not reached the kind of extreme of important market tops, which would be up at 110+.
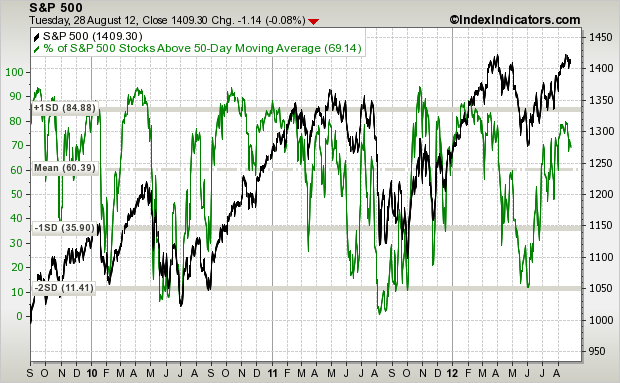
4. SP500 stocks above the 50MA has pulled back a little, but also did not reach into the upper extreme band yet.
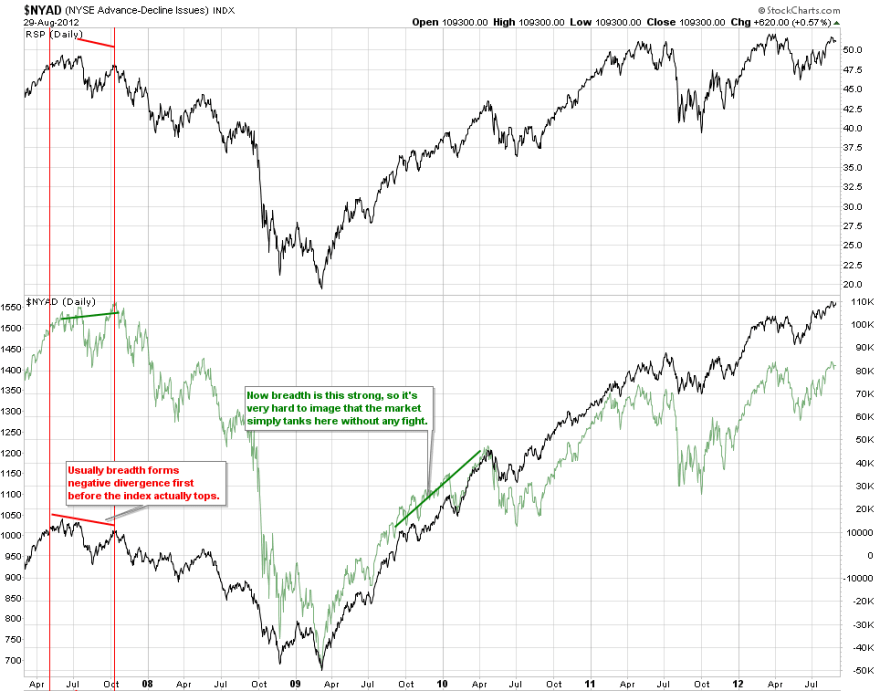
5. NYSE advance-declines are at new highs for this cyclical bull, showing that breadth is strong. As marked in red, the previous cyclical bull top of 2007 showed a negative divergence in this indicator which is currently absent.
Source: Cobra / Stockcharts
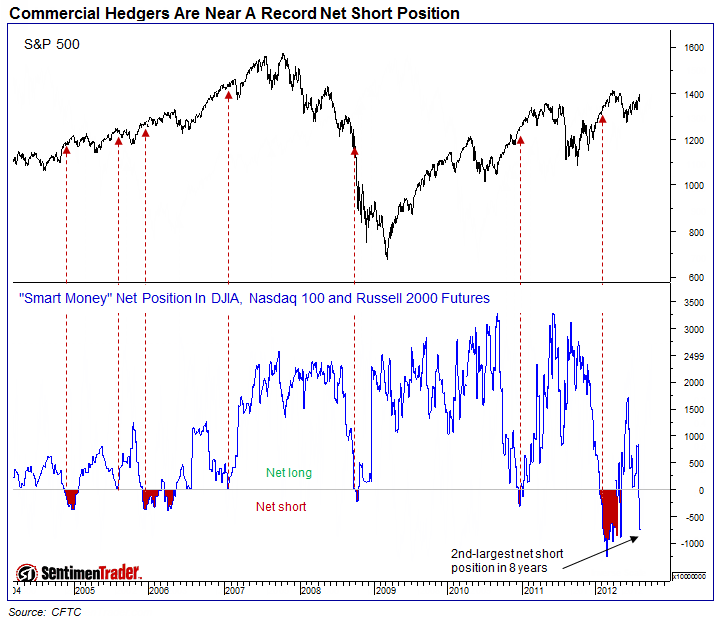
6. Commercial hedger net short position is the biggest current threat to the bullish positon for US stocks.
7. But this can be contrasted with penny stock speculation which is suggestive of the opposite – a low in the markets should be here.
8. Drawing the broader range of Sentimentrader indicators together it can be seen that there are more indicators at bearish extremes than at bullish extremes, but the percentage at bearish extremes is not calling for a top here. Previously bearish and bullish extremes hit 30% before marking an important reversal.
In summary, technical indicators point to markets more bullish than bearish and more overbought than oversold, but in both sentiment and price not at levels that would signify a top. Plus breadth is supportive. Concerns a few weeks ago over defensives leading stock indices upwards and a lack of small cap participation have been rectified in the last couple of weeks where rotation has made for a catch up in those underperformers.
There is no doubt a level of expectation regarding Jackson Hole and a clearer message regarding QE, but what the technical picture reveals is that even in the event of disappointment, stocks could still go on to breakout upwards here before signalling a top, as it is normal for these indicators to hit extremes before a reversal, and we are not there yet.


As a posted in a previous article, the $SKEW to $VIX ratio has hit the 9 level only three times in two years. The first two times (2011, early 2012) the market (SPX) sold off between 8 – 15 days after this occurred, the first time for 250-ish point, and the second time for 150-ish points.
On 8/17, the ratio tapped 9 again and since then, the pattern it made the previous two times in occurring again (with the ratio dropping while the S&P 500 muddles around before falling).
Volume has died ever since the Knight Capital Group debacle. These idiots on TV say its because of the Summer doldrums… really? Last two summers were nothing like this. I think the low volumes are here to stay for quiet some time, even on the downsides minus any algo’s beating the tape unmercifully pending disasterous news out of the September 12 “Euro Day of Reckoning”.
This casino is just about dried up. Why people feel the need to play here any longer is baffling. Take your money elsewhere where it can and will be more productive…
… maybe start with the horse track.
Hi Ryknow. Taking them separately, here is Skew: http://www.bloomberg.com/quote/SKEW:IND/chart
We don’t see the size of spike like in 2010, 2011 and early 2012 that made for a top.
Here is Vix: http://sixfigureinvesting.com/wp-content/uploads/2012/08/VIX-VXV.jpg
I accept that Vix is at the low level that could entail a reversal in stocks, but we can also see the lower band of 10-15 that Vix previously spent some time in. Tiho’s response to that was that that period of 2003-7 was a different backdrop to now. OK, but nevertheless Vix spent quite a long time in that band and could head lower, as volatility tends to decrease towards the end of a secular bear.
Why am I still long? It’s a game of probabilities. I see US stocks making a bull flag just beneath their cyclical bull highs. As per this post I don’t see the usual evidence of a major top. Bring in solar and secular history and the weight of probability mounts for a breakout and overthrow move. It’s one or the other: a major top here – a double top with March – or a breakout (imminently or eventually). My probability calcs support the breakout, and if we can breakout into clear air, then the gains should be significant: a melt up, an overthrow should occur.
What are you long/short currently?
John,
I know what they look like on an individual basis, however when looking at it as a ratio over the last two years, overlaying the SPX it tells its own story. No arguing what has happened in the past.
That said, I have very little interest anymore in what is taking place in these markets. Maybe its because its action is not there, or maybe because until we get the real value of equities, I have zero interest in buying this garbage. More or less, the drying up of the markets makes this place a zombie zone for algo’s to do their thing. Maybe someone will switch off the bid one day and I’ll get excited again.
I am long silver. In paper terms, in physical terms, for the long haul. History speaks for itself about paper currencies. Debt is unsustainable around the world. End of story there. I have no interest in the price of silver or gold, but rather its historical means of storing one’s wealth or value.
I am long SPY puts for the short haul. 132 – 133 is a level which I am eye-balling based on what other risk indicators are telling me (such as junk bonds, IG bonds, and US treasuries). Outside of this, I am looking for better returns elsewhere, outside of these (rigged) markets.
Well , here we have an irrational response.Better returns elsewhere. Ryknow is disillusioned.
RIGHT AT THE FULL MOON
No wonder the market is weakening.
I am truly an amature in this lunar trading.But there has to be some truth in it.!!!
bobc
And to say that I am earning them now…. sheesh.
Hi John
Could u give me some background on the AAII chart? Apologies if this is common knowledge.
Regards
Allyn
Here you go Allyn: http://www.aaii.com/journal/sentimentsurveyarticle
would it be possible to post a link to a long term chart ryknow of the SKEW:VIX ratio? the charting services I use will not allow me to do that ratio. TIA.
Don’t know of a link. I use Prophet charts which allow for ratios and overlays. Sorry.
I’ve taken a small DOW long position this morning. I see a possible change in trend coming with a new month upon us, US elections getting into hype mode, 300+ points shaved of the DOW into the full moon, and with a pile of investor cash sitting on the sidelines. As we are, as I believe, in ranging to generally up-trending markets, price is currently sitting on the lower Bollinger Band on a number of instruments if you check the daily charts. Given my market analysis, then a trade from this lower band offers decent risk:reward. The sell-off yesterday has added a bit more conviction to my trade too.
Have you any new opinions about markets going forward John?
Link to 2 articles by Money Moves Markets, pointing to an inflationary period into mid 2013, with UK CPI inflation turning up. Non-financial money growth, acting as a leading indicator means gdp growth could be back by next summer. However, rising inflation in 2013 may curtail this money growth and lead to slower gdp by late 2013/early 2014
http://moneymovesmarkets.com/journal/2012/8/24/rising-risk-of-more-king-letter-writing.html
http://moneymovesmarkets.com/journal/2012/8/30/uk-money-acceleration-argues-against-mpc-easing.html
Hi Jonathan,
I’ve noticed your post stated that there is apparently a “pile of investor cash sitting on the sidelines”. I believe these are market phrases usually seen at the top of bull markets. I personally have noticed the phrase “cash on sidelines” and “plenty of liquidity in the system thanks to QE & LTRO” commonly used on CNBC all the time in recent months. IT is as if everyone parrots everyone else for a cracker.
Marc Faber, an amazingly intelligent and deep thinker, wrote the following back in February 2007 (from his newsletter that I receive):
“The last point I should like to make about the widely used buzzword “excess liquidity” is the following. Did anyone hear about “excess liquidity” at the markets’ lows in October 2002, and last June after just a modest correction? But I have heard the words of “there is just too much money around”, “the market will never decline because foreigners will continue to buy”, “should the market decline the central bank will support it”, “plenty of liquidity will drive prices higher” in Japan in the late 1980s, in the Asian emerging markets just ahead of the crisis in 1997, and in the midst of the NASDAQ bubble. Words like “Excess liquidity” and “record corporate profits” are more closely associated with important market tops than with market lows!”
I have taken notice of 14 straight quarters of earnings growth. I have also taken noticed that corporate profits are now at record highs and analysts expect them to go 20% higher in 2014. Furthermore, I have not seen any proof of high levels of cash on sidelines. However, quite to the contrary, I have seen proof that investors are heavily exposed to risk assets such as equities, with cash at extreme low level.
My proof is here with mutual funds, retail investors and money market funds.
As the old saying goes… in god we trust, everyone else must bring data as proof. I would love to see evidence of high cash levels, so please put it forward, as it will gain my attention immediately.
Regards,
Tiho
When looking through the previous gold bull I made a calculation. Sounds very crude but I took the 1968-1980 gold bull numbers and multiplied the monthly figures by 7.9
Gold stands at about $1640 right now, at the start of September 2012, and when I multiplied the September 1978 gold price, I got $1643.2
By this calculation, the September 2011 high would be blasted up into for the last time, around March 2013, and then we could see $2000 by June 2013, soaring to about $3000-4000 by January 2014. Crude I know, but it was too interesting an idea to not bother checking.
Here is a chart to chew on (sorry for the long URL). Tells the story of market momentum vs. market price:
http://barchart.com/chart.php?sym=%24MMTH&style=technical&template=&p=WO&d=X&sd=&ed=&size=M&log=0&t=BAR&v=0&g=1&evnt=1&late=1&o1=%24spx&a1=on&o2=&o3=&sh=100&indicators=&addindicator=&submitted=1&fpage=&txtDate=#jump
Hi John
Can you give some background on the AA