
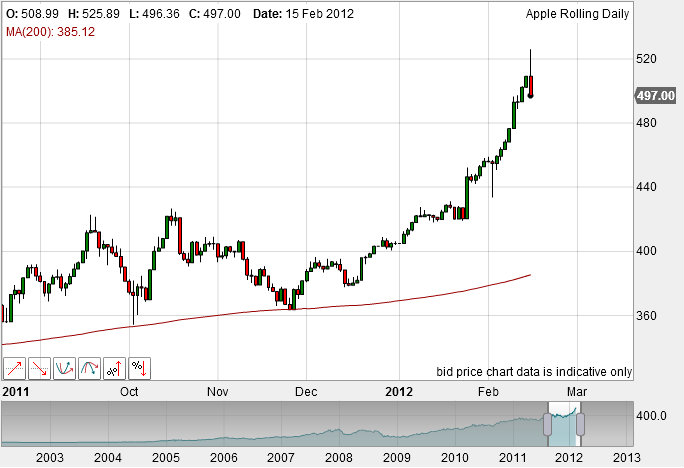
The leading stock in the leading stock index made a large inverted hammer candle following a recent parabolic rise that hit RSI 90, and this looks very much like a top (with US indices also making inverted hammers):

Furthermore, the unforecast geomagnetic storm that I referred to made for the following spike:

The pick up in geomagnetism that seasonality warns us of may be occuring. However, before we call a market top, I refer you to previous Nasdaq topping processes:

Messy affairs – reversals of reversals of reversals before declining in earnest. Some back and forth to make a top into the middle of next week (around 22 Feb) would fit very well with my models. In support of this, not everything sold off yesterday. The Hang Seng actually broke out, and has held the break out today.
In short, I think Apple has topped and the US indices have begun a topping process, but the wider market is less likely to dive from here and more likely to flirt with the highs in a topping process. I will keep my eyes on the geomagnetic disturbance, as it isn’t quite done yet, but also on other assets and indices to see if they start to line up behind Apple.

Thanks John it tokk me a couple days to figure out what your doing with this website. Now that I see your daily posts on the front page it looks easy.
ill dive into your other sites more later.
thanks
In his 2012 prediction, Feng Shui Master Eagle Wong calls for the Market to fall starting on March 5th. The correction will accelerate from April 4th through the 20th. He sees improvement starting on May 14th and the Market bottoms on May 20th…
June 4th….the World will be hit by big communication problem caused by malfunctioning geo. satellites.
July 1st…market starts to fall significantly again and will not bottom until the end of the year. The re-election of Obama will cause chaos and pressures the Market.
http://eaglewong.com/
Hi Edwin, is this on his website? cant find it. thanks for the info!
Hi Edwin. Can´t find the predicition.
The economic news over the past couple months has been almost universally good, particularly on the employment front. My theory is we print a bad unemployment claims number (next Thursday would tie into John’s suggestion 2/22 is a topping day) and the market sells down on the news, beginning a formal correction. That scenario would also give us time to churn around here for a few days as John suggests often occurs in a topping process.
Edwin, that´s right, a bottom is in the path, march 5th, before +- and target for Industrials for the end 2012, 1q2013 8.500-9.000.
John, please, your bearsh alternative scenario.
Reasons for potential bearishness earlier in Jan were economic surprises potentially tipping over, earnings beats falling short, ECRI leading indicators still not showing any recovery, Portguese CDSs rapidly climbing, and the market reaching overbought/overbullish. Here in mid-Feb, if we top we are topping on overbought/overbullish alone, so it’s hard to have a bearish alternative at this point. However, as economic surprises is a mean-reverter, that should fall into place soon enough (like Gary suggests). But the big story is the pick up in growth and positive feedback looping, which should provide support. Debt can always flare again of course and threaten.
John, I just wanted to say thank you for this web site. I’ve been a reader for a long time, totally puts a new spin on things.
I do not know if you are familiar with S. Puetz’s work but this is where my interest in cycle work started. He is inclined to think that we top out before solar peak this time around. He has been very bearish since summer, so timing is off obviously, but as far as i know he still has not changed his bear view on stocks and commodities. Good to have several opinions using similar approach though, it sounds like though given enough evidence you’d also consider a bear market.
thank you!
Hi! Yes, I’ve used SP’s ‘crash windows’ for a while, though as are hit and miss as a predictive tool that’s problematic. And I am aware of his recent and current bearishness – but we are in an upswing in the business cycle and it’s going to take a little time to play out.
The sentiment is bullish actually, Inv. Intelligence, 29 points, the most optimistic date since mid may11 -12 october11-, past week, AAII, look the old II, VIX waite for double floor,OEXA, NYSI, on the top, Blai Koncorde in weekly chart in DOW, in DAX, BDI, Us dollar opinion, look Bovespa10, look DOW 75-78, look DOW 1916-18, new low before 5 march12, minor cycle.
I don´t know if the Industrial can go to the 13.200 level, me be 13.150, perhaps 13.500, that´s too much, but i bet, my studies of the present cycle presents a bearish 2012, specially the second half.
If the geomagnetism chart goes in the way we are seeing these days, turbulent days are next.
-12 oct11, the worst lecture, -8 ago10> 2nd worst lecture. 2 decreasing minimum lectures in a cycle to go up and finish. Actually 29 until past friday. 1 more over 30 is enough, or more, but no more time for minimum before 5 march12.
Hi John
I have modelled up and down pressure using various cycles and it has been very accurate. The end of the upward pressure is the 8th march.
Last year the prime moves it projected were up pressure until 28th Apr, down pressure until 23rd Nov and then strong up pressure through to 8/9th march 2012.
There are projected moves within those prime moves.
Sorry for the busy chart but you can see the up/down pressures denoted by the red/blue horizontal line.
Good Luck.
Interesting, thanks – what cycles have you combined?
Hi,
Pres, rolling statistical, decenial, economic and whether it sits within a secular bull or bear. I’m trying to look at it in conjunction with your stuff.
Good work
what I found most interesting were the moves within the prime moves.
If for instance you had downward pressure from one date to another if you took the high of the first date even if at first it moved against the pressure it would be below that point by the second date. On the next graph you can see where i have put a horizontal red line across from the start of down dates and blue from up pressure dates.(on graph itself) If it’s not clear enough I’ll try and clear it uphttp://ec.md.it-finance.com/MDV8/tmp/img_b757b6ceb793b8e42a275f81fd91a817f49ea9ebe81f3407d34301bdcf14dfd6.gif
It’s clear thanks, and indeed interesting. Have you extended your model beyond March 2012, and are you hosting it anywhere publicly on the web?
Thanks, yes and no.
Care to share how it progresses after March? Just the general themes.
preston123, very interesting work!, thanks for sharing! so let me ask, are you seeing any sustainable downward pressure from early march into april?
also from looking at the red/green arrows (as i understand sub moves in a larger move?), is this model suggesting intermediate top 3rd week of feb followed by sell off and final push up into early march?
Thank you!
I’ll post something in the next few days. It will give something for everyone to laugh at in a few months when it’s totally wrong.
If I micro analysis things ( which can be dangerous) as you are ultimately trying to model a path. Reality,is going to deviate, to a degree, from the modelled path so to try to model in advance minor moves is probably for the brave and/or stupid.
That said, here goes – The pressure is up to the 8th March but there is a stall period from 10th Feb to about 23rd feb then runs up to 8th.
We’ll see!?
I can relate to that with my own research: when the market closely follows the model it’s satisfying and validating, but when the market runs away from the model it can provide the best opportunities (although it might initially seem to be invalidating the model) – I can show examples of these short, medium and long term. So a bit of trading the model, but a bit of waiting for a significant divergence – just as we would with charting and technical indicators.
preston i understand, bigger picture is more important and it sounds like you had one hell of a guide for last 12 months. 23 nov low – pretty impressive, nailed down the beginning of this massive rally.
There is a cycle hitting March 5-9th, which could represent some sort of top, but at the same time we have positive astro’s Jupiter Pluto trine March 13-15, so the market should at least rally during this time period from 13-15 whether from a lower low, I am not sure. I love the chart preston123, and John, you have a great website!! I am thoroughly impressed by the information posted here…
There is a rare convergence of daily, weekly, and monthly DeMark (TD) 9-13-9, 9-13, and Sell Setups, Combo, and Countdowns having qualified and perfected, occurring at critical monthly DeMark resistance and Elliott Wave (EW) corrective terminal projections occurring at an implied 9-month cycle high for Feb. The most powerful bullish or bearish DeMark signals occur when coincident patterns qualify and perfect for multiple time periods. This convergence is one of those rare instances and similar to the tops in 2000 and 2007.
The implied TD supports for the daily, weekly, and monthly TD Sell Countdowns for the SPX are at 1258, 1209, 1134, 1049, and 866.
Moreover, a Coppock Curve Killer Wave for many of the major US indices is occurring coincident with the secular bear market self-similarity as occurred in the 1830s-40s, 1890s, late 1930s, late 1973, and Japan in the early 2000s.
The DAX, CAC, and FTSE are following a similar DeMark pattern convergence, whereas the DAX is following closly the Coppock Curve and annual change trajectories for the bear markets in 2000-03 and 2008-09. Were the self-similar DAX pattern to continue to hold, the DAX will commence a crash wave in Mar. back to or near the 2009 low by as soon as late spring to summer-fall.
A crash by the world’s equity indices into spring to summer-fall also fits with ECRI’s research that indicates the lag of 1-3 quarters for mass-consensus recognition of the onset of recessions and bear markets. The stock market did not commence the crash phase of the bear market in ’01 and ’08 until 2 quarters after the US economy had tipped into recession.
Moreover, recessions have historically occurred when the YoY real rate of GDP drops below 2%, jobless claims and unemployment were falling, employment was often reported as accelerating, and the annualized quarterly rate of GDP was initially reported as positive. All of these conditions are occurring with the stock market again failing to be a leading indicator and the aforementioned converging TD and EW topping indications and sell signals.
The major caveat is whether it is in fact the case as increasing evidences suggests that the central banks by way of the NY Fed are facilitating levering up US Treasuries and MBS in the shadow banking system, offshore pass-through entities, and select hedge funds, PTFs, and HFT to “manage” futures overnight and at the open and close of trading. If so, technicals, fundamentals, flows, and valuations are irrelevant and central liquidity and non-transparent “managing” of markets is all that matters (until it doesn’t).
Preston, I am really interested in accessing your model – I cannot access your link.
Maybe John, you could help me – basically using Preston’s method, give me his map of the market,
Thanks to you both,
Fiona