
My targets are derived from what occurred under similar circumstances in history. Therefore they are an average and actuals can stray some way from averages, so caution is warranted. Nonetheless, there are compelling reasons for why they may represent the best ‘guide’ going forward.
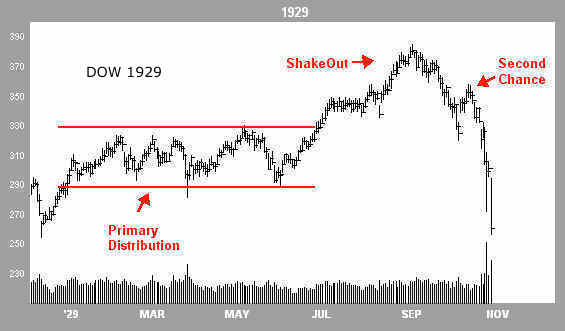
The equities mania into 2014/5 rivals the biggest manias of all time in terms of valuation, leverage, allocations and sentiment. Not only that but those biggest manias of all time share a similar topping pattern that may be playing out again.

Source: Financial-Spread-Betting
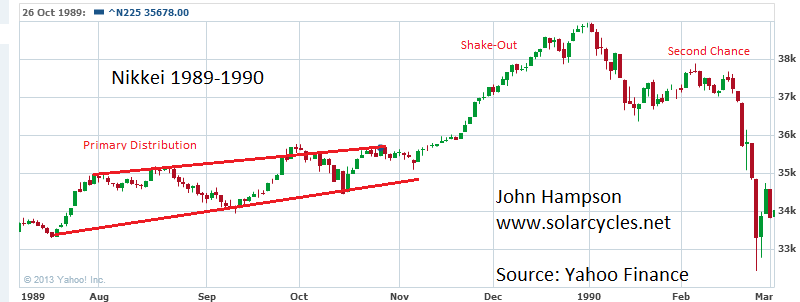
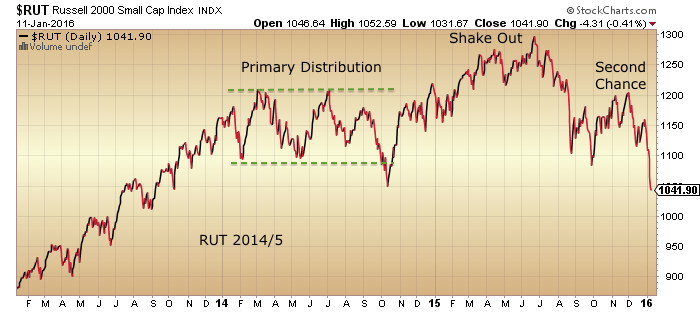

Think of similar waves of crowd psychology playing out each time. Post ‘second chance’, declines were swift and deep:
Dow 1929: 3 weeks 44% declines
Dow 1937: 8 weeks 38% declines
Dow 1968: 8 weeks 18% declines
Dow 1987: 2 weeks 34% declines
Nikkei 1989: 6 weeks 27% declines
Nasdaq 2000: 3 weeks 35% declines
SP500 2011: 2 weeks 18% declines
They average out at 30% declines over 4.5 weeks.
Continuing with history as our guide, we ought then to expect a subsequent slower partial retrace of those falls lasting around 4 months. So hard falls averaging 30% over several weeks followed by a 50%+ retrace of those falls averaging several months, before we tip conclusively into a fully fledged bear market, like this:

There is a seasonality to stock market peaks and troughs in a year, due to the seasonality of geomagnetism.

Based on this, we might look to around March/April 2016 as a bottom for the post second chance waterfall decline – if that is where we are in crowd psychology – followed by a slower retrace wave into mid-year. Remember, this is just a guide based on history and seasonality.
Biotech has been the mania within the mania, or poster boy. History suggests the full mania should be retraced.

Now the longer term. Cross referencing valuations with solar cycles and demographics we get this prediction:

Underlying source: DShort
Whilst gold should do this:

Making the 2011-2015 gold bear a cyclical bear within a secular gold bull 2000-2025 (or thereabouts).
The Dow-Gold ratio fits in like this:

And the Dow, something along these lines:

The waves and price points should not be taken too literally. The key point is that by demographics the developed world is set to follow Japan’s 1990s/2000s model: a long drawn out secular bear market. By solar cycles we should see a speculative mania peak in gold at the next solar maximum (circa 2025) together with a major stocks bottom.
However, this is all assuming the game remains ‘fair’ and central banks do not drastically distort market mechanisms, because it is a sure thing that they will respond with even more unorthodox and desperate tactics should an approximation of these forecasts play out.
Prior to the next solar max comes the next solar minimum, which historically has been the scene of bottoms, panics or crises. So circa 2020 we get a major low in equities before the deeper one of around 2025. In short, these may represent the ebbing and flowing of cyclical bears and bulls within an overall long term secular bear.

Underlying Source: Sergey Tarasov

By demographics, the future looks like this:


This suggests the global economy and stocks/housing markets will continue to struggle beyond 2025 and all the way out to mid-century. On such a long timescale, developments could feasibly make such predictions redundant.
Hope for a more positive outcome could be seeded in (1) major paradigm shifts from technological evolution (2) a shift to pro-active immigration policies in the major nations to alter demographics or (3) countries with positive demographics such as India and Brazil become much more dominant in the global economy to offset the others.
However, the kind of deflationary depression or long period of negligible growth predicted by demographics that may first come to pass historically gave rise to unrest and war. Additionally the world is forecast to be moving into another grand solar minimum, which also historically resulted in low/negative growth and war. Furthermore, the end game for debt is monetisation, which is where we now are. Recession, deflation and runaway debt is a poisonous mix.

Source: Michael Roscoe
In short, something much more devasting may be seeded in these themes and a long period of difficulty for the world could indeed be unfolding.
Photo source: National Geographic

Brilliant even-handed analysis as ever. Thanks John. If the game remains ‘fair’. Wonder what they’re going to be talking about in DAVOS next week.
Thanks Yogi
JH, can you please clarify the post-second chance for Nasdaq 2000?
“Nasdaq 2000: 3 weeks 35% declines”
My bad, I see that you did post a graph. Why was 4/2000 second chance when it is off the peak?
Hi John. I did post a chart previously showing a similar progression on the Nasdaq, but it doesn’t fit as well with the rest so I left it off this post.
The reason why I asked is because I suspect that China is now in the “long bear market” phase, given the drop of margin debt from 2.2T to 1.0T. That is not to say that the “long bear market” cannot be violent like in 2008, but the fuel will be corporate defaults rather than margin calls.
The biggest of your flash crashes (1929, 1990, 2000) were all in-line with demographic peaks, and since it is China’s demographic peak this time around, I suspect that China will set the pace.
Really insightful post, John. Thanks again. I agree with your logic, however given the rapid advance in tech of all kinds most of which have not yet been implemented (self driving this, ultra low energy that, etc) some of which involve novel materials that may replace current uses, could the next 10 years be less of a market down move and more of a sideways market in real terms all the while cost of energy and other input costs (labor, raw materials) staying tame? As far as AU being the lifeboat you may be right, however, tulips were a life boat once, as were goats in some places and times. One new development in mining technology (which is still very pick and shovel) could do to the AU price what modern ag has done to the cost of food.
Thanks Valley, and your ideas certainly possible.
Hi Valley,
What do you about the market tommorow and next week?
I think we will go down one more time and the turn will be next week mo/tuesday after that we will see a good rally..
Good luck..
oeps think again… haha
Very close to what I am thinking. Maybe bottom middle of next week. However, I will be considering staying long in case we retrace above 2000. So, PALS is negative Fri, Mon, Tues, Wed but price is way low. So for me it is a coin toss. Seasonally 10th, and 11th trading day of month is when 401K plans are buying mid month, so maybe sell off will be after Monday the 11th.
Thanks Valley,
Mahendra is bullish after the 20th:
We do strongly recommend taking aggressive positions during the last 63 hours of this cycle, or before the 20th of January, because on the 20th of January Mercury will rise in the east which is a positive astro move for the market.
Valley, check out the book, 4th Turning by Stauss and Howe. We are going to have a revolution over the next 10-15 years, hopefully peaceful. Even peaceful, it will be tough.
Just FYI, I am out of my SPX longs now – took the chance to close both in profit at 1910, so possibly not worth the risk at this point. We may go higher though, will have to wait and see….although I suspect we will go down take a look at 1850ish soon.
imho
J
Jeger, please may I ask, why are you expecting the market to decline to 1850 after such a strong move upwards today? Thx in advance.
Hi P
I should have defined “soon” I guess – I would expect within the next month:)
J
John H, wonderful wonderful analysis. This was the kind of thing I was hoping, nay EXPECTING, from your post. I need more time to go through it all but the different perspectives and their corresponding targets will help me to ‘follow’ the path of this bear.
Bravo!!
Thanks Purvez
BTW I don’t know if you did anything regarding the slow upload on the mobile platform, but I can confirm that things have improved significantly. I’ll keep monitoring for a while further and let you know if there is any residual problem. Thx for everything that you do for us.
Purvez – On previous comments section I wrote to ya.
There is always time to find opportunities to trade the market, but never enough opportunities to spend time with loved ones. You made the correct choice.
I’m still long from Monday and have been adding. Will stay long for awhile yet.
I didn’t do anything I don’t think, but good to hear
Geno thx for the thought. I’m glad to have had the opportunity to spend time with my mum.
At 90 she’s prone to repeating and for muddling things up but even that is quite delightful. Hope I’m half as good as her IF I ever get near that age.
Also very good to know your trade came off!! However with this schizophrenic market I would be inclined to grab my profits and run.
GL with your trades. I’ve just wound up as I have 2 days left here before returning home and have a round of H’byes to do still.
Sitting on hands, waiting to start layering on new short positions….
The day is off to a good start though… 😉
I like John’s analysis, but I believe this will prove to be the shake out phase when all is said and done. Perfect touch of the wave [4] triangle lower trend line, now the bounce for (D).

You’ve made a lot of good calls in the past, Alphahorn, so I shall keep it in mind.
It’s so very tempting to be short as hell right now, it’s taking all my willpower not to be long
oops that should have said, “it’s taking all my willpower, not to be short and to be long.”
Here are the daily swing bottoming charts I posted yesterday

Thanks geno
John, we think along very similar lines, using history as our guide. A pleasure to read your thoughts, many thanks.
For those fence-sitters (Alphahorn), this is a great read:
http://trader-moe.com/no-sitting-on-the-fence-here-youre-either-bullish-or-bearish/
There’s no reason a person can’t sit on the fence and play the daily swings. In fact, it’s prudent to do so. Why put all your eggs in one basket when there’s no need to?
Huh GM? I thought Alphahorn said he was bullish unless a particular level was taken out. Surely that’s just ‘good’ trading?
Fair point purvez, but it will be interesting to see who is right and who is wrong.
Oddly, I still am on the fence myself re new all time highs for US markets, it’s a possibility after a decline due to capital flows.
GM, I assume you are short the market? Otherwise, why call AH out? Please, do tell…
Appreciated GM
Welcome back John.
This is all very swish the new look site )
Thanks Phil!
I think we can get long Ferrari for 7-10% gain while risking only 3% with a 40.55 SL

John – Do you want us to keep comments geared toward indices or are individual stock postings okay with you?
Happy for the chat to be about whatever, within reason.
Gen
How do you come to that “buy zone” and the SL? Looks to me like it fell out of that “triangle”, didn’t backtest then did a bit of a bearflag thing and is now in limbo? Or are you guesstimating the end of the bear flag formation (if that is what it was) by the length of the “pole”? Or something else??:D
Thanks
J
Hey Jeger – sorry for the delay. The buz zone is calculated using Fib Support areas and time. I set the SL using the ATR.
Richard, regards Delta, may I ask what solution you are working off of?
First layer of shorts re-loaded toward the end of the day here…
Feel like I’ve f-up about all that I could have so far in 2016, and yet, it’s already been a really nice return so far this month…
Just reducing some exposure here, as well as looking for higher prices to build a larger short position… Just working my strategery to make a few bucks…..
Outstanding analysis, JH. I was one of those who thought (back in early October) that the Dow would break marginal new highs before turning down. You were right and I was wrong (although the SPX did get to within about 1% of the old high – an unusually steep retracement). You referenced a caveat that the game remain “fair” – no central bank intervention. I’ve suggested that the very reason for a bear market this time around would be a loss of faith in the Fed, as it has been the primary driver of the last four or five years. There is a psychic component to the coming events that needs to be appreciated. When there is extreme fear, traditional measures of technical analysis (momentum and sentiment) begin to fail – that is the only way a decline of the magnitude and speed predicted can happen. The markets may react violently in the short run to any Fed intervention, but in the end, I suspect the Fed will end up being the reason for the crash, not the deus ex machina savior. Any thoughts, JH?
Good comment…
That’s a reason I’m already starting my scale-up selling…
Ordinarily, I’d think I’m too early, starting at too low of a level…
My indicators are telling me we’re going higher shorter-term, but the truth is I’m thinking it’s just “safer” to err to the side of being short this market, and using a great deal of caution in having faith in any buy signal…
Just not convinced that signals will work out as they “should” in more normal times….
Another way of saying no cajones for this guy right here, I suppose…. hahaha
Makes sense to me. The mantra for the mania has been central bank policy trumps all, when they are in fact fairly impotent.
‘The mantra for the mania has been central bank policy trumps all, when they are in fact fairly impotent.’
Well put. They are in fact impotent. Investors should repeat that 10 times a minute until they grasp it. Even old Bluestar is writing about the Fed being ‘out of bullets’, when it always just a myth (he thinks they had talk powers and policy powers, both BS IMO).
Just human herding instinct caused yet another bubble.
Not sure of time zone here (8:28 pm pst)
Test 20:34 pst
Just FYI that I went long SPX again, I already have short exposure elsewhere so if anything it is a kind of hedge, which may morph into something else….
J
New blog top notch, tick tick…
15th Jan already, options expiring. Russell 2000 confirmed the bear 4 days ago and every day since. The chart fail patterns we have seen bring a need for new chapters in analysis. Is this very bad or less bad? Who knows? Its just bad, that’s all I can surmise so far.
Unless the Fed has interfered with the mass of the Higgs boson of course.
Now this makes very good straight forward sense to me…
http://www.investing.com/analysis/equity-market-musings-380046
One thing they are missing here comparing the 1940’s is we now we have massive debt loads in all sectors. That all needs to somehow wash out which could be nasty.
With the erudite and highly informative observations made now and for several years by our host, along with the highly unusual chart fail patterns that have recently come to pass, it is surely not clever to expect good things to happen from here as things stand. The basic premise of the financial system has been first corrupted (ref Clinton) then used for the personal gain (for the few). Then the core was broken (ref Lehman). The repair efforts have created a false wealth effect (we are only now told this was intentionally so) but more-so has enabled even more personal gain (for the few) with a pious belief that it serves the greater good to do so. No attempt to return to the basic premise of the system (e.g. undo Clinton) has been made. Therein lies the folly of it all. Now it loses the confidence of the major participants, which has been eroded by time. But the unworthy few will most certainly retain their status at a constantly elevating level. (All they need to do is read this blog, go short big time and buy gold big time)
Science fiction morphs into ugly facts in your face. So what you gonna do? Sit on the loo?
This behaviour has been wrong from the outset. The bastardised system will not fix itself.
Whilst I agree with much of what Peter_ says above, in fact the problem is much bigger.
This bubble has been expanded since the world went off ‘gold’ at Genoa in 1922 (enabling the Roaring 20s bubble).
It has enabled the great socialist expansion/experiment for nearly 100 years. The masses love it, so much free stuff!
But like JH, I have grave fears about what lies ahead as it bursts.
So hard to see the developed world avoiding wars, civil unrest and revolutionary impulses.
Hard to see that those impulses will be mis-directed by marxists-in-waiting toward the wealthy and the productive, rather than toward government itself, or the system.
In summary, FUBAR sums it up succinctly, and gold alone won’t save you: it’s physical location and your own will be crucial. This period could easily last for 40-60 years, before sense is restored.
I’m currently liking Iceland and Morocco for their values and culture.
Thanks Peter!
The last time the S&P 500 broke support like this was Thursday, September 6th of 2001.
911 happened the next Tuesday
Did the S&P breakdown cause 9/11 or did someone know it was going to happen? What a coincidence, especially if you look at airline stocks around that time lol….
J
“…did someone know it was going to happen?”
you’re pretty funny J
Here is one argument that it was a myth: http://www.911myths.com/html/put_options.html
Small longs on dax and US indices. Fall is overdone but I’m quite sure the top is in. Expecting a rebound of 4-5% before the falls continue into mid year.
I have no opinion either way, but it would be a helluva coincidence no?:)
J
Looks like Nicolas will never return again. Not a short term call, but it seems ATH is out of the picture.
jegersmart’s guy looks a litte spastic
barry’s guy looks mean
krish’s looks kinda like a pirate
john li’s looks uncertain
my guy looks kinda smart with his monocle
I ~am~ mean! LOL
Aaah you all need to beware my ‘guy’. Looks downright angry and hungry. That’s me: a pussycat in a tigers uniform. These artificial intelligence avatars are too damn clever!!
I told the little dude, a couple of months ago, that he was about to go on another “vacation”…
I’m sure he didn’t believe me… Oh well…
Sad to say, I could have traded this better as well…
Trying not to dwell on this, but if on Jan 1, I’d have closed my laptop, not looked at one single chart, and not made ~any~ changes to my portfolio, I’d be up over $100k from where I am today….
Just played golf every day and ignored this crap…. *big sigh*
As much as the market is down and near support, the VIX is really not responding. We are half of where volatility was on 8/2015! This shows the downside potential medium term even if we get a bounce now.
Well, it could be worse – for a couple of months last year if I had left my computers off WITHOUT any open positions I would have been better off……c’est la vie……
J
Well, the stock market is collapsing, but fortunately for me, I’ve hedged it by buying gold stocks….
Oh wait….
‘Wait’ will work Barry, patience may be required. Obviously as a short-term hedge I commiserate, and gold miners historically tend to get shaken about at these times, before hitting clear waters and a strong tail wind. (Low oil priced a real boon for the sector).
Hi GM;
It was kindof a joke, but as we all know, jokes are only funny if there’s some truth to them…
from what i can tell
the number of new lows are lagging the number from August
that would signal a likely short term bottom if they don’t expand a lot by the close
The big question is how will it open on Monday morning? Will there be a rescue over the weekend? Would you leave short positions open?
Hi Pulp,
you actually get an extra day, monday is a holiday
and the ptb are notorious for using long weekends to support the markets
publicly and not so much
I took 65% profits on short positions now as we approach the 1860 and 1820 support zones (on SPX), along with 50% of the rest of the puts. I have a scout long on Oil (CRU) after today’s crash – long Potash, Soybeans and Corn, Gold but slightly underwater after I took profit on the main tranches 2 days ago, and I have calls from 2020 to 2140 on SPX mostly Feb and a few March……at the moment these would seem more or less worthless….lol.
I would look at some of the refiners though, they look pretty weak and breaking down and I would have shorted them today but wanting to stay out whilst the market works out where from here. Once Crude gets going, many refiners shares will probably feel it.
I am more or less done so good weekend all!
J
Yeah, I’m not worried…. I’m sure that 1998 analogy is gonna kick in anyyyyyyy moment now, and we’re gonna roar off to new highs…..
Where are those guys anyway…. 😉
Regardless, would think we’ll see higher prices than where we are right now, at some point going forward, but jeez…. My TZA hedges were a lifesaver today, but I’m long crude, and at this rate, the gas stations will be ~paying us~ to fill our tanks by Spring….
The Dax still hasnt’ hit the August low.
I added some scout positions on QQQ and GDX as well, now I really am done for the week. All the best to you.
J
Covered about half my shorts, and am now back to net long…
Emotions aside, looks like a rally “from here” looks easier than a continued move lower…
To me, anyway… Clearly, not strong conviction here, but still, taking a stand..
[video src="https://pbs.twimg.com/tweet_video/CYx4TkeU0AAbeS1.mp4" /]
Chances of a bounce are elevated, thats not to say we wont go lower over the coming weeks. I am certainly not going short close to strong support….and haven’t as per earlier posts:)
J
John H, I was surprised that you expect stocks to bottom in 2025 which is likely to be a solar maximum, as I’d assumed stocks tended to rally into the maximums.
Are you expecting the manic rally to be in gold for the 202-2025 period?
My view: stocks hit a secular in 2020, but then gold and stocks rise together for many years, driven by the Western collapse (gold) and Eastern/Silk Belt advances.
I also expect the EZ to scrape through, with most of its sovereign debt gone, via default, or settled post-GOMO using official gold reserves. Small governments should remain, and reasonably open markets (ordo-liberal approach). The risk everywhere is totalitarian outcomes and war/civil war.
Thanks.
I second this view, with the caveat that if Nikkei 1990/2000 is the analog, Shanghai might be hitting bottoms in 2025. Global stocks would surely have recovered from their lows by 2025. Hussman suggests 0% returns, which if true, can be made by -50% and then +100% over the next 10 years, which means we are off our lows even if we go nowhere.
The q ratio chart in the post above shows there have been 3 solar maxima where stocks made bottoms and commodities/gold made a peak. Then by demographics I see us in a Japan style long secular bear, which fits with gold enjoying a long secular bull. Doesn’t mean we won’t get cyclical stocks bulls within that. So thats how I calculate it.
Thanks John.
It’s surprising that we have 3 maximums where stocks crash, and 5 where stocks are high.
But…16 and 17 could be compared to 23 and 24 in terms of the bubble bursting for stocks.
So maybe 18 and 25 will be similar too? As a gold owner, I hope so!
If it helps anyone, here’s a post I did with some charts on long-term gold miner cycles, and we appear to have a lengthy cycle up dead ahead:
http://screwtapefiles.blogspot.co.uk/2015/04/martin-armstrongs-tense.html
Also, fascinatingly, I found this chart last year, the writer has re-posted it only this week, and it seems to extrapolate the bottom in bond yields/shares (based on a cycle/mirror) to around-about….wait for it…2025.
http://www.marketanthropology.com/2016/01/equity-market-musings.html
It’s nice when a few different factors and views coincide, certainly gives one confidence one is on the right track. G.
The bounce from any support is quite normal. But normal is not often seen nowadays – correction – make that for some decades already. Now I am not sure that anything has ever been normal. But nonetheless things are appearing to be even less normal nowadays.
A few factors are slightly unfavorable toward any significant bounce here, viz: volumes still increasing, momentums still slowing, TRINs peaked a week ago, last new moon inversion, upcoming full moon bearish, DOW closed below 16000, plus failed ending diagonals not yet at their “normal” baselines for “normal” (i.e. not failing to give new high) behaviour.
But maybe a dismount into a hand stand will win a gold medal.
And now Caldaro comes to the party with target of 1100 for SPX “in a year or so”. Thats like getting the reels mixed up in the cinema and giving the kids a horror instead of a cartoon.
From crazy bull to crazy bear – poof!
yes, Caldaro’s approach sometimes misses the major turns. That’s because he goes with the most probable count based on his studies of using objective criteria to determine wave structure. I haven’t taken his course, but my guess is that he uses things like RSI, MACD, Stochs, etc. to objectify waves (based on statistical analysis of how waves have behaved in the past) and then creates the count from there. The problem is the outliers, the exceptions. His charts usually just has one count, sometimes recent price movement is market tentative. This works for smaller degree counting, but for large degree he posts the most probable count. There’s always the chance that one of the lesser probabilities will rear its ugly head, and the problem there is that it may take a while to confirm that lesser probability which is what happened in this case. Therein lies the problem with OEW.
posted this left translated cycle blog from 2011 about 2 weeks ago with SPX around 2060. today 1/15/2016 marks 22 weeks from the 8/24/2015 low. we now have a lower low. Spiral calling for an esf move to 2012-2040 in the next 2-4 weeks. SPIRAL has NAILED many of the short terms cycles of late.
http://smartmoneytracker.blogspot.com/2011/06/left-translated-cycles-are-bad-news.html
Long WE, all global indices approaching crucial support that needs to hold or all hell could break loose..
What are the chances that the bean counters launch a covert operation on Monday headed by the number one “baked bean” himself Mario Draghi, that sees follow through to the US Tuesday?
Why does my avatar looked befuddled???………….lol kinda fits that post.
I was hoping you’d leave Mr Draghi alone Allan!!
Here’s a view (to which I subscribe) about why the Euro-concept will destroy socialism and big banks too:
http://www.theguardian.com/commentisfree/2012/jun/26/robert-mundell-evil-genius-euro
When the time comes, you will be pleasantly surprised at the actions of the SRB and the ECB.
Meanwhile, leave Mario alone! 🙂
http://www.reuters.com/article/us-ecb-draghi-idUSKBN0O809P20150523
PALS SPX next week:
Tides: Low on Monday, rising Tuesday to Friday
Moon phase: Full Moon on 24th, Saturday; bullish Wednesday to Friday
Declination: Equator crossing 15th to North, bullish Tuesday to Friday
Distance: Perigee 15th, bearish all week as lunar distance is now increasing
Seasonals: Bearish all week post opex January
Planets: post Mercury conjunction 14th, was sell off due to this? Quickly rebounding is typical after deep sell off on or within days of this conjunction.
Summary: Was long and wrong last week. What will next week bring? Don’t know but hope (not a strategy) that SPX sell off will retrace back to the 50 day MA before falling further.
Hi Valley,
I was long and wrong also last week, not surprising as we use similar inputs. I was expecting a turn around 11th Jan. No real damage as FTSE was only 100 points below the low of 11th but it was a hairy ride. I am looking for a bounce this week.
One question:- I take increasing lunar distance to be positive and decreasing as negative. Less lunar effect at apogee, more at perigee. I was wondering why you have it the other way around.
Thanks,
Kerry
Hi Kerry, my research shows that if you buy 4 calendar days after apogee, and sell at the open of perigee or trading day before if on weekend, you gather much of the gains over the last 18 years. Greater lunar distance is cause of low energy, low tides. Closer lunar distance, higher energy, high tides. This energetic effect seems to have effect on equity market in US.
Thanks Valley, understood
Hi Kerry your cycle matches with danielcode second deviation (your 2.2 and 4.4) the bottom of 09 bottom of 2011 bottom now it took 3 attempts and it broke threw S&P 500 please watch
2016 the first 5 days
http://www.thedanielcode.com/display.php?nav=news
You can start at the 16 minute mark.
Cheers
Thanks Ricksbiz
The Hang Seng looks positively SCARY!… It’s pretty much sliced through ALL remaining significant support and let’s not forget where the 87 crash began.
Are you saying the 87 crash started from Hang Seng?
John, it obviously wasn’t the cause but it is where the big downward momentum began so it set the tone heading into European trading and then the US.
Hey Allan, Martin Armstrong has an offer for you in a recent post:
‘I can read a book on how to do brain surgery. Would you like to be my first patient?’
Lol, poor guy, must be under some serious stress.
Bankster injustice strikes again – http://tinyurl.com/j3m2zqr
No mention of the perps or their personal gains from illegal behaviour, instead the taxpayer is the perp yet again. Drug lords and terrorists got nothing on this hellhole of a oligarchic system.
John,
Just like to say that I love your new website, it looks clean, clear and concise. Great work
Mat
Thanks Mat!
One for purvez, John and anyone interested in a wide view, a site I discovered last year, but lost touch with, worthy of a regular read IMO:
http://www.marketanthropology.com/
PS My avatar is pretty much spot on for me and my mood, although my head is not triangular.
And its OK to be crooked, to dupe people & make money from it big time – its the American way, and you can now be brazen about it. Who of any importance actually cares anyway……….. http://tinyurl.com/z6c6l8e
The ongoing death of civilisation, evident in many Western countries.
Japan joins the bear brigade… http://barestbodkins.blogspot.co.za/
You’ve been a busy boy!
Its been a terribly lonely journey so far, but there are signs of overwhelming company with scant space.
GM – A few quotes from a very old book. Morocco or Iceland may not be far enough away. “Also, there will be signs in the sun and moon and stars, and on the earth anguish of nations not knowing the way out because of the roaring of the sea and its agitation. People will become faint out of fear and expectation of the things coming upon the inhabited earth, for the powers of the heavens will be shaken.” “They will throw their silver into the streets, and their gold will become abhorrent to them. Neither their gold or their silver will be able to save them…..”
Teach a man to fish and he will take all your rods and then all your silver and then all your gold so that you may eat well. Then he will take your house and charge fish for rent and hire out to you your own rods. And the circle of life will continue.
siggy, I’m thinking some farmland might be useful.
Time to focus on getting the most out of every day, as ‘normal times’ are soon to be consigned to history for a very long while I fear.
Some times Cycles make really really deep troughs….It’s hard to predict the end of the world isn’t it….because it only happens once. 🙂
GM, I’m looking forward to how Martin A is going to talk his way out of his 23k DOW or higher calls?………….AND not to mention his calls for gold to crash under $1k, just like he told everyone to avoid buying Au back in 1999 until it had ceashed under $200………DOH!
He’s sucked in soooooo many over the years. I too was one many years ago but eventually I saw through it 😉
He’s quite clever (sneaky) as he always hedges his bets, and then veers off onto the time aspect rather than price.
I’m guessing you won’t volunteer for his brain surgery training programme?
Lol, I don’t think so. As for sneaky, that’s one word. Cunning is another. He’s made a career out of it, not to mention millions of followers
JH is all over him as far cutting edge market analysis goes. MA just has one very very BIG trumpet thatt he likes to blow incessantly……..ABOUT FRICKEN EVERYTHING!
Valley – I got long last Monday too, and added on Wednesday and Friday. Positions aren’t too far underwater, but definitely didn’t time it very well. Should’ve stuck to my prediction of a bottom coming January 19-22
The arrows on the chart are my buys/sells since November 2015
My account is about 15% long right now. I like to keep my trades at 7-10%, so I’m a little overweight by getting in too early.
Question: Based on what technique have you forecast a turn by Jan 19-22 ? Thanks for an explanation. Best, Jaze
Thanks, Geno. There may be a big sell off Tuesday morning, or Wednesday morning according to my calculations. I am staying in until Friday for sure.
Hi Valley,
Did you short last week wednesday and do you stay short till friday before full moon?
I sold my AEX calls today ..
Good luck.
No, I was long last week and plan to remain long into this Friday.
Very nice calculation Valley I bought calls today on the AEX I hope I m not an early bird in this drop?
What do tou think of next week a rebound?
Until now the market repeats itsellf likeJan 2008 so if this is a guide this year will be a big rollercoaster.
PALS is bullish until Friday’s open, somewhat bullish until Friday’s close, and mixed next week. I don’t know if some news will happen this weekend that causes a big rally. Seems like early February may be the low of this sell off.
time 2 bounce. bulls at lowest level in years. left hand 22 week trough to trough 8/24 – 1/15 achieved lower lows. looking for 2040 spx before bradley turn date 2/5/16. http://www.zerohedge.com/news/2016-01-18/bulls-decade-low-oversold-bounce-imminent-jpm-repeats-sell-any-rips
Not trying to say you’re wrong, in fact you could very well be right and a good bounce could be coming right up. But taking a look at that link you posted previously regarding cycles it seems the 22 weeks from trough-to-trough is just the median estimate.
Quoting directly from
http://smartmoneytracker.blogspot.ca/2011/06/left-translated-cycles-are-bad-news.html?m=1
“Now in order to understand how a cycle is translated you first have to determine the average duration of the cycle. In our case we are going to focus on the intermediate degree cycle in the stock market. That cycle averages 20 to 25 weeks trough to trough. The median being 22 weeks.”
So this means the trough could potentially still be coming up anywhere in the next few weeks, according to Savage.
It all depends on where you decide the last daily cycle low (DCL) was. Most believe it was at the mid-November low, in which case we’re right in the timing band for a DCL to have hit on Friday. Savage believes it was the mid-December low which, if he’s correct, would have stocks headed lower for another 2 weeks, maybe longer. There are valid arguments for which date you choose to mark as the last DCL, so… flip a coin?
Savage had to delete his old blog, so wide of the mark so often.
He’s the antidote to CB printing.
Rather than trying to predict the future, these guys and certainly anyone trading should look at the risk-reward ratio and go with the flow. If you have a fairly deep correction with oversold levels and positive divergences which stops near long term support – the chances are quite good that there is some sort of bounce. How high the bounce no one knows, but there are targets to shoot for where price has found support, resistance and so on above.
These guys who try to predict the future through blogs and I assume through subscription services in some cases(?) are really just preying on people’s hopes – that someone will be found that can “see the future”. This will be a fruitless search as has been shown time and time again. Basically, everyone and every system is wrong quite often. To expect anything else is imbecilic imho. And just to be clear, I am not referring to anyone in particular here – I am talking in a general sense.
J
My problem is coding truisms like this. If it is indeed true, a computer would be able to handle this “going with the flow”. And yet for every example I see where stocks bounce at any oversold indicator, there is a counter example such as 1987 or 1929. The distribution might not be a coinflip — one can be right 4 times but be very wrong on the 5th time.
Every trade is a prediction of the future. When I see quotes that say not to predict, but to react, they usually really mean to follow some sort of a trend.
‘Every trade is a prediction of the future’ – I agree
John Li, whilst you may be right 4 times and VERY wrong the 5th time, provided you have ‘executed’ your trades with due diligence i.e. sensible stops to get out at and targets to take money off the table then surely your win ratio to lose ratio must improve. No?
In fact anyone who trades successfully MUST do that.
Charting is such sweet sorrow, but now it departs so that it may return maybe tomorrow.
Well, this is why I never speak with “certainty”. All I said was that that under the conditions specified above the “chances” of a bounce are elevated in my experience. I am wrong (at least in terms of getting stopped out) about 62.x% of the time over the last 12 months, but I never get it “very” wrong because I use stops – which I would recommend every trader does. If you look at historical charts back to 1929 or even 87 when I was a young teenager, I cananot say whether the patterns and/or behaviour was the same as they are since I have been trading (later 90’s). For example, I went long QQQ at 100.22 with a stop of 97.9. This is not because I am bullish, it is just that when price halts with oversold and divergent conditions my experience tells me it is not a time to go short unless support breaks on volume, this does not mean that a bounce is certain or of significant size, but because support was not violated there are market participants that are more likely to be buyers at a time like this. Even if for a short time…..Another time I could decide not to take the trade at all…..
Why would you want to try to make a computer do this? You have something better to do??:)
J
Not preaching any style, but computerized trading is what I do full time.
I mentioned the other day how this rebound(if you can call it that), looked totally differently on the intraday charts compared to previous rebounds of the last 7 years.
It keeps resonating within me something that John said over 12 months ago and that is that once the second chamce had come snd gone and the waterfall declines had begun, bounces would be short and shallow and fail to find any traction.
And that is exacly how this appears to me at present, like I said particularly in the intraday charts.
The BTFD appears to be well and truly dead and those playing the rebound trade could be in for much more than they bargained at some point.
It does indeed have that character at the moment Allan. Just one thing: in 2008’s waterfall declines there was a neg feedback loop with economic and corporate domino developments. Might need something similar here to seal the waterfall deal (problems coming to light).
Thanks John. Indeed something to seal the deal could come anytime.
That aside. This looks very very tempting. How cheap can this get??
http://stockcharts.com/h-sc/ui?s=%24PALL&p=W&yr=5&mn=0&dy=0&id=p42300613594
Indeed, this is a distinct possibility so please ensure that you are using stops at all times in any case.
J
Of course, the market is not going to make it easy in terms of stopping at support and bouncing so that everyone who wants to can get in and ride the wave – so again in this scenario there are only really 3 options available to us:
1. Go long
2. Go short
3. Stay out
In my experience, “waterfall declines” occur when there is catastrophic stress in the market, and/or fear due to that or other serious developments. It doesn’t happen out of thin air where everyone just decides one day to sell. So, from my point of view and experience, price action will dictate and either hold or break through support. If the 1850 and 1820 breaks on good volume I will be stopped out before that and I will normally wait to see whether the break is a fake – and then go from there. As a trader, I am not going to sit around and wait for 4-10 years hoping for waterfall declines to make some money:) – I try to make money whichever way the market seems to be going on a “swing basis”. That is to say I rarely have positions that are open for less than a few days, and quite often for weeks or months.
There are reasons why markets never go in a straight line, whether you decide to try to profit from this or not is up to the individual….
imho
J
A wise approach
I was out most of the day, but what a weak bounce, and the subsequent falls must be of concern to bulls.
I think we’re at that point now where everyone will sell due to a variety of fears. Down to 1700 ES within days maybe?
My query to the board today please: Any E-wavers (Peter_) like to show a chart of HUI long-term for me/us please? It’s broken a long-term support level today, even as gold holds up. I am sniffing capitulation again, possibly as the broad markets decline imminently. Time to deploy capital…..? How many capitulation can there be in a bear market?
Also, Allan, I have read and seen that at the gold bottom back in 99-2000, it was miners that lead gold upward. With miners falling, do you reckon they will drag gold back down, or is it a false break-down maybe? I feel the next month or two will see the bottom in both gold and its miners anyway, just pondering the moves that may lie ahead. One certainly needs patience in these gold miners, and in gold.
Gold miner index got bad apples dragging and distorting… http://barestbodkins.blogspot.co.za/
These are the better performing gold miners, with Harmony way out in front and wildly volatile.
1 Harmony
2 Sibanye
3 Goldfields
4 Anglogold
5 Agnico
GM as I have mentioned before my best leading indicator for gold, better even than the XAU or HUI is the ASX gold sector which is currentlly in a massive basing pattern with many individual miners already having broken upward months ago.
If it had only been a few miners that had moved I wouldn’t be so convinced that this was a base pattern and not a continuation pattern, however there are many many miners that have moved significantly off their lows and are in the beginning of bull moves.
The problem with the ASX gold ndx is that it is heavily weighted with a few majors that are currently holding it down as they have not quite shifted up gear yet, but it will break out of its base pattern.very soon once these begin to move as well.
Thanks Peter_ and Allan.
I will take my junior miner positions soon….I am expecting gold & its miners to have their final lows within 2 months, as equities have a final (weak) rally. I could be wrong and miss the bottom. We will see.
Mad as this sounds, we are heading towards 15,500ish on the DJIA before this thing reverses. However when it does reverse it will retrace a HUGE amount and MAY even challenge new ATH.
I’m back in Blightey but too tired to post a chart. Hope to do that sometime in the next day or so.
The chart requires 15370 or less to confirm the bear. SPX has now signed up to join with Europe on this project. We look for Nasdaq and Dow as essential partners to ensure success, but how can they refuse such an invitation? Once everyone has joined up there will be a preparation phase and possibly a delay waiting for promises, but the interest will increase and then we will be on our journey into the bowels of the dragon that must be slayed.
Peter_ according to the IG charting service the intraday low on the 24th August’15 was 15253. However since the drop to ‘whatever’ on 24th August was a 3 waver then all I am expecting is a Flat or Expanded Flat before it reverses. As it currently stands both the rise to the early Nov high and the drop from there are also 3 wavers. So at least on the DJIA the triangle interpretation that Alphahorn was talking about is still alive. However I believe the current down wave is ‘b’ of ‘B’ with another UP (‘c’ of ‘B’) to come AND THEN…. a final 5 waves down ‘C’ which will convince everybody that the Bear has arrived.
I know this is hard to follow without a picture so I’m hoping to have one soon.
CFD chart I presume. EW best applied to underlying, being the basis. Futures can also generate different highs and lows that can give conflicting counts at critical junctures. Best EW results (and all indicators) arise with instruments that are always enjoying high numbers of competing traders.
So far the failed ending diagonals (many indexes, many of which are quite imperfect) have played out. But with dramatic failures of these patterns where they constitute the entire 5th primary we are in uncharted territory where small chance exists that nothing will surprise. However I will eat your hat if we see any new ATH in at least the next 3 years.
Sorry but I’m holding on to my HAT for dear life. It’s gone miserably cold in Blightey and I am NOT giving up my hat to ANYONE FOR ANY REASON.
However I would not at this point rule out an ATH during this year. If it doesn’t happen by then then I suspect you’ll be spared from attempting to eat my hat.
Good read
http://www.evergreengavekal.com/for-what-its-worth-3/
This comments section is hard to find with the new design.
It’s the same as before isn’t it? I think it’s called ‘nested threads’?
What do you think is different out of interest?
The whole site has been redesigned for starters.
There seems no link to this comments section that is obvious.
I only found it as John put a link in a comment somewhere.
And so the Fed selloff continues with no sign of reversal……..they gambled and lost!
Always and ever impotent:
The gold and silver markets are the only markets I can think of where demand rises and prices get hammered. Not just plateau or slump….but get HAMMERED!….but that’s all just normal market behaviour right?……….
http://www.business-standard.com/article/markets/gold-import-bill-up-12-reaches-35-bn-in-2015-116011600181_1.html
Strange lights in the sky! Sell, panic!
http://www.telegraph.co.uk/news/science/space/12107960/Five-planets-to-align-in-spectacular-celestial-show.html
Some time in 2005 it last happened, wonder what the date was, and whether markets did anything unusual then?
Crash today maybe?
The Dax tested the August low this morning.
Watching the $USindex for imminent drop to kick start $gold
http://barestbodkins.blogspot.co.za/
Peter………..lol
Britain has produced the greatest number of comedy duos and comedians in history IMO
It appears that psychoanalgesia is best performed using the hypnoreflexogenous protocol. I think I should try that approach.
Finally all happening. Only thing missing: golds acceleration – coming next.
Yes John absolutely. As in 2001 it took a little while for gold to warm but once it did….well the rest is history!
I can’t help but think that if this gets bad, really bad, that US rates go negative. If that be the case then what will those “gold haters” say that over the years have rubbished gold for not paying a “dividend”?
Let’s see how they feel about gold when having to pay the banks to park their $$$$$$$!!!!!!
This is gonna be fun 😉
Hi John great site
With gold it seems to be following the property cycle (Philip J Anderson)
Gold reached a high at the bottom of the property cycle which was 4 years after stock market crash. 2011.
If this is so then around 2018 give or take a year gold should rally as the property cycle takes a breather.
Then it could go back down and as the second part of the property cycle will peak at 2025.
2025 gold will go up again.
Just a guess.
Here’s some stuff
http://www.phillipjanderson.com/videos/
Everyone seems to think the miners lead the metals; and I can’t argue with that assertion based on history. FWIW, I wanted to report my observation that on August 26/31 in 1976
when gold bottomed at circa $101, the miners bottomed at the same time. Correct me if I am
wrong, but I don’t see that the miners led the metal when a new bull phase began.
Speaking of targets, I set a target for this correction back on June 7th, see: See my post from June 7th here: https://alphahorn.wordpress.com/2015/06/07/weekend-update-139/
we are approaching my 1820 target now. Whether or not that level holds is the key to the next 18 months of trading, in my opinion. https://alphahorn.files.wordpress.com/2016/01/spx-daily10.png?w=640
I hate to be a party pooper here but the action since early Nov does NOT feel ‘waterfallish’. The 24th August action would be a much better fit.
All I am suggesting is that everyone keep open the possibility that we are near a ‘bottom’ with quite a BIG surge upwards.
At least on the DJIA it just looks like either a ‘Flat’ completing OR part of a Flat. The thing with ‘Flats’ is that they retrace ALL the way back to their origins.
Here(DJIA) and elsewhere I see a falling double zigzag after the diagonal so far, with this the last leg of it. Expecting baseline zone bounce, with most of those indices that show diagonals being beyond that point already. But not holding breath due to the abnormal (never been seen before) nature of the fail pattern across so many examples. My gut goes for 50% of the waterfall move from 1st Jan is now in.
Peter_ do you have a target for this bounce? Since I’m calling for a ‘Flat’ I can only say that it will come close to the recent highs although that is just ONE of the possible outcomes. It could of course carry on much further…..hence my call for a possible challenge to the ATH.
The ONLY thing that worries me about this decline….is that it’s not over. My trend line from the 13 Jan intraday low to the 15th Jan intraday low has not been violated and since this is an Ending Diagonal I’m expecting it to go beyond the trend line (a throw over).
FWIW: SPX 1900 then ranging to 1860 for some degree of indicator resets with upcoming full moon having a say for commence of next downleg. The delayed action of commercial selling will meet with the bounce expectations from the specs. The ATH I look for is with the volume for the upturn bringing the reconnect of mega bankster leverage for a few months to levitate all the dead cats in prep for the global funeral march into 2017. But no expectations of any sustainability above SPX 1900.
Thx Peter_ I could live with the first half of that scenario. I’m not much of a ‘long term’ guy. I tend to ‘look after the pennies’ and have found that the ‘pounds generally follow’.
As bearish as I am on the bigger picture I feel a bounce coming….a BIG bounce. The Davos World Econoimic Forum has a surprise or two up its sleeve I suspect.
Tom demark was on at noon today w/ Dow down 550 points and stated he thought we were at an interim low with a 5-8% reflex rally imminent then lower lows. we rallied 400 dow points after he was on. https://www.youtube.com/watch?v=hQE23n_hEm4
An “Intermediate” rally in Energies and Stocks is underway. If it last for longer than five trading days then it might have legs and be a Medium or Long Term rally.
Nic’s back, hello Nic!
Seems only a week or two ago you were predicting the same stuff, but from $35 oil?
Guess that weird system you advised JH to read about is to blame eh?
I think you’ve suffered (yet another) big credibility gap down.
Good call!
It wasn’t really a call was it, more of an observation of what was already happening, followed by an ‘if this, then that’. He’s not as confident as he was a few weeks back, for obvious reasons.
I would be very careful with the energy sector at this point, a lot of stresses building up there. If they start rallying without crude flying 4% in one day then the case would obviously be stronger, but I am staying away from that sector for now. I think we will see 20usd crude before the summer……either way, I have been trading CRU both ways a bit recently and although profit has been made I am not sure it has been worth the risk…..:)
I am keeping an eye on 5 refiners though, that could be an interesting short when the time comes…..
Good luck though as alays.
J
What about stocks? Which of the three options?
I think lower prices ahead but we go up and sideways for a week or two……I am looking for something around 2000 on SPX potentially…….
Just my 2 cent guess…..
J
I am looking for a meltdown today and maybe early tomorrow to mark tradable lows.
Have a hunch we rally into next Wednesday’s fed announcement, and then sell off. Low maybe first few days of February.
All certainly possible. Pre-FOMC rallies are common. However, I like to see more capitulation, rather than the weak activity yesterday.
If that is true the next Mercury will be a low again Mecury max elong west 6/2 ?
“theplanetstoday”.com has interactive planet positions. You can see Merc. position at any time in future.
I think we had some tradable lows just recently….
False break for $USindex it seems. Chart now untidy. Sleepwalkers sometimes bump into things.
Just gone short FTSE100 via 3x ETF, 40% position.
Probably just a day trade.
I see descending trendlines and lateral resistance on FTSE at this level, and also on ES.
Moe thinks a triangle before lower:

Hey GM, did you take some @%@%&*% profits at all or what? You could have retired a couple of days ago????:)
J
I got out of my shorts on 7th January jeger, I did report it here, I was still on holiday, think it was a 21% gain, having missed previous gains I felt happy closing the positions (a tad too early with hindsight).
The new position is now trapped, as it can only be traded during UK market hours. A sell-off before Monday’s open would be welcome.
I will retire when gold is subject to ECB GOMO in a few years!
Good to hear Gm. Good weekend to all.
J
Ok here are some ‘pictures’ to go along with the narrative I’ve been spouting. Bare with me on this one (…or not) because it does get convoluted.
The first one below shows the action since the August down wave. On that chart, I believe, that the late August low was wave A. The subsequent up to early Nov high is wave a of B. The next wave down from there is wave b of B. I’ve tried to break down this one further into it’s constituent parts.
http://postimg.org/image/fp2rj3ond/
The little blue square at the bottom right of the above chart I have then enlarged into the next one. That shows an Ending Diagonal with it’s trend line. However as you’ll notice the last down wave didn’t get near to the trend line which is RARE (and therefore makes it marginally ‘suspect’)
http://postimg.org/image/kgrcrr6wt/
The action since then and into this morning is clearly a ‘Leading Diagonal’ as shown by the red count.
The MAIN thing I’m trying to explain here is that wave B is itself made up of 3 huge waves. My REASON for saying that is that both wave a of B and b of B are in 3 waves.
So….what does that mean in terms of what may come next? I believe that we have a wave c of B to come which will reach the early Nov highs at least. Thereafter we’ll have the ‘waterfall’ wave which will be wave C down. Depending on whether wave c of B just reaches the Nov high OR it goes much higher we will then know whether wave C will just reach the August lows or go much lower. i.e. just a Flat or an Expanded Flat.
In the VERY NEAR TERM… since the red count is a Leading Diagonal then I’m expecting a drop to near the start of that wave i.e. towards the recent lows BUT NOT going past them.
If nothing else this exercise has highlighted to me the need for a better charting service!!
If anyone’s got any questions then please do ask.
Hehehe!! Please DON’T BARE with me. However, if you want, do BEAR with me.
Whilst methods of counting may differ, the compass needle indicates we are on the same planet.
Ugh!! The rules on this new site seem to be that if you post more than 1 chart then it goes into ‘awaiting moderation’. The previous one allowed 2.
So I’m going to split my post up. John H, please may I request that once the 2 posts are shown that you delete the composite post. Thanks and apologies for the extra work.
Ha!! it seems to have gone through.
as anticipated. we have hit 5% retracement from the 1.20.16 bottom. what a counter trend move in oil. managed to back money on $nflx put spreads today despite all the green
buying some NRG for my 12 month holdings. otherwise in cash going into huge earnings next week for amzn fb baba biib aapl
if we follow the 2008 road map (see northman trader) we may have a signficant retracement up to 2/5/16 bradley turn date and hit the 61.8% breakdown point of around 2000 on spx.
http://northmantrader.com/technical-charts/
PALS next week:
Mixed, no clear direction. Guess we rise into Wednesday Fed Meeting and sell off after.
Or will we keep rising till Feb 7?
Look at bradley and alphee
http://www.alphee.com/exe/srv_stock_dyn.exe?T4_NATAL_DATA_SEARCH_TOWN=&D3_NATAL_DATA_TOWNS=SPY+-+SPDR+Trust+Series+1%2C&B1=Calculate+Dynamic
Could be, thanks!
i think we rise until next bradley turn date of 2/5. w/ fang releasing, hopey changy in the market, counter trend 15% bounce in oil. and spiral targets 1995 on the futures contract in early feb. chinese new year 2/6/2016. year of the monkey
http://screencast.com/t/u7VIhpqw
Wedge to break Monday? Trend-line intact. But potential IHS bottom at 1860 (per Moe).
Good explanation here of why the dollar is likely to be squeezed higher (Eurodollars):
http://www.alhambrapartners.com/2016/01/21/tsunamis-runs-and-rubles/
It’ll collapse eventually, but first the big squeeze.
Hey GM
Most wioll be watching this, I know I am:) I have a half weight long from earlier at 1905 and a new one undeclared from 1858 (just fyi). I do believe we need to take a look at 2000-odd over the next week or so, but will set stops well in profit just in case.
Good luck all!
J
The USD is in a mega bear market since topping in 1985. For the last three decades it has been making lower highs and lower lows.
We have just made another lower hgh and double-top. Get ready for a collapse in the USD. The US is the most indebted nation in history and has massive unfunded liabilities.
Yes, agree re the mega-bear Allan, but let’s see what comes next, a higher high looks more likely for a year maybe.
What did you think of Snyder’s thoughts?
I see Delta points turning with the full moon and inversions bring a down market to new all time lows with the snow.
“I see Delta points turning with the full moon and inversions bring a down market to new all time lows with the snow.” – John Li
So lower than 666 on SPX? What time frame?
Obviously not Dow Jones Lows since inception. I am looking at 5 years as “all-time”, which would be true for stocks like FB that IPOed in 2012.
It seems https://solarcycles.net/portfolio/targets/ is now the best entry to this site ??
Remove Targets from that link and you have the new home page. The first picture on that home page is the latest post where the discussion will be held.
No that doesn’t work. It has to be as I said.
My short has a tight-ish stop, which I may loosen a little depending on Sunday night futures action.
It now seems to me that literally everyone has called the bottom, and that we’re going to bounce up to various levels.
Hmm, I’m not so sure.
Yet to see any panic, bulls still complacent.
Well, clearly it was some sort of bottom which is why shorts cover and go long. A tradeable bounce of 5-10% is very important to making money when trading:D How high we bounce is ofc anyone’s guess.
J
Just watched Star Wars online….zzzzzz, so dull.
A blast from the past….
https://solarcycles.net/2012/05/22/cycle-inversion/
Comment from Kent is interesting within that thread.
Night all.
Full moon: December 25th, market started crashing within 2 trading days.
New moon: January 10th, brief mall rally.
Full moon: tonight, rally on Friday, will it continue on Monday, or will inversion take it down, as per Kent’s comment in the link?
Hot for download – Making a Murderer – now threatening to murder Netflix shorts.
Snow melting, rain due before Fed.
SPX 1922.4 – mmmm
Viable, do you think?
https://pugsma.files.wordpress.com/2010/06/pug-sp-500-monthly-eod-1-15-161.jpg?w=1024&h=615
Assuming this happens, what would come after the C3 top in 2028 Peter_? Thanks.
Both counts disregard the probability of the recent failed primary 5th via full ending diagonal. Since that fail mode was echoed loudly across many major bourses I have adopted its message to be heralding systemic seismology with waterfall to A at pugsma C2 moving C2 towards the 9th planet.
2050 in next two weeks. Any thoughts?
I am looking for 2000-2040 and if seen I will probably start to layer out my calls and longs. We have some work to do to get there though!:)
J
Asia opened up, Fed moved rate announcement to Friday. Blizzard in NYC and Washington is over. Maybe ES will dig its way out of the 1900 level back to 2030 by Friday.
Valley is this your astrological opinion or personal opinion? Just above you were saying new lows by the first week of Feb?
Bloomberg still shows FOMC announcement on Wednesday
I guess that Friday announcement was incorrect. PALS is on the negative side this week. However, if the Fed meeting was changed, and my anticipation is market would sell off after the Fed meeting, I thought that this week might offer a good long opportunity. So I loaded up long at 1885 on the spx. I will stay in this position into Friday anyways as last few days of January into February first is usually bullish seasonally. Also, there are several high probability up moves in mid February, March, and into April 15. So if I get some up side, will switch back to PALS, yet if market stays below 1900 will stay fully invested on seasonals alone.
I did read some local Fed talk postponed — was it Atlanta? Regardless, that might have been what you saw.
My trading pal insists the Fed meeting announcement won’t be until Friday. Can’t find that online though.
well, looking at 2008 we are still in correlation if so we could go up till friday Jan 29 /feb 1 and after that sell off in 3 days to a higher low..
let’s see what will happen.
Now the pictures have labels when you scan them. Before, they didn’t. Now I can make sense of it.
Surely it would be better to have the labels showing all the time whether scanned or not !
Got you. I preferred the ‘hidden’ text as the site is now so simple. But anyone else got feedback?
John
I had the same problem without the text shown for about 30 seconds after you launched the new layout. However, if you are looking to attract new users it may be beneficial to put a bit more info on the home page…..
Imho
J
Thanks Jeger
It’s reasonably intuitive on my laptop, but it looks different – and not intuitive – using my tablet…
My introduction to your new format was via my tablet, and I never figured it out… I eventually just gave up, honestly…
After trying it again from my laptop, it took a minute, but was much easier to understand and navigate…
Thanks,
Barry
Ok thanks Barry
GM says:
January 22, 2016 at 10:34 pm
http://screencast.com/t/u7VIhpqw
Wedge to break Monday? Trend-line intact. But potential IHS bottom at 1860 (per Moe).
————————————-
Shake that Booty
I think that one of the best markets to “buy the dips”, for the next two years, will be American Natural Gas as it channel trades higher for 2016 and 2017.
Latter this year I will be looking to begin “buying the dips” in Crude and Silver. (Yes, that is correct, Allan, I did say Silver).
I suspect that not only are there long term fundamental changes in the –American– NG market but, also, there are fundamental near term changes too. I suspect that Americans are becoming “shut in-s” for many different reasons and that they are keeping their homes warmer than usual with some of the savings from low Gasoline prices which helps to explain the record NG “burn” rates in 2016 so far:
http://www.eia.gov/naturalgas/weekly/?src=email
US exports of NG to Mexico increasing radically. In 2017 USA expected to be a net exporter of NG for the first time since 1955:
https://www.eia.gov/dnav/ng/hist/n9132mx2m.htm
Everyone expecting the bounce to continue: therefore it fails. No more buyers, sellers now in control again, expecting bottom to be re-tested shortly.
Beta Gamma Delta Inversion with the snow and full moon to new lows the next new moon.
Lol, nice parody, =)
Well here is a big optimist I stick to his opinion new highs in April LOL..
If the energy sector rebounds we will see a major reversal..
http://www.mahendraprophecy.com/latest-news.php?id=1031
Mahendra Sharma, love him on Kitco.com videos, =)
FWIW – I added some long exposure to SPX at 1862, with a stop somewhat below the LOD – tighter than I usually like but lets see…..
J
I have covered all my stock shorts and I am looking to go long. Delta’s S+P 500 eighteen point Long Term points have been unusually accurate over the past year and its L-7 as a low is now due. It is possible that its six point Long Term rotation L-3 is also a low instead of a high and could be coming in with L-7.
At this time I think that long “American” Natural Gas is the best trade.
Same here. I am covering my shorts right now. Even though SPY is up, IBB is down quite a bit. My model doesn’t like FOMC meetings.
Thanks John for the link to this Mahendra fellow. I would just remember that no one can predict the future, no one. Whether what he is selling is useful or not, I don’t know – possibly, but I don’t think I am going to find out for the reason I stated….:) If he wasn’t so sure, and did use words like “should or could happen” I would actually be more inclined to take a look…..
Isaacson, just taking a look at the price action for NG – I don’t see a compelling reason to go long or short at this point. Reading your posts above I am not quite clear why going long is a good idea? Keeping homes warm….meh……but increasing exports to Mexico could be interesting to monitor, allowing for flat price change and of course also demand and what the supply/demand picture is in Mexico. I don’t normally trade too much NG, so if you have any further data that can be shared I would take a look.
J
In addition, one would need to consider the USD before taking a position in a commodity such as NG. My view on the USD is well known, up up and away for a year or so I reckon. Down with commodities therefore.
I closed my shorts this morning, my lie-in cost me dear, but still a handy 2% profit banked, so can’t grumble.
Currently unsure what will happen next, but nice to see gold doing OK.
Suspect a rise to FOMC, and a good shorting opportunity at that point.
well played, there is no such thing as a bad profitable trade in my book!
J
Absolutely.
Big swing from negative to positive today. Could be the start of a more sustained rise. Shorts all closed for me although I missed the majority of the drop.
You should be able to feel the effect of that consumer confidence tablet surging through your algorithm, unless it is another fake from the far east side.
The rally in the Canadian Dollar could be a signal from Mr. Market that the lows in the Energies is in. A rally in the Energies would increase the odds of a broad market rally in stocks.
The Industrial Metals, Copper and Silver, have broken out to the upside today. This is more evidence that the Bear Market in Commodities is over.
As of today I am going to consider that the Bear Market in Commodities is over and, therefor, to start “buying the dips” in Commodities.
This is also causing me to consider changing my opinion of Delta’s stocks six point L-3 as a low instead of a high. Both L-7 and L-3 are due in January and if they are both coming in together as lows then it increases the odds that Super Long Term point 7 is coming in early and stocks are on their way to new ATHs and beyond. This is a major change of opinion about the markets for me.
More correctly Richard, you made the exact same declaration a few weeks ago.
Back then oil was at c. $34, and subsequently plunged to $27/8.
So, let’s see if you have more luck this time?
I suspect you’ll be proven totally wrong once again, as I think industrial commodities have much lower to go.
Good luck.
NG could rally:
http://www.houstonchronicle.com/business/energy/article/Natural-gas-headed-up-6783289.php?t=55e8c33ce3
The USA is no where near self sufficiency in Energy:
http://peakoil.com/consumption/the-myth-of-us-self-sufficiency-in-crude-oil
This ‘bottom’ in ES looks very different to the previous two plunges, both of which had very swift recoveries, with plenty of ‘uumph’ behind them.
This time, no uumph, chopping around, unable to gain much headway to the upside.
A sign that the bulls are exhausted, and there are now more bears at these levels?
Hard to see ES 2000 being reached, maybe 1950 though.
I would say possibly no more bears right now, bulls still scared so indecision prevails:D
J
I am still a bear. I jest but still believe new swing lows. Got out of IBB at the 10am lows this AM, and will short in the next day or two again.
Oh I realize it could be confusing because I said “Same here” above.
I read “I have covered all my stock shorts…” and I tuned out the rest of the message when I said “Same here”.
This week PALS is mostly negative, and this continues into next week. Fed meeting acts as price magnet most times, which is why I went long Monday at lows. After Fed announcement, I will be lightening up my spy long position. Shorting so far below the 50 day moving average rarely pays off especially from late January until April 15.
April 15, tax day, in US acts as one of the most stable price magnets there is for the spy, regardless of selling in January or February, market tends to retrace into that day. That is another reason I want to buy dips, cause if market continues lower, I hope to be able to exit higher by that day.
Was surprised to read this valley. I thought you were day trading?
Surely you would sell the rips on down days (like in 2008 and 2000), and only start to buy the dips nearer April 15th? Hard to trade Feb and March based on something weeks and weeks away.
Good luck.
I focus on day trading the e mini. Yet in another account I swing trade the spy. Helps to have both short term and medium term perspective. If short term bet goes awry, exit. If medium term swing trade goes awry, remain in if seasonals are compelling in direction of trade.
From my perspective we have recently carved out some sort of bottom, obviously it is not clear whether it is a pause in the selling or an intermediate or long-term bottom, but personally my view is that one either trades these set ups on the long side or one stays out – going short near a support level is not good trade in my eyes. I dont know if the PALS system takes into account recent price action is the reason for mentioning this, if the system says “buy” then thats what you do? I thought this system was a short-term swing system – positions over a matter of a few to several days – not day trading?
In any case, all the very best of luck to all. FWIW, I am considering closing part of my SPX longs over the next hour or 3 if we cannot regain at least 1900 in that sort of timeframe – but it is going to be difficult to trade this week well I suspect….
J
I agree jeger, but if the game has changed (to bear) the risk/reward of shorting here with a tigh-ish stop could be attractive. Hence I think one needs to either have a view on that, or sit it out.
If I could trade US times (as opposed to only UK times) I would be shorting now. But maybe tomorrow will allow an entry. Likewise, gold has the potential to pop up to $1200, if it can creep over $1120ish. Much to be decided today/tomorrow.
I just closed my gold longs, think a pullback likely – can always reenter later.
J
Taking some profits on my IBB shorts from the open. Can always reenter later. 🙂
The geriatric force shall awaken to tea and waffle, meanwhile the rest of planet x will partake of a free vote where the early pollster results suggest a broken trampoline is imminent.
well the QQQ is not participating in this bounce today…..
The time has come to “buy the dips” in:
1st: American Natural Gas
2nd: American Heating Oil
3rd: West Texas Intermediate Crude.
And maybe, just maybe, the American S+P 500/DOW stock indexes.
Over the past several days, intra-day, has Copper been leading WTI Crude and, thus, the S+P 500/DOW stock indexes higher? Could it be that WTI Crude is not leading American stocks higher but that Dr. Copper is?
Who is the Leader of the Pack: Copper, Crude, or the Canadian Dollar?
I know, I know – its Dr Who
ES was at 1899 close on 22nd Jan, it’s 3 points higher now. Go bulls.
IBB is where the action is…it is down every day since Jan 22nd.
I agree that 1950 is possible — I think FOMC is quite dovish. More sunspots recently too.
Exited longs before Fed announcement on “strength”. Will reload tomorrow morning if mid 1800s is reached.
Right agian Valley do you think we have one more wave up above 1900 before turning down again?
Target 1930 next few days. Facebook had good earnings. McDonalds has all day breakfast.
Thanks that is what I need I kept my AEX calls the Oil rally caught me by surprise..
The bradley,spiral and Alphee are still up into next week (middle or end)
PALS suffers from far south lunar declination, and post perigee next week, seasonals are ok, and new moon lead up week is good usually. I am fairly certain we rally into Friday. I am doubtful about next week.
What a rollercoaster.. the Dax went from plus half a procent into minus 2,7pr..
This is the latest from Mahendra maybe it will be a positive guide..
Click to access 28_january_2016_trend_for_metals,_energy,_grains,_nifty,_stocks_&_rupee.pdf
Hi Valley sold my longs this morning I hope you will see your SP 1930.
I think B.O.J saved the day.
What are you plans for next week we have Sean spiral date Feb 5 Bradley Feb 3-5 and Mercury Feb 6
Good job, John. I also sold my long position mid morning today, and rolled to smaller position that expires next Friday.
Latest NYSE margin is out
http://www.nyxdata.com/nysedata/asp/factbook/viewer_edition.asp?mode=table&key=3153&category=8
What an annoying day. I am suffering from not waiting to lose money.
Hi John
I know what you mean – a tricky week. Stay safe and see what tomorrow brings.
J
Thanks! I was up a ton, wanted to let it ride, lost a ton, didn’t want to be down on the day, and then up four tons *if* I had not gotten out.
One of these days I will profit from a FOMC day whilst there is blood flowing through my veins.
John/Scott/et al , I follow Bradley quite a bit, and it did well in getting the Nikkei bottom in 1992 for example. But why all the excitement for the 2/5/16 date?
There are many Bradley dates, but that one is only significant for the middle terms.
http://bradleysiderograph.com/2016-turn-dates-sp500/
John Li
I look for the bradley dates on Time Price the Helio and Geo version
The last Helio version was Jan 19 .. bottom …well the 20th was a big bottom next top Feb 3 or 5
Or a bottom don’t now?
Has the look of a intermediate bottom
http://stockcharts.com/h-sc/ui?s=%24SPX&p=W&b=5&g=0&id=p25218494857
Can anyone spell “v-o-l-a-t-i-l-i-t-y”? I added a bit more SPX long exposure at 1877, again with stops fairly tight. I got stopped out of my QQQ long last night for a 0.2% profit……and closed my gold longs yesterday as shared here. Still long soy, corn, gdx and POT. and short UPS which looks like it will be stopped out at break even very soon…:)
J
VIX still pretty low, can go higher
i just closed my GDX longs, the price has been capped by a descending trrendline for some time and as there may be a reaction I will take the profit now. If it breaks out I will re-enter.
J
One tranche long QQQ @ 100.87 – close to support……(?)
J
Did you get filled? If so congrats. Futures are up due to Japan QE
Market thoughts:
My Trading System went to a “Buy” last night, and while I have not enough cajones to actually go long, I have reduced shorts to a very modest 30% net short…
That feels like almost no position at all, but that’s what leverage teaches you… hahaha
It looks like there is enough to get a pretty good bounce here (charts / oscillators / sentiment), but I simply don’t trust this market one bit….
Been a good month, so going “small-ball”,and I’m looking to add to shorts as we get higher, but in no hurry as long as things look bullish…
Call me “Baby Nicolas”…. 🙂
Thanks Baby;)
So the global bear has been verified, so what. Go long until March, April or May. Say what?
So the 7 year bull cycle is ended with never been seen before chart patterns everywhere. So what? The sentiment is still bull crazy for absolutely no fundamental reason, so what? Prices are so way over extended (accepted as the cause of the freak failure patterns), so what? Go bull crazy or you miss the obvious. And the obvious is – CB omnipotency. Believe in the mystic power, and know that the moon is really made of cheese.
I agree the bull is broken – probably. If you only trade one direction, just wait for the right time….?
J
Al – you will love this
this backs the above story up
http://plata.com.mx/Mplata/articulos/articlesFilt.asp?fiidarticulo=281
Near record temps this weekend could set the Energies back to new lows (led by NG and HO). This would also pressure stocks to set back too. (By my calculations HO’s Delta I-3 is due today and is clearly a high so that its I-4 will be a low and possible a new low.)
Clearly schizophrenic. Or just having a laugh at those who take him seriously?
Just 2 days ago…….
‘The time has come to “buy the dips” in:
1st: American Natural Gas’
Mad as a hatter.
purvez, where are you, hope you’re well?
I-3 is today. When is I-4?
Bruno says:
I’m a longtime follower of Yr.blog, John Hampson, and I appreciate Yr.work alot. This time, in addition, there’s ths marvelous picture to open “targets”. You know, the mountains? They are the Langjoch and Plattjoch (italian: Sassolungo e Sassopiatto) viewed from the Seiseralm (italian: Alpe di Siusi) in the Dolomites, South Tyrol. Behind them lies the fabulous Gadetal (Val Gardena) one of the most beautiful valleys of the Alps. Gratulatins and many thanks
Thanks!
I am taking 25% of long positions off the table now in terms of SPX and QQQ.
J
and another 25% now, the rest can ride next week with stops set.
Have a great weekend all.
J
Well done on those longs.
Good job, Jegers….
I just added a layer of shorts at my 1920 SPX level…
Looks like we’re pretty much on the same page here, but your way actually MAKES money…. LOL 😉
Are you 50% into your shorts? Do you think SPX 2000 is possible?
I’m actually at 87% net short right now…. I was up over 400% net short over a month ago, so clearly much more to go….
2000 possible? Of course…
I think that’s a stretch though, and my scales will be done before then….
I would expect we’ll top out somewhere between here and 1980, but as mentioned earlier, I don’t trust this market one bit, and it could literally do anything…
I know that’s not really a helpful statement for positioning oneself, but that’s why I’m not too levered up at this moment…. Just a LOT of cross-currents going on, and rumors/news/CB actions aren’t helping….
I had a target of around 1930-35 so have changed my mind and offloaded now. Let’s see what next week brings.
All the best
J
Good trade, JS!
Well done!
Bearish momentum has been stopped so time to let the Bulls do their thing before going short again. Expecting 3-4% further upside at the most.
Well done INDEED, Jegers!
And here I was doubting we’d even GET to 1920 today…. hahahaha
Today was unexpected, and yet it feels familiar.
I recall that we were shorting/scaling in 10/2014, and then at the end of 10/2014, Japan announced pension fund stock buying. The market rallied the entire 11/2014.
Now, they announce negative rates. Is this the first shot, or the last shot?
It was an initial target only, I still think its possible that we head up towards the top of the large triangle (2040ish) over the coming weeks but there are other factors that I think may come into play – and I have a bunch of SPX calls both Feb and March in any case so wanted to book profit bearing in mind recent volatility. Next week if we see a retrace down to 1890-1900 again I may get back in on the long side especially if crude doesn’t slip back too much – I will need to take a look at the charts on Sunday night in more detail. I think it quite likely that we will see around 1550-1600 on the SPX this year, so in the larger view this is something that I will bear in mind – but nothing goes in a straight line so if can bag a decent percentage of the (possibly) 1000 points on the SPX on the way there I would be more than happy.
Just going back to the crude scenario, I wish I had gone short a few refiners already when I brought this up a couple of weeks ago but I am not sure we have found the longer term bottom in crude – although we certainly seem to have found a bottom of some sort. You will remember that I was long CRU from 3006, it spiked to 3084 where I moved my stops to break even, and then over the next several sessions it sliced through down to 27xx so the stops kicked in but CRU is trading at 3422 now….but at least I was safe…:)
It is easy to get carried away, I note that my performance since September 1st last year stands at just over 167% net gain, with around a quarter of that in the last 6 weeks. I can fairly frequently go through periods of 20% draw down, especially during periods of whipsaw action which makes it difficult to swing trade – and bear in mind that if all my Feb and March calls expire at zero (they were OTM when I purchased) that will be a 11% loss on my pot. But, the 2030 and 2040 calls are very much in profit, my 2120 and 2180’s not so much…..:) I have allowed for a 6% overall loss on those.
Apart from the SPX calls, I am long Soybeans and Corn and POT – but am 89% in cash now as I was quite heavy long SPX /QQQ and so on until last night. Time to really consider how to re-apply the released funds.
p.s. and just fyi, when I quote gains it is always against my nominal trading pot only. That is to say, I have a pot which for example sake is “100”, whenever I go above 130/140 I will withdraw funds and use them elsewhere. Each year (normally) I set the size of the pot according to my overall financial situation, and the easy thing is that since 1 Jan 2015 it has not changed size if you see what I mean? Just to put things in perspective…..
Good luck to all.
J
Thanks for the comments. Wow you are certainly doing well.
Well, if you pick a period to suit – it can look better or worse of course. In August last year I was down 22% in that month alone – but that can and does happen. The longer term average (for which I have current records – so about 6.5 years) is around 53% per annum – before tax. In the last 19 years, of which I have been trading around 14 of those (sometimes hobby, often fulltime) I suspect it would be nearer 40% than 50%. I didn’t keep such good records in early days, plus I lost a load of records at some time around 2007. In 2008 for example I was down 22% for the year.
The pot allocation also varies quite a lot. If my pot size is currently “100” – then it has also been 25 at times and in a few years about 2000. I only allocate what I could afford to lose completely without duress, and of course that varies from period to period.
The point was really to put things in perspective and to clarify what I quoted – sometimes 53% can be enough to buy a car, other times when the pot is bigger it can be enough to buy a house. And in the years when I am negative, the losses can be quite small or enough to have purchased an apartment if I hadn’t lost it…..my best ever year was 246% gain, and my worst was around 65% loss – but thats pretty extreme – after all I cannot be 246% down, these are all relative to the *initial* pot……
The main thing is, we all learn over time. Thanks to many here and others I know in the game or elsewhere the trend of profitability is up constantly from when I started. At some point it will be all I do (again), however as trading can be quite boring most of the time I suspect that I will need to allocate a large pot once again and make maybe 30-50 trades a year only on a long-term swing basis so I can get back out on some expeditions around the world and develop the physical oil broking business that I started a couple of years ago. It is very small at the moment with only a couple of smaller term deals, but there are big fish to fry now into China so perhaps it will be possible to get close a couple of big deals that I am working currently (I give it 10% chance of success) – which would open up more possibilities in time. Luckily I am employed now to do pretty much what we do here within oil, with an office set up at home so have flexibility to explore a variety of options. In truth, at the age of 44 it is a bit strange to be back working for someone else but in these circumstances it doesn’t *feel* like I do….which is what I get allergic to most of the time over the past 2 decades,,,,,but, I have done my share of commuting in London….and I don’t miss it one bit…..
All the best
J
With returns like 53% per annum consistently, you are beating Warren Buffet and should really consider starting your own fund!
PALS Next Week SPY:
Phase: positive all week (unless new moon inverts again)
Distance: weak Mon Tues post apogee, positive Wed to Fri
Declination: weak all week, far South
Seasonals: no clear advantage, unusual volatility
Planets: bullish no bearish factors, several bullish
Summary: Exited long position at close Friday. Looking for shorting opportunities at noon on Monday until next Friday.
Thanks Valley very good call Sp500 at 1940,
Maybe next monday still up that will be the start of a more volatile week ahead
For the Mahendra lovers this is an interesting link from his newsletter Jan 25-29 and the days ahead… He is not bullish on oil longterm I remember his newsletter may 2014 he called the last top that was spot on.
Also the analogie 2008 and 2015 (Jan and Feb) is still inline if it will stay on track after Monday we will dive agian not to new lows but close..
http://nl.investing.com/commodities/crude-oil-streaming-chart
Click to access 25-29_january_2016_weekly_financial_letter.pdf
To all
Have a nice weekend.
Dax: It’s quite possible that the top yellow line will be hit again: http://www.screencast.com/users/prince3000/folders/Default/media/aac43fe4-d7ac-48ef-b51b-6eda95c834f4
Hi folks, hope everyone is keeping well.
I have a quick question which I am hoping John H
or one of you other guys may be able to answer-
Has there ever been an example of both the DJT and
RUT trading in to a bear market (on the 20% from high definition)
without the SPX and DJI then following?.
Much appreciated if someone can answer.
Martin Armstrong at it yet again………
“The REAL BULL MARKET will see the metals rise with equities”
This statement contadicts history TOTALLY! It is now obvious that MA has allowed his disdain toward the gold community to cloud his perception of fact.
I guess we should start with being open to anything being a possibility whilst leaving emotions at the door? I don’t and have never read his stuff, in my experience most of these people are at least as wrong as I am on a continual basis…..
J
J, always open to any possibility however when somebody pounds table and says ignore history, listen to me, then I am very wary of what they have to offer.
I will always lean on the side of history first.
I read Armstrong every day, often for amusement more than anything else. Some excellent typos guaranteed.
I am intrigued to see whether he could be right about equities and gold rising together as the sovereign bond bubble bursts after c.33 years (arguably after c. 94 years).
In the 70s that didn’t happen, money fled sovereign debt, rates therefore rose, gold had a 22x increase, whilst the broad markets were sideways for c.17-18 years.
However, I am also mindful of cycles, and the current secular bear is due to finish within a year or so, then could be off to the races again.
So, I’m open-minded, undecided, watchful.
SPX still far from -20% on my spyphone, is it new normal corrupted? No wonder so much bear bluff bull stuff. Meanwhile the fail pattern may as well be a leading diagonal (except its wave 2 went awol). Should we suppose anything can happen, the more berserk the more the new normal?
Why not? Been happening for years already. Another month ending dressage, bombs away.
I am aware the SPX is nowhere near -20% and
that was the basis of the question – has there been any
example of both the DJT and RUT trading in a technical
bear market (-20%) where the SPX and DJI have not followed.
The DJT in particular was a lead indicator for US markets
in 2015.
For some there is only after the fact, incredible doubt in the face of incredible reason.
Why bring it here, this site is virtually closed due to the demands and encampment from day-trading (and other) schizophrenics, doubting Thom’s and Tell Me More types who have no apparent interest in the postings of the erstwhile host.
Am tracking a 10 month cycle. According to this cycle next two months are down, possibly a lot. Worst two months of the 10 month cycle. Typically spx rises into April 15, tax day. However, based upon 10 months cycle, interest rates nut that must be cracked, commodity sell off, etc., I am looking for a deep sell off in the next two months to about 1695 on spx..
Hi Valley,
SPX 1700 is mentioned by Stan Harley in his latest update around May 10..
Goodluck…
Thanks, John. February 10 is next Fed speech. One scenario is market falls into meeting, a lot, giving them excuse to announce no rate hike.
My Pleasure … That was on my mind too, the fed needs an excuse to make up for there bad call in December…
We will see if the rally has more legs tommorow
I think the next bradley dates 3 or 5 Feb will be very important this week they have to be tops
and bottom in early March
Looks like next Mercury will be a low if we don’t go up today?
Hi Valley Are you going for the fed Scenario?
Look at Chris Carolan’s Tidal graph..
Goodluck.
Tides obviously are useful. I use them also. I don’t see any real strength until after Fed meeting. I bought low yesterday and sold half today near close. Will sell other half if we reach 1950.
Thanks Valley I should have sold my puts yesterday and buy them back today but I hope we will see new lows before the fed meeting.
Darkpools also bought the lows yesterday but sold the highs at te end of the day..
Valley,John
Do you plan to go short before ADP today. or wait for it. How is the PALS next week.
PALS next week on spy:
Phase: positive (unless bear market inversion)
Distance: positive
Declination: negative until next Friday
Seasonals: positive
Planets: neutral
Summary: assuming we are in mini bear market. expecting new moon to invert causing weakness next week. will try to make money by day trading.
Here’s my SPX daily Renko chart. It has been great and calling tops and bottoms. It just marked a significant bottom, see ADX indicator level. It provides a pretty nice wave count as well. Like I’ve been saying, and of course I could easily be proven wrong, but I believe we just finished the shake out phase the John notes, and now we are embarking on the final push up before we roll over. We’ll see if the SPX clears 1956, then 1965 then 2000.https://alphahorn.files.wordpress.com/2016/01/renko7.png?w=960
Ladies & Gents, I’m off on hols for 2 weeks. I’ll update the charts when I’m back. Good luck to all.
Have fun, John! Thanks.
Your recent depart brought forth the budding of the fruit of your work for our benefit. Accordingly I have become bolder by this second impulsive – increasing my exposure to the short side of CB props and the long side of gold (the trinity). You have heralded the great waterfall.
All non-believers should now kindly take their snake oils elsewhere, or be consumed.
Have a great time John!
Thanks Jegersmart
Actually any unheard of or unusual destination recommendations for travel are always welcome. If its any good let meknow??:D
J
Jegersmart: what about Volcano following for a holiday: http://metro.co.uk/2016/01/31/photo-series-captures-erupting-volcano-in-all-its-fiery-glory-5654500/
Haha – I had enough of volcanoes actually – I was in Iceland hiking when that one went off. Amazing sight but felt somewhat vulnerable until I got back into civilisation….:)
J
FWIW, as of this morning, I have decided to cover all shorts, and have actually gone long..
I am at a 23% net long position ATM, with no real desire to add to it at this point, but we’ll just see where we go…
That is a reversal to my earlier strategy, but it comes down to one specific thing:
Either you follow your system, or you don’t.. One is the right thing to do, and the other is not…
My trading system says be 50% long, the charts generally look bullish, HY is starting to go back up again, so as much as this pains me, I am now long…
Process matters….not the result… *gotta keep reminding myself of that*
Just curious Barry, what signals in the trading system changed so suddenly? Is it the VIX under 20, or an oversold condition?
My system flipped to a buy several days ago…
It didn’t change, ~I~ did….
I just asked myself, if I didn’t have any positions on right now, based upon everything in front of you, do charts and indicators say higher or lower? And my system being long was part of those indicators, but lots of charts said “higher” to me as well..
Again, are you a trader that follows his systems or not.. Today, I answered that “yes”…
And of course, this is the same chart-reading skill on my part that says T-bonds should be going lower….
So there’s that…. :-O
Bulls needed for body parts, apply elsewhere – anywhere
I have taken long positions in SPX and XBI – the latter seems to be in a falling wedge which I like to trade.
GLA
J
au revoir monsieur Klingon
Now up to 32% net long…
Step TWO to a life of poverty, no doubt… :-O
No poker here, but you can stare at this…
http://barestbodkins.blogspot.co.za/
Biowreck index is now down over 37% from nicholas’ top recommendaton price.
i was pretty sure he should have given out some stop ideas with such touts
Central Banker’s are N’s stops… He’s “convinced” of it… hahaha
He must be on such a great vacation he’s completely forgotten to come back…
On the other hand, his money looks ~much~ better in my account than it did in his, and I’ve been taking good care of it for him…. hahaha
Jeger’s been doing a great job of taking care of some of his money too, I’d imagine… 🙂
Well if I have it will be my turn for someone else to “take care” of mine another time…:)
The point I made about Nicolas many times was not that it was a problem he was bullish, but more that he was a troll – i.e. no plan, no clue and on top of all that smug as f**k. It’s just not a safe attitude to have.
imho
J
https://pbs.twimg.com/media/CaOoNvBWQAALE0V.png:large
John Li asked me earlier today about my current trade re-orientation, and I thought the following might add some perspective to my earlier answer.
It’s something I’ve started reading (re-reading?) every couple of days, and I think it’s one of the things that helps me be better about keeping an open mind….
————————————————————————————————
From Richard Wyckoff and worth a read each morning prior to taking a trade
“The information you can derive from the tape and from your charts is far more valuable than any that you can get from any other source. There is an old saying: The tape never lies.
Your judgment should be based on sound premises. You have all the facts before you; assemble these and make your diagnosis.
Decide what the situation calls for; then use courage in acting upon your decision.
Be courageous, and somewhat bold, but with a certain measure of prudence – alertness and watchfulness combined with caution.
Allow for the unforeseen and the incalculable.
Learn to think and act promptly. Your decision becomes a command to trade.
Having placed your order, never fear to revise your opinion.
You must have flexibility; the mere holding of a certain position is no REASON for your holding it; never be bullish or bearish just because you are in a trade.
The market always tells you what to do.
It tells you: Get in. Get out. Move your stop. Close out. Stay neutral. Wait for a better chance.
All these things the market is continually impressing upon you, and you must get into the frame of mind where you are in reality taking your orders from the market itself – from the tape.
Your judgment will become poorer from the very time when you decide that you know more about the market than the market is telling you.
From that moment your results will be unsatisfactory, for in this trading business the tape is the boss. You must learn to obey its orders, doing exactly what it tells you.
When you can accomplish this, you are on the high road to success in your stock trading.”
Hypnosis also under consideration by CB’s – e.g. you must do as the market tells you and we are the market so go long no matter what. Best cure is a bucket of cold water.
Haha Peter, to me it seems that they already using it and its working well….^^
J
Its a good thing to remember – however in my experience occasionally the market does something that I can only identify as “lying” – i.e. it shouts “go left” and for a short while it does and then makes a u-turn and lights the afterburners, leaving you bruised and in a foetal position with your clothes/bodyhair still smouldering from the heat…..
imho
J
Let the smack down begin in the most contrived market in history in 5..4..3..2..1……
http://stockcharts.com/h-sc/ui?s=$GOLD&p=D&b=5&g=0&id=p35551000307
http://stockcharts.com/h-sc/ui?s=%24GOLD&p=W&b=5&g=0&id=p56051997881
Good trading the past several days, Jegers… Very well done… 😉
You win some, you lose some……but thanks.
J
This waterfall decline really struggling to gain traction…
HUI doing a nice reverse waterfall though.
I took a few pct profit on XBI and flat on SPX, the rallies are quite heavily sold into so I want to be more neutral right now.
J
I just came here to relay my thoughts here, and I see you’ve pretty much beat me to it… 🙂
I’m long, and holding at about 38% net long, but the market does indeed look heavy here, and it wouldn’t take much for both my system to reverse back to short, nor for me to get rid of these longs and get short again…
Regardless, still holding long, but very unimpressed today….
US$ finally finally breaks from extended e wave, kickstarts $gold break out. Good as gold for preserving the buying power of rapidly shrinking dollar value. http://barestbodkins.blogspot.co.za/
China not open all next week – but its in the bounce or continue zone – needs watching for a trigger effect. The bull cycle fail mode portends significantly more drama than all this fiddle faddling, but focus appears to be in the currency markets for now.
Thanks, Peter! Good summary and info about China being closed next week.
My guess is that tomorrow (Friday) will open up slightly, and then sell off significantly; further selling into next Thursday. Won’t short at these levels, but will buy with leverage if we reach 1700 to 1750 on spx. Election years usually chop into summer and finish very strong. So 1700 excellent entry for a long term buy and hold. 2004 is nice analog, with chop into summer, and rally into December.
I agree, but why not short to 1750?
Well,I’m going to disagree with Valley…
Obviously, the market can do ANYTHING short-term, but after looking through charts tonight – like every night – they’re telling me “higher” right now…
I don’t have a time, nor a price expectation in mind, but just holding long and believe that’s the side to be on, right now…
As well, and to John Li’s point, you must not believe too strongly in your own forecast, because to me, if I was sure the SPX was going to 1700, you can bet I’d be shorting the piss out of it…
And the problem is, it just seems like ~everybody~ wants to be short right now… And my charts just aren’t telling me that…
And looks like I got a new avatar… I like it!!
Critical eye, and all… Or am I just the one-eyed man, who just see’s half of what every one else see’s? Uh-ohhhh…
My charts also suggest a move higher short term but the market can change direction very quickly so I’m being a little cautious just relying fully on charts.
Barry, re:”And the problem is, it just seems like ~everybody~ wants to be short right now… ”
Where did you get that sense? I think everybody is afraid to short right now.
Hi Valley if that is the scenario then we will see a bumpy ride ahead.
The currency markets USD-Yen and USD-EURO do not look very promising
The bradley siderograph can also fit in this scenario interesting also the big run up after the summer.
Bumpy chart 2004…
Nice chart. 2004 was also Year of Monkey, which every 12 years. 1992, 1980, 1968. If you look at each of these years they were not bullish. Monkey is smartest animal, and if market takes on that trait, could be difficult to trade effectively this year. Lot’s of snap back rallies that are fake outs, and deep sell offs that test the bulls.
Thanks, I lived with a Monkey for a a long time not my favourite animal but they are smart and calculated when you think you have figured them out the season is already changing..
The Monkey business song LOL…
So if mister market is like that sell high buy low haha..
Mahendra is getting a little bit nervous but is still bullish his advice is to buy this monday again.
Click to access 5_february_2016_daily_flashnews_with_day_trading_range_&_strategy.pdf
Good weekend to all..
Just look at all those lovely points to bag……but that’s the tricky part haha.
J
USD chart looks really ominous. Been saying it for nearly 18 months. Aussie gold stocks began outperforming in November 2014 signalling that gold and silver were pretty muchin a bottoming/ basing pattern.
Since then many ASX listed junior/mid tier gold stocks have been 5-10 baggers or more in a few cases.
The USD dollar was and still is the most crowded and lopsided trade I can ever remember and it is going DOWN with a HUGE thud
http://stockcharts.com/h-sc/ui?s=%24USD&p=W&b=5&g=0&id=p57902728959
Hello Allan.
So you think the Yen, Euro and Sterling etc are all better bets than the USD?
Curious why?
US is the most indebted nation on the planet. They are going to struggle just to meet their social security bill not to mention their massive military budget.
Certainly the Yen,Euro and Pound have tneir own issues but the USD is sittimg on a perch that is incrementally far higher.
US share markets have attracted masiveinflows of foreign capital in recent years similar to the period following the Asian currency crisis and the lead up to the dot com bubble.
Just as the bursting of that bubble saw massive outflows of capital from the US post dot com era, that overwhelmed any US Bond buying and led to a USD collapse and gold surge, so to are about to see a similar scenario unfold.
This time around however, it will be far more pronounced as USD speculator positions are at extremes and whilst most are anticipating a post GFC dollar surge, this time is NOT to be compared.
GM I will just add to the above by saying why are people expecting the USD to make substantially higher highs anyway?
A look at the very long term chart of the dollar shows it to be in a MAJOR bear market that began in 1985 after topping at just over 164.
It seems totally bizarre to me that anyone would expect higher highs in what is clearly a long term chart that is making lower lows.
Couple this with my points above and the dollar is set to shock and awe!
We agree on the long-term dollar demise Allan, but I think for a couple of years it will surprise you to the upside, due to eurodollar tightness (after a little fakeout plunge shortly maybe), and being perceived as the strongest horse in the glue factory. The US has a load of debt, but others will reach a crunch before the US, in my opinion.
Support for SPX now on the historical side. Green news feeds the arm (ageddon) of the bear. When the Fed is seen to be on the very right side with caution the self-feeding complex unwind gets very big momentum. But then some think I’m just over-bearing.
So Bradley has come and gone. Is it a top or bottom? Sunspots have come back too. Interesting.
I am bearish through next week, but I have little positions overnight.
I sold some actual physical gold today, the funds will be redeployed into gold miners following subscription to Brent Cook’s service, hopefully after a gold price decline to marginal new lows.
Bob Hoye is buying gold miners on dips, and believes the real price of gold will rise and gold miners from here will have advantage vs. all other asset classes.
Yes, in the 30s miners did 10x, in the 70s it was 22x, from these levels over 10-15 years, 30-40x is likely. I’m speculating at the junior explorer end of the spectrum, as reward potential is huge, assuming gold turns up shortly and oil stays down.
Monday may be up day, will peal off my long calls on strength and re buy on weakness. I believe next week will finish way up, with bottom on Thursday. So buying short term calls lotto tickets on Thursday may be a good recipe.
Good call on Friday/today. Are you still calling for selling till Thursday? But now, Thursday and Friday are up big, so that despite the selloff, we end up way up.
Pre-holiday rallies are frequent, but that is one wild swing from possibly 1700-1750 as per your earlier post.
Thanks, John. Sell offs are elevator, rallies are stairs. While PALS is mostly positive next week, I am guessing Fed speech Wednesday will be for more rate hikes, and market will bottom Thursday at 1750.
We like a good bit of solar impact on the stock market or astrology..https://twitter.com/platypusfoot has suggested 20-22 Feb as being a “hit heavily”
To Reply to John Li:
I replied yesterday, but for some reason it never posted.. ???? (maybe the two links included screwed it up?)
Anyway, I stand by what I said earlier, that the strong majority of the many charts I go through every night have three similar things going on…
1 – Price declining – It’s driving more people to pessimism on the market going forward… There are a number of sentiment gauges that are low.. Not really something that’s definitive, but certainly one piece of the puzzle for me..
Also, I use pretty much the same template to look at all my charts, so I can see trends developing as a whole, to get a general “feel” for the market… And on this template there are two indicators…
2 – Money-Flow: Pretty much to a chart, MF has been trending higher for a couple of weeks now…
As prices have been fluctuating and moving lower, MF is going up, in some cases strongly…
3 – SA-RSI: I also follow a self-adjusting RSI indicator… The parameters adjust based upon volatility. Again, almost to a chart, the indicator is on the bottom of the range (another way of quantifying and confirming for me the pessimism in the market)
And when you put those all together, and you’re seeing the same thing over and over, it just confirms to me that being long is the way to be right now… Certainly, that didn’t work Friday, but again, looking at the charts, MF was STILL going up, even Friday…
So that’s the way I’m playing it… I am up to 45% net long going into Monday…
The market changes all the time, so that may (will?) change a week or a month from now, but I’ve learned (still learning?) to trade what I ~do~ see, not what I ~want~ to see….
Hope that helps clarify my position…
Thanks I get it now. I don’t mean any disrespect BTW. There is enough pain in P&L to worry about.
Your sentiment measures #2 and #3 are based on technical price/volume. My statement was just based on the investors I track, and they have been waiting for S&P to hit 2000 (even though now less sure than before). Indeed, I can see myself agreeing with them too — if 8/2007 looks like 8/2015, and 1/2008 looks like 1/2016, we WOULD hit 2000 on S&P by 5/2016.
I have no positions in US stocks overnight. I am short China.
I had to leave early on Friday so put in a limit long SPX at 1865 which did not hit. Depending on how it looks over night I may cancel that order and see if we can reclaim 1900 odd before making a further move on SPX. I am considering a longer term short on Nasdaq 100 though, I think that has the biggest downside potential. Let’s see what tomorrow brings….
good luck all.
J
Watch those fibos.

I was 3 days early in October.
SPX futures are up Sunday night after Super Bowl. Given PALS being positive on all four aspects from Mon to Wed, and Fed speech on Wed; I am going to keep a small long position into Fed speech, in case we get a 3% rally into Wed.
Hi Valley,
I have been keeping a record of my lunar short term cycle which uses elements of PALS (distance, dec, phase) and it is working nicely over the period (at the moment) although it doesn’t nail tops/bottoms. Today is the start of a roughly 2 week bullish period to 19th Feb, although I have 11th as a possible low this week. I am long from 5730.
Dates and past performance since Sept 2015 to 22 Jan are here, it has trounced the FTSE and Dow http://www.17yearstockmarketcycle.com/
Dow: +2216 points during bullish periods vs actual +779
FTSE: +1085 points during bullish periods vs actual +6
Regards,
Kerry
Declination seems like the most useful of the three. I track it closely and while it doesn’t work every month, and bear markets are tricky, over time it allows a real advantage. Distance is good also, with apogees tending to be weak month after month. Phase seems to invert during bear markets. Such as todays new moon selling off so much. Glad you are statistically measuring the results, very useful.
Hi Valley,
So what now?
At opening Europe, SP fut sold off sharply do you still think we will recover from here into the Fed?
Thursday is also a Mercury day could be the low anyway I sold my shorts..
Dark pools covered there shorts last friday.
Good luck..
Happy Chinese New Year indeed. (We follow the moon…)
I am expecting a rally sometime between now and next Friday back above 1900, so am fully long until we reach that price. If this goes deep sell off mode, will add to long position in SPY on the way down, hoping for seasonal rallies into April.
Mahe.. expects this cycle to be volatile with bounces up and down til begin March after that it’s up..He was spot on calling a shortterm bottom Januari 20..
So I think top about SPX 1950 bottom arround the levels or somewhat lower
Monkey Business…
I think gold has topped short-term, so just opened a small short position via a 3x ETF, will add in days ahead. Trade only, I’m still a long-term bull.
GM are you eventually looking for new lows for gold? (<1000)
GM it is a dangerous game you play attempting to short Au and Ag at this stage of play. Certainly we may pull back for a bit, but there are times in the past when the PM sector has just exploded out of bottoms. We may be at one such ocassion.
If this is another…….BUCKLE UP FOR THE RIDE!
I have a clear line in the sand. We bottom/top within days, or my short will be closed. It’s a small position. I feel markets are nearing a bottom, or will crash another 10%.

If gold corrects again I expect sub- $1,000, but only c. $950.
Back in the day an ending diagonal pattern (HUI) in commodities was usually a sign there would be little or no pullback, giving those left behind little chance to get aboard. Feels like that now; an overbought status–price getting ahead itself–needing a pullback, etc. Recall that in 1999 gold went from 252.40 on July 20 to 326.25 on Oct 5th. Then back down to 255.95 on April 2, 2001.
Meanwhile, that same 29% increase would equate to today’s target of 1354 which certainly looks
rather ambitious even from these levels. Of course I have no idea; but this is what history shows.
Who knows how price will unfold going forward.
The fear is breeding fear. It is not a transitory thing. The fail mode across major bourses is unprecedented. The consequences will certainly not be milder than typical, do not expect anything typical from here on. The unprecedented fail mode will bring unprecedented consequences.
My take is our combined weighted average of worst nightmare will pale in comparison. My expectation is that the hitherto systemic risk will become systemic reality and the pace will freeze the brain.. Once initiated there is no stopping. If anyone has plans to save themselves, now would be a good time to get moving with them.
I’m with you re the planning Peter_, but suspect this washout will not be the crash.
Too much fear at the moment, seems bulls have lost their nerve, hence we will probably bounce hard (into wave 5 of the big bull?).
The ending diagonals are the writing on the wall. As soon as the second leg down passed below the 1st one that was it. There is no 5th leg of the bull coming, the bear is confirmed – both at the same tick. Its a transparent, rule-based system similar to the way the Fed operates..hahahaha hohohoho hehehehe
Valley, I am 300% long after buying the dip this morning — a little too early as usual, but looking good now.
I don’t usually hold so much overnight, and so I will be taking profits when I can.
I bought the dip also. So opened down 2%, jiggled portfolio, ended day down .75%; fully long into Fed meeting as it would be nice for speech to begin with market at mid value so that it can respond to Fed’s nuanced comments. I am looking for 1875 or better as speech begins. After speech, will have to react, but believe we will see 1950 before too long, even if 1750 is touched.
Do you mean Yellen’s appearance before the house, before market open on 2/10? Or one of the later appearances, eg. 10am Senate.
What I mean is that I won’t be holding my 300% long to see what happens pre-market Wednesday. I will be trimming or exiting tomorrow.
10AM should be the pivot time. Guessing we rise into that event.
I’m not ~anywhere near~ that long, but I sincerely hope that works out for you…
I am convinced we are in an on-going bear market, which to me means “small when long, big when short”. And as mentioned previously, I clearly am looking for higher prices at this moment…
But that said, clearly, you have bigger cajones than me… 😉
8 2 2016 9000 DAX ..closing spot on.
Gold price rejected somewhat at $1200.
I notice 4 weekly gaps up in a row, expect they will all be filled in due course, over the next few weeks would be ideal for me.
Remember, strong dollar is currently correlated with stock markets up, so watch the mighty dollar for clues. I suspect bears are going to struggle to take markets much lower.
Are we heading for the slingshot move to ES 2400?
I hope so, short of a lifetime!
Aussie gold mines are going up hard as the general market tanks. We need to hold these levels or we will see the SPI let go big time. Yank futures are down pretty well at the moment. The next couple of days need to hold these levels if long.
Long gold miners at the moment. Thinking about shorting cattle. That chart looks ugly.
Germans look like their gone. Banks in general over there are in very bad shape. Can’t see how this whole show is going to hold up.
http://www.talkmarkets.com/content/us-markets/european-share-price-bloodbath-deutsche-bank-coco-bonds-collapse-shares-at-record-low?post=85205
This is a possible dax target: http://www.screencast.com/users/prince3000/folders/Default/media/f7230c91-5ed8-4606-81f4-fbb2de264f15
http://stockcharts.com/h-sc/ui?s=TLT&p=M&yr=17&mn=3&dy=0&id=p15340193779&a=333536382&listNum=29
http://stockcharts.com/h-sc/ui?s=$SPX&p=D&yr=0&mn=8&dy=21&id=p74733982162&a=444819168&listNum=26
The USD is well on its way to giving a second “death cross” within a few months. This will signal the collapse of the USD.
Ignore it at your own peril. Need I remind anyone what occurs when two death crosses are seperated by a failed golden cross?
http://stockcharts.com/h-sc/ui?s=%24USD&p=D&b=5&g=0&id=p75254259947
Just in case……
http://stockcharts.com/h-sc/ui?s=%24COMPQ&p=D&b=5&g=0&id=p97177289427
Think I’m going to ride for a bit with the positions I have:
62% net long US stocks
Short modest T-bonds – TBT
FLAT Silver/Gold – I have physical metals, but hedged flat with DUST (bearish ETF)
Long Oil from about $29.50, via UWTI…
And sitting on lots of cash…
Think we’re close to a bottom, if we haven’t seen it already…
But always mindful of it being a rally in a Bear market…
GLTA
Frustrating two days. I am out. GLTA, re Yellen.
Hello
Due to a set of convoluted circumstances I ended up being in a very remote (rural) part of this planet at short notice from 24th Jan till day before yesterday. On Friday 22nd Jan the DJIA finished around 16100 when I last saw it before leaving and as I’m writing it’s swilling around 15929…..so not much appears to have happened eh? However looking at the charts quite a bit DID happen and some very interesting trading opportunities too.
In the last 2 weeks I was pretty much cut off from the rest of the world…..and I LOVED IT!! I would highly recommend it to anyone. Jeggersmart, here’s the ‘adventure’ of a lifetime that you were asking about.
GM thanks very much for enquiring after me.
Good to see that John H is taking a family break.
The commentary here continues at it’s elevated intellectual cum humorous pace.
As far as the markets go I was expecting a leading diagonal from the 20th Jan low and everything seemed to be going as planned until yesterday’s and today’s action…at least in the DJIA. However I can’t figure out where yesterday’s and today’s action fits in with the bigger picture or rather how the bigger picture has changed due these actions.
But….the market must love me because since the start of today’s trading, on the 5 minute chart I am seeing a (wait for it) ‘TRIANGLE’ forming so there should be a new thrusting low before it all reverses upwards. My track record on triangles may well be broken today as I am currently counting a final wave ‘e’ as the DJIA heads up towards 15966. My track record will stay intact if this goes higher than 16060. IF this triangle does come to pass then it should drop around 300 DJIA points from wherever wave ‘e’ ends. I love triangles…..despite getting them wrong MOST of the time.
Good to be back here.
“Due to a set of convoluted circumstances I ended up being in a very remote (rural) part of this planet at short notice from 24th Jan till day before yesterday.”
Okay…I am interested…
(i) Looking for the fabled Nicolas?
(ii) Checking the artic to see if global cooling or global warming?
(iii) Buying guns and a bunker for when WWIII breaks out?
Hehe John Li, far far more convoluted than that.
About 18 years ago I helped some impoverished farm labourers (8) (in Pakistan) to buy the land that they tilled for their landlord and form a loose cooperative. Since I don’t believe in ‘handouts’ I gave them some very strict conditions to meet or I would become their ‘nightmare’ landlord.
One of the things was that they had to allow was for their children (including girls) to be educated (a HUGE step at the time). They agreed and although the ‘their village’ was approximately 30 miles from the nearest town (and therefore school) a friend of mine found a 16 year old student who would be their ‘teacher’ 3 times a week. The agreement was that all the children should be allowed to learn how to ‘read and write’. Urdu was the MAIN language but they also HAD to learn English.
The eldest child at the time was 8 years old amongst the kids at the cooperative. 18 years went by with some pleasing progress in their community. However it also brought some lads into adulthood (read testosterone) and there were continuous squabbling for ‘position’ which spilt over into family feuds.
One of the ‘elders’ fearing a break up of their hitherto peaceful community wrote to me asking me to come and speak to all concerned. (Wish this had happened a week earlier whilst I was still in Pakstan…but ce la vie)
Well…I’ve brokered a peace of sorts but ‘education’ also has it’s drawbacks. The kids know a lot more about the ‘world’ we live in (largely through 3 day old newspapers that the ‘teacher’ brings them) and want more of what we have…sadly.
I don’t know how long any of this will last but it was good whilst I was there. Sleeping under the stars in a ‘charpai’ (low level bed hung with strings and a ‘relatively’ clean set of cotton wool duvets for cover). Water from a well and sanitation….well I best not go there.
Getting to the town was via a rickety old tractor (more than 18 years old since it was bought second hand). Also they’d ‘bought’ an electricity generator which ONLY responded to one of the elders who would either coax it with soothing language or on occasion give it a stern warning before it spluttered into life. It barely managed to light 3 bulbs…one of which had ‘fused’!!
Aaaah the ‘luxury’ of peaceful living!!
Wow, never expected that. Good job in helping those less fortunate, even though it does come with headaches sometimes.
Yeah me neither. Have to admit I’m not sure I’ve really helped here.
The truly interesting bit for me was the ‘teacher’. My friend (who also doesn’t believe in handouts) had agreed to buy the guy a motor scooter provided in return he taught the kids at the village 3 days a week for a period of 10 years.
Well…I met the ‘teacher’ (they call him ‘masterjee’, including the elders) a number of times and who told me that this was one of the BEST parts of his life and although his ‘commitment’ expired a while ago he would continue to teach as many generations as they would allow him!!
I went back to my ‘charpai’ and crept under the duvets and cried both with joy and a smidgeon of shame.
Hehe, did I say the market loved me? It was just toying with my emotions. Bang goes the triangle. On the flip side my track record is intact!!
Welcome back p.
Enjoyed reading about your experiences, good job.
Thx GM.
Wish I could have an EW count for the DJIA right now that I could hang my ‘hat’ on. It’s all over the place since the last 2 days.
Do you frequent Trader Moe’s? It might appeal to you.
I’ve seen Trader Moe on and off. The trouble I have with him is that he covers all bases so he’s hard to follow.
Every day, I see SCTY -25% after hours. LNKD -44%. Oil is near zero.
And yet SPX is not even in a bear market. FB is near/making new highs. Is this the biggest divergence the world has ever known, or are we going to crash everywhere but SPX?
Why not? 1980 solar max or 1960 solar max, did not see much of a bear market in SPX.
Gold & USD discussed here, interesting comparison to the Yen:
http://www.marketanthropology.com/2016/02/prospects-for-precious-metals.html
Nice read. Issue I see is they talk inflation when really we have deflation. Inflation won’t take hold until a lot of this debt is wiped out and that will only occur after a melt down. I see gold (physical) as a hedge for when all hell breaks loose including banks going broke. Europe will be the first. They have no hope of surviving these next few years.
SPI is in trouble now. Aussie banks getting hammered.
Yes, first the deflation, then the inflation. Gold likely to do very well in the next 10-15 years.
As the planet goes to hell, and hopefully returns intact.
Wow – decent article from CNBC. Beware the NIRP!
Sorry – here’s the link. http://www.cnbc.com/2016/02/09/from-zirp-to-nirp-whats-the-feds-next-move.html
Danger zone begins tomorrow at 10AM with Fed speech. Tomorrow is peak of PALS positivity, and Thursday on several PALS items flip negative. Good chance of deep sell off after Fed speech that may extend into middle of next weeks OPEX.
So what do you think? IBB shows strength
Exited long position during Fed speech at 1870. Waiting for lower prices next Tuesday to buy again. Distance, Declination, and Phase are all negative beginning tomorrow for a few trading days.
I took profits too early, but such is life…
markets usually rally into OPEX. are you thinking of going long again on Tuesday and holding till next Friday?
Exactly, Pima. Buy lotto ticket next Tuesday that expires Friday.
Yellen is still speaking tomorrow…why is it that you expect fireworks today and not tomorrow too?
I also think we can make an important low Tuesday or Wednesday,Helio bradley is on the 17th has a fairly good trackrecord lately.
After that full long into Opex.
Good trading everybody..
Tomorrow is Perigee and Equatorial Crossing S to N. A volatile combo separately with negative bias. Kept small long position into tomorrows open that I bought late in the day. Crossing fingers for morning rally. I won’t be fully invested long until next Tuesday/Wednesday or Monday if we get below 1770.
Is it pronounced tomato or potato? And anyway what is it?
http://tinyurl.com/jkczgze
Meanwhile the charts need some TLC and they waiting for their open market intervention massage. Draw the curtains.
Well, still holding everything mentioned yesterday, and certainly happy to see a bit of a rally today…
But still, pretty lame attempt to go higher today… My charts say higher, and my system went back to a “Sell” signal last night, so I’m on the fence here…
The term “mixed signals” can’t be overstated…
Maybe NorthmanTrader’s article is true… “Ignorance (on my part) at work”…. Good post..
http://northmantrader.com/2016/02/03/ignorance-at-work/
Hello Barry.
Northman is wrong on ‘A’ here:
‘My main premise then: A. $DB is too big to fail and they won’t allow it if they get ahead of it if there is a blow-up risk. or B. There is no blow-up risk and this entire dump is overdone, in which case we may see a massive rally at any sign of relief.’
The ECB is rubbing its hands, it can’t wait to kneecap the banks, then the sovereigns.
All the QEs from the ECB to date have just been buying time to get banking resolution/supervision procedures in place, and it’s now ready to go.
GM I know we’ve been through this ‘hoop’ before but I really do need to understand where you are coming from.
Certainly the ECB, as you say, is currently in a ‘legal’ position to kneecap banks and sovereigns. The bit that I can’t get my head around is ….. for who’s benefit?…and will the bigger sovereigns (Germany, France et al) allow it?
Its like a detective movie. I ‘get the plot’ but I can’t understand the ‘motive’…and there ALWAYS has to be a motive. Any help you can give me in that direction please. Thx.
For whose benefit is THE question purvez.
The answer (apparent after reading scores of speeches, historical documents and leaked information) is:
humanity.
(you’ve read the Nexus, which describes the problems of the current system).
The Euro architects are ordo-liberals mostly, many from Leven University.
They recognise that socialism (big govt/marxism) is destroying economies and civilisation itself.
They set up the currency to ensure socialism is contained by two things: the market, and what taxpayers are prepared to pay for social support, so no more huge debts, and no more inflating away those debts, and of course more market, more liberalisation, and more freedom to trade, start businesses, and work anywhere in the zone. Safer banks (less risky loans), skin in the game, and a stable currency, not as hard as a gold standard, not a soft fiat. but a PTC (perfect tensile currency). This will favour neither borrowers nor savers, neither one generation nor the next, everyone gets the same.
Politicians were clueless to the aims above when they signed up, effectively signing up to their own executions, typical politicians. But they had noble reasons mostly: avoiding war, and ending nationalism.
It needs to work, but it could yet fail, due to the whole EZ project collapsing, via revolutionary impulses.
But the ECB have the ‘red button’ to press before it gets that bad, and that will be a series of massive QEs into physical gold, enabling EZ countries to settle some debts using CB controlled gold reserves. A one-time bail-out of the world.
Few years to wait, but banks failures in 2016 I reckon. (France & Germany are powerless to stop it, it’s law now).
Hmmm, much as I’d like to believe your scenario, collective ‘goodness for the people’ of the type that you describe hasn’t happened in history as far as my limited knowledge goes. Where there has been ‘goodness’ it has been due to a strong but benign dictator or a compassionate leader (like Gandi).
If this does come to pass then we will be living in an unprecedented period in history.
The ECB will be the strong & benevolent dictator managing the money.
That will be enough to keep humanity on the right line I reckon.
Even if this does come to pass, we are only talking about ‘western/financially developed(depraved?)’ humanity. The poor guy in the middle region of the dark continent or for that matter the community I just arrived back from neither know about, nor understand or are affected by the ECBs great ‘humanitarian’ effort.
The thing is ‘they’ represent by far the majority of ‘all humanity’ on this planet.
A very sad reflection indeed.
I see some suggesting a collapse in the US dollar. I don’t.
The pattern in the chart below has been seen before and it presages a collapse. In this case USD against the Euro.
Yes, normally it bounces to resistance or 1.20 in this case.
Then it should collapse to a least 0.50.
Oops I mean USD collapses against Euro.
I’ll try again.
USD will SOAR and Euro will collapse.
Sorry about that.
So we have a global bear market with severe and unprecedented EW failures, all in the charts.
Ending diagonals are playing out true to their nature, with waterfall continuations are likely commencing. US$index and US$Gold have both completed their ending diagonals and each promises complementary action. All major equity markets that have been overbought to extremes are still flagged for heavy correction by the bear.
So what to do. Start with what not to do. Make sure there are some very solid reasons for taking opposing positions to that which has been ordained by sound reasons, and understand “transitory” to mean having a short time frame. And forget about any continuation of the bull. The bull is dead and buried. The bear is here and will still be here in 2017.
Wow Peter_ that is just waaaay to lucid for you. You clearly are passionate about this subject. No mixed metaphors and obtuse sentences just plain straight forward advice.
Thanks very much.
Hi purv, you know I was once convinced that the 5th wave of the bull would still be here to later this year. It was by following JH here that it I became open to the idea that the 5th wave could fail in the face of such compelling reasoning. What has transpired has seemingly shook me to the core and made me straighten up and fly right (for now).
That’s one hell of a shake up then. 🙂 😉 Welcome to the ‘straight’ side, although I’ll miss the intellectual exercise of deciphering what you meant.
Alphahorn – are you still holding on to your pattern or has it changed. Things look very ugly now. Europe is letting go big time.
Playing out exactly as I expected and contrary to how most expected.
US markets down……..USD DOWN. Expect that trend to continue with a few lack lustre bounces along the way.
REMEMBER what JH said. When the waterfall starts there will be very little respite. And yet I still see many are unconvinced ;). That ensures the trend continues.
OK, my first share of a hunch for what lies immediately ahead.
(Prompted in part by Bluestar’s latest ‘aces’ post at Ibankcoin).
I think the Fed will make an unscheduled rate increase announcement, possibly this weekend, or early next week.
Up will go the dollar, down will go gold (for a little while), and the market crash will be aborted as capital flows into the US from overseas.
The yield curve is flattening, so it will fail ultimately of course, but will buy a month or two more, and a blow-off top for the markets.
You heard it here first!
Ok you guys are starting to scare my 2 brain cells. First Barry goes bullish and now GM talks about ‘blow-off’ tops. I’m going and sitting in my dark corner and contemplating on my navel….or as usual I’ll fall asleep there.
Hi Purvez;
To be clear, not “bullish”, just long, based upon a number of technicals I follow…
Obviously, not working out for me as of this moment…
Barry do you have a ‘get out’ point?
Do not despair, study Japanese figurines – a great investment (at the right price) to sum things up…http://barestbodkins.blogspot.co.za/
Gold at 1345? No need to get excited about an extended move higher over a longer period of time? 1345 just mirrors the technical move up in 1999: before returning back down to major support.
electic, sorry you are wrong.
I have been POUNDING the table about the following for over 12 months!
The greatest leading indicator of all, Australian gold stocks, have been signalling a new bull leg in gold.
Again this is the greatest indicator I know of. Sit back and prepare to be amazed as gold breaks all resistance with relative ease as the USD collapses.
Far too much panic buying into gold recently, I will be adding to my short-term gold shorts tomorrow, another 25% position.
I think we’ll see $1100 again in a hurry after this parabolic move.
Also, I don’t see NIRP arriving in the US ever, that would be the death of the dollar.
But I do see them raising again, possibly this weekend.
GM gold will correct of course at some point, however it could be from much higher. This would not be the first time that gold has blasted out of a bottom and not looked back.
There is NO WAY known to man that the Fed will raise. NIRP dead ahead!
Can somebody please explain this NIRP thing to me. So….if I borrow to the hilt I’ll have a healthy income stream? If so where do I sign please?
Banks only need apply 😉
Call me ‘Bank’ from now on please. 🙂 !!
I follow the analogy Jan/Feb 2008 if it still inline this day should be the last low for awhile..
If it stays on track we will go up big till end of the month.. squeeze the shorts out of the bear..
Anyway sold my puts today..
See for your self
http://finance.yahoo.com/q/hp?s=%5EGSPC&a=00&b=3&c=2008&d=02&e=31&f=2008&g=d
Valley,
Why didn’t you short at 1870 , I had some put spread and might pay good. I want to understand your logic, shorting at 1870 was not like shorting in the hole. If we go to close to 1800 and rebound with no new lows there will be good divergence, will you buy today or next week if we reach 1790/1810 , i am thinking credit spreads 3/6 weeks out. How Is PALS next week.
Good advice, Bill. Thanks. PALS is mixed next week, with positive declination, neutral distance, negative phase (except for Friday). February OPEX weeks are usually down, so seasonally not good. Planets not good as earth is swinging into opposition with Jupiter, a month either side of this event “jittery” markets. And 10 month cycle could indicate a down month, and next month as well.
Carrying a small call position into next week. Won’t check it until next Wednesday, where I will add more if market has sold off, as a lotto ticket.
Allan, I do fully agree on Yr. analysis of gold/dollar markets. Would you comment on Mr.M.Armstrong’s end of january post with the firm forecast of gold under 1.000$. I’m a seasoned trader (since the 70s) and had often profitably used “negative indicators”. Shall we suggest MA fo this role? Regards Brunobear
And as of now, up to 90% net long the US stock market…
Again, that is about a fifth of what I was short coming into the year, but at this point the market indicators I am watching look VERY bullish. Obviously, it’s a counter-trend trade, so ~not~ getting too heavy on the long side here, but as I said before, gotta trade what you see, not what you want to see…
GLTA……including me!! :-O
Barry, FWIW I think you’re on the right track, but good luck indeed.
Hi GM;
The irony is (and I was taking a pretty good loss earlier today) other than the DUST hedge I was using against the physicals I have, at the moment I’m about flat on the day…
Who knew??? All I did was hedge myself from making money.. hahaha
As individual entities the CBs are dead and have lost all credibility. The next action – as the markets continue to waterfall and economies dive into deflation and recession? The CBs will join together in a synchronized shock and awe effort to save the banking systems. How that will look, who knows, but it will be Impressive or frightening, depending upon your bent. This is the end game folks, buckle up.
If CB set negative -10% rates, stocks cannot fall, but inflation will eat away returns. As long as bears lose I guess…
They can’t set rates that low John, big entities will simply vault cash or buy gold (or oil, anything really).
NIRP is experimental, and is unlikely to have a very long shelf life.
https://twitter.com/RaoulGMI
FWIW, and to give some comfort to Barry I am somewhat long SPX (underwater by 1% or so, although felt quite squeezed yesterday tbh), long IBEX, long USO and long Corn. Not huge positions obviously. My Soybeans stops were moved up and I got stopped a few days ago but happy with that.
I might have a look at a Nikkei long at some point as well.
Just fyi – good luck all and especially to Barry and I lol
J
For now I think the lows are in we should rebound above 1900 again…Bradley Feb 17th could be a smal top..
“I’m So Bullish iT Hurts!”
Following Mah.. We just have to wait for Tuesday’s conformation if we are still up I will be fully invested…
The next Cycle from the end of the first week of March will be verry bullish it can last for 3 months..nobody believes it but SPX can see new highs..
uppppperpubbbb ..
Nice Weekend..
So kick some bear ass… sold my longs…. waiting for better short moment…
and OPEX next week….
I am too tired to predict further. Usually this means a good trend will come. Flat for the week but lots of frustration.
Same here JL, I entered a few new positions today after some price action finally confirmed (in my view) and looks far better than even this morning. Keep safe and be patient is my own advice to myself…..
J
Valley,
Do you Plan to reshort higher. and then weakness next week or is it too dangerous to short here.
Bill
Not going to short below 2000. Will move to cash though. Probably tomorrow at open.
Just liquidated all energy related ETFs… Out of ERX and UWTI…
Grateful for the rally today, and grateful to be out of the cluster-f known as oil, at break-even on this trade….
Charts look like further rally ahead, but it’s more a risk reduction move than anything else..
Just don’t really trust a 10+% move in oil today, before a 3-day weekend…
It’s a good day, though…. 🙂
Good one Barry – I am feeling a little like a raisin having been squeezed quite hard this week – but looking a lot better now (my positions, not me) and have made some adjustments to reduce exposure in some areas. I am staying long as per above tough, although I have gone short GDX about half an hour ago.
all the best
J
I think it is prudent to short GDX, but probably not SPX and so on. It depends what you are referring to. I am planning to start offloading longs around 1900SPX if seen – but won’t be looking to go immediately short unless there is a very good reason to do so.
In any case, good luck all and great weekend. I am just glad IP Week is over…..
J
FWIW, I have taken 30% profit on SPX and IBEX longs – stops trailing now. Whilst I think we will go higher I just want to make sure to book decent profit in stages.
GLA
J
My USO longs are locked in today due to US holiday, however as things are now I will probably close at least 50% tomorrow as I am fairly bearish on Crude overall.
J
This will likely only be of interest to Brits, an example of regulatory over-kill that really pisses me off, to the extent that I will go to court if need be.
My SIPP (self-invested pension plan) was all in physical vaulted gold. I just sold around 15% and want to invest the proceeds in gold explorers and junior producers (listed in the US & Canada). My SIPP provider does not provide me with investment advice, just acts on my instructions. (subject to ‘the rules’).
Here’s an email I received today:
‘Our Technical Team have had reviewed the investment proposition you have sent us and although we are aware that these stocks are all listed on HMRC recognised US securities, the majority of these companies are involved in actual mining for high grade Gold in various locations within the US and Canada. Our concern would also be the mining element of these companies as the investment is not into actual Gold Bullion, rather the shares of a company who will use the funds to potentially explore development and exploration into various mining projects. Overseas developments also introduce complications and uncertainty over our ability to perform our checks whereby these would include validating projects, forecasting and the ability to provide a return to investors when mining for precious metals.
We therefore do not believe that this is a suitable investment that we would allow to be held in a SIPP. ‘
Absolutely ridiculous. I am awaiting a phone call from someone senior, but if they do not allow me to invest as I choose, and I am forced into mid-tier or larger miners, I will sue them for the difference in returns (assuming it’s in my favour of course).
The provider is terrified of the regulator, and so I suffer from freedom of choice being curtailed. One more reason why the UK and I will part company for good before too long. Marxism rules here. FUBAR.
Come to America!
🙂
GM, I’m confused. Are you saying that your broker is stopping you from making SIPP Investments or is it your SIPP provider? My personal experience is that SIPP providers ‘apparently’ can stipulate what you can or can’t invest in (above and beyond the Gov’t rules). However your broker has no say in the matter.
I looked at Hargreaves Lansdowne who provide quite cheap SIPP management but only allow investment in funds that they recommend.
I eventually went with a firm ‘European Pensions Management Ltd’, somewhere in the ‘south west’ of the country. They are very sanguine about where you ‘lose’ your money. LOL.
Hmmmmm….I hear you GM – I haven’t bothered to set up my SIPP’s for anything “spicy” yet – so I can’t even short the SPX with mine…..:)
I love that bit where they complain about “overseas” making it more complicated…hahaha. Why not go back and ask them to find and recommend some gold miners and explorers based in the UK??:D
I am pretty sure that what you suggest is possible in the UK- but you may have to do some digging around?
J
The irony is that the FCA SIPP rules do not preclude any investments at all in HMRC recognised equities, none.
No, the SIPP provider is merely afraid of FOS decisions on potential future complaints, and the FOS is a law unto itself.
When we speak I will offer to sign a disclaimer waiving any right to complain to the FOS for compensation for the advice that they haven’t given me.
Otherwise I will eventually sue them for losses.
John Li, thanks for the kind invitation, but I’ve written so much that’s been critical of that country, I fear immediate arrest on entry. ;(
They cannot value gold on their systems, thereby they cannot value anything related to it, thereby it all has no value at all to them all. I smack my laptop about every day just to let it know who’s the boss. And show it the graveyard of predecessors to keep the intimidation mutual.
This market is precariously near a cliff… just having a peep over the edge from time to time.
haha, I am not sure those blue circles are relevant in the current scenario – but makes for a more dramatic chart of course. Even though I don’t look at historical patterns in this way, I would say the price action leading up to the 07-80 peak is very different to the price action leading up to the 15 peak. Does that matter? I guess we will find out. By the way, if you are going to trade based on what you say will happen with your chart, how will you do it? Look forward to further updates, whether overly dramatic or not..;)
p.s. we are in a downtrend in my view, the global collapse of the credit markets was the cause of waterfall action like in 08-09 as per your chart, what is going to cause it now ? Unless we make new highs we will grind lower in my view until April when a lot of frackers are going to run into problems with credit ratings and possibly debt rollover. I can see some fireworks then, and a lot of volatility in the meantime. Should be good for traders.
imho
J
Two scenarios, two different immediate term outcomes. Most favor scenario 1, but scenario 2 is still very much and in light of this overwhelmingly bearish sentiment across the globe, could the SPX be the beneficiary of capital flight for the next six months +/-?
Scenario 1, Cycle Wave 1 has topped, Cycle Wave 2 underway:

Scenario 2: Cycle Wave 1 beginning its 5th and final leg, then rolls over:

Thanks Alpha!
Great stuff, AH – thanks
Good info, Alpha. Thanks.
Wrong all wrong. Why is it so hard for people. This is pure misinformation, you cannot pretend to be so stupid –
Nice Alf. Good to see a couple to options.
http://www.hussmanfunds.com/wmc/wmc160215.htm
PALS has several positives this week. Rising tides, optimal declination, pre full moon days, Opex week entering from weakness so probable run back to 1970 to take premium for shorts. So, I am keeping a few calls that expire Friday and will peal them off as we approach 1970. Next week should be optimal shorting week.
Hey Valley I think tommorow will see some profit taking later on the day just a dip before going higher..The highs should be in early next week monday or Wednesday after that new lows arround March 5 or 12..
I agree, John. Next Monday is Full Moon. So Monday open onwards are post Full Moon days which often have less bullish tone. Thanks.
Hi Valley do you still think 1970 can be reached I have got a feeling that we will top arround 1930 and we will see a pullback next week?
I agree, John. I think next week will be unfavorable as will the following week. Looking for a large rally into March opex.
My USO long hit limit target today so am out for 12.8%. I heard the Saudis have said they will “freeze” production, whatever that means……
J
Hello all. I’m now in residential therapy for a few weeks so the charts update is going to have to wait a bit longer. Apologies.
John H, all our BEST Wishes for a speedy recovery.
Hope you feel better soon, John. Best wishes –
Hi John,
Take good care of yourself (as you’re certainly doing). At the risk of sounding trite, health is probably the most important thing we can have. With good health, you have all possibilities ahead. So here’s wishing you a full recovery to robust health! And thank you for sharing your work, it’s quite amazing.
Get well soon, your site is unique and interesting, and has greatly assisted my trading.
Take it easy John, rest, recover. Very best wishes.
Hi John – all the very best from us – look forward to having you back when possible.
J
Hey John, I wish you all the best so get better soon.
Rest up John… Looking forward to your return…
All the best,
HVA
Get well soon John! On a positive it looks like central banks have yet again struck high levels of confidence back into investors. I like it when CB’s provide us all great shorting opportunities.
It’s been over a week since I started staring closely at the DJIA chart again and I ‘STILL’ can’t decide on a wave count from the 20th Jan low. Right now allowing for another 100 (or so) point rise it would look like a flat for a 4th wave since the early Nov highs. The thing is that since the early Nov highs to the early Dec highs (wave 2) ALSO looks like a flat. Now Mr RN Elliott said that he expected to see an ‘alternation’ between waves 2 & 4 and hence what is currently happening ‘shouldn’t’ be a flat….but if it’s not a flat then ‘what the hell is it?’
Answers in a few ‘syllables’ here please. Thx in advance.
Failed 5th ending 2nd Dec 2015. (Fails can just fail sometimes). That was an ending diagonal of the tortured and disfigured variety. Being such an abused instrument it continues in agonising anguish. Now it gaps up as if it is jumping out of its skin. Yes -what skin? thats exactly what I say.
Elliott never saw anything like any of these chart patterns – new chapters being drafted by all self appointed pundits.
I am now down to about 15% net long the US stock market – using a handful of particular individual stocks… NO leveraged positions at all, other than still holding DUST…
Charts look a little less bullish than they have, so just reducing some risk…
Small minds think a like – I just closed the rest of my IBEX longs for 652 points profit each, and the rest of the SPX longs 72.x points each. I shorted GDX for a short term trade just now, and still have the majority of the SPX calls left, most of which will expire at zero at this stage. I have a couple of longs in individual US stocks, and still long Corn although that one is like watching paint dry so may close for less than 10 points profit unless I just stick some pieces of tape over the screens so I can’t see it’s there.
GLA
J
Well played those who were long during this rally.
I’m still short gold via a 3x etf, 20% position, underwater by 10%. Meh, gold is holding up despite this stock market rally, tells me it will shoot higher perhaps.
But I am liking the look of the FTSE for some more aggressive shorting at the moment, all sorts of resistance, and it tends to run out of steam and drops like a stone after these brief spurts back up.
I still have a target down at 5,200, so will be entering shorts tomorrow morning, having missed the chance today due to meetings.
John Hampson, get well soon.
Whilst not aware of your ailment, can I recommend the paleo diet and lifestyle to you and to all here.
Best site to read up on this is ‘Mark’s Daily Apple’, and I get his weekly news email.
Loads of healthy tips, from diet, to exercise, to sleep, to lifestyle,stress management, fun, everything really. I’m nearly 49, but cutting out gluten and sugary foods and eating loads of meat/veg/fish/nuts has dramatically improved my health, banishing the IBS I used to suffer from to history. Also now doing weights at the gym, feeling stronger and fitter than ever (literally), which is helping with my badminton and golf game. Also, toning up will help when I’m on the beach. 😉
Health and attitude very important in my opinion, especially with turmoil ahead.
Hi Jegers! LOL – Small minds.. 🙂
I ~also~ bought one S&P option that is no doubt going to be worthless as well..
I buy one option every few years, which serves as a reminder to me as to why I do ~not~ trade options… And it did it’s job!!
Next time I get the urge, I think instead I’ll just blow a grand on strippers….
The wallet result is the same – empty – but with strippers, at least they get happy for a couple of hours, and I do too!! 🙂
Regardless, back to business…
I have two thoughts here…. My charts still look bullish, so have no real reason to be short just yet, but that said, planning that trade…
Plan A – we rally into Friday – options expiration, and depending on my charts, short the hell out of it, wherever we are…..
Plan B – Start scale-up sells, starting from about 1930 and up to ????
Your thoughts??
Ugh the consensus….(Barry + Jegersmart) is that we still have some ‘up’ to go.
However since you guys have longer time scales than mine, I suspect I’ll still get my 100 point drop on the DJIA before you get your ‘pudding’.
The BIG FLY in the ointment is the FOMC minutes due out in under half an hour. I’ll probably go ‘flat’ just before. These guys can cause unnecessary havoc for a short while.
hehe
I tend to trade options as hedges, if 85% of the current calls I have expire at zero then it will be about 18% of the profit on the last trade. Price of doing business, but of course as it will probably turn out, I didn’t need them….but then I haven’t used my car insurance either for 10 years or more…:D
At the moment I am not in a major hurry, going to reassess tomorrow morning but keeping Opex in mind – but ideally need to see weekly closes before I commit more heavily. The last lot of positions were quite heavy for this type of market, so whilst I went a few % underwater it was a calculated risk near support…..at least thats what i tell myself lol..
GLA
J
Purvez, I am bearish as we are in a downtrend in SM – but am happy to take a whole bunch of bull points any time. I think we will see more downside soon and we take out the recent low – but from where is the question? So I will wait and watch and see if my GDX/GLD shorts pay off in the meantime. Of course if all else fails, I can watch my Corn position move a couple of points each day if I need some sleep……
J
Today has been one heck of a day to trade. I’m 10 points positive in the whole day and ALL of those were made fighting the UP trend. Sometimes this market just doesn’t know WHEN to give up.
Anyway I’ve lived to fight another day….although ‘lived’ is a euphemism today.
I just hope the down draft doesn’t start overnight though. There is probably as much as 300 points on the DJIA to harvest there. I, personally, would love another small ‘UP’ draft tomorrow that I can trade.
Now that I got my ‘wish’ I’ve taken my ‘short position’ but so far it’s looking corrective so I guess today may yet turn out to be ‘yesterday’. 2 days in a row of sub 50 points gain is quite torturous.
Now where are those ‘joss sticks’ and my prayer mat?
Ha! That’s a lot better now.
Hello, I have been lurking here for awhile, had a few comments too. I wanted to invite you all to check out my new blog about swing trading…
https://stormchaser80.wordpress.com
Thanks!!
Oil helping to drive stocks higher this week. I feel this rally will carry on for the rest of this month and wrong foot many bears before the markets turn back down. Momentum has returned to the bulls. S&P 2000+ quite possible…great shorting opportunity that would be!
I just counted the chickens and sure enough they multiplying like rabbits
Uh, Oh!! Your are slipping Peter_. Was flying ‘straight’ draining the blood from your head? 🙂
A query re RSI divergences please folks.
http://screencast.com/t/nZ2la5ip
This is gold weekly.
I grasp that an RSI making higher lows in a falling market is a bullish divergence.
But the recent RSI spike, at a time of a lower high, is that also a bullish divergence?
I’m thinking probably yes, but also that maybe it is signalling way overbought.
Just trying to avoid buying my junior miners/explorers at a short-term peak, as I am now subscribed to Exploration Insights.
Thanks.
In the matter of subscription it is the remorse of every de-subscriber that they ever subscribed in the first place,
That’s a matter of opinion Peter_.
Brent Cook is simply a top rate geologist identifying companies in a risky field.
But, we pays our money, we takes our chances.
Each to their own.
Nay just ask them – they know what things are worth – that’s why they be de-subscriptionists nay? Anyone he/she who has purity of heart is either free of charge or dead already, The latter more likely, except for very very rare cases now, like Sir John Hampson ( no royalty affliction required).
Well, I consider myself honest, and at considerable cost to myself, I shared my views on the world (and assets) with clients a few years back. Cost me tens of thousands in lost business (many investors hate to hear bad times are a’coming).
But I retained most clients, and I sleep with a clear conscience. But I charge of course, I’m in business. All of my clients will de-client when I retire, hopefuuly with their living standards enhanced by my views. They pays their money….
GM, I presume you mean a lower high than last Feb for example? If so, I wouldn’t view the recent spike as a bullish divergence – it doesn’t work like that in my book at least. The rise has been parabolic, so a fairly deep retrace will occur in my opinion. Have a look at some of the fibs, the RSI is also uncommonly high rightnow. It smells of panic buying to me – so many people watching gold and getting sucked in. I wouldn’t start buying until the RSI at least tests the levels that have seen a reaction before. I am short GLD atm, but just being objective as can be. I am not saying we can see higher prices short term but the parabolic rises have a habit of crashing back down in my experience….
Good luck though, 72% of my pensions in gold miners and theyhave enjoyed some heavy gains recently….:)
J
Thanks. I am short gold also, and underwater but holding, I expect the parabola to crash back down, hope so, so I can get my little miners sorted. Been a good year so far for HUI/GDX, but much more to come in the next 20 years, I’ll be holding tight, selling only to meet retirement expenses (I hope).
Cheers.
Good man, stay strong
That was was Jeggerspart cos I have no brujah for wishywashy as far as my golden holden be involved see. Yah
GM; Andrew Cardwell has a unique perspective on the RSI. I don’t think one needs his course or anything so excuse the sales pitch.
eclectic, thanks. Tough video to watch, so I did some googling, think I grasp his *edge* with RSI.
He was making some bad calls in this piece I read though:
http://sureshgundappa.blogspot.co.uk/2012/12/using-rsi-to-find-great-trades.html
“That was was Jeggerspart cos I have no brujah for wishywashy as far as my golden holden be involved see. Yah”
Can anybody translate?
J
FWIW, I opened an initial long position on QQQ with a tight stop. Possible bull flag in play and OPEX may provide some updraft. I am expecting a pull back in GDX over the coming days and these have had an inverse correlation for a while – so let’s see what happens……
J
HUI approaching Fib & lateral resistance:
https://www.tradingview.com/x/MemYpoqc/
May 2015 ES top, and downtrend line:
http://screencast.com/t/vcemD2DvPEtf
The very same line:
http://screencast.com/t/anL2hnM5
But will it hold, or will its resistance prove futile?
GM, my take on your chart is as follows:
a 3 waver (a) down to the late August lows
a 3 waver (b) up to the early Nov highs
and a 5 waver (c) down to the early Feb lows
That’s the signature for a FLAT in EW terms. Now if that is ALL the correction we can expect from the May highs then the resistance will prove futile. However unlike impulse waves corrective waves can be more complex. i.e. they may have more than ONE sub wave in them, separated by ‘X’ waves. Soooo….the answer is that if this holds then we may be in for a multi wave correction. In any case we are at a critical juncture as you’ve high lighted and so we’ll know soon enough.
I suspect resistance will not hold purvez, and seasonals into end of March/early April will take markets higher, and hence gold lower. That would not be a bad result for me. Tick tock.
The main thing with trading, GM, is to have a plan of action for either event. GL with your trades.
I have a question for swing traders (the vast majority here from what I can gather). Once you’ve placed your trades (along with your ‘stops’)……What the HELL do you do to pass the time, for days / weeks on end?
I’m just curious because I ‘intraday’ trade just one instrument and hence am continuously looking to enter/exit trades, I can’t imaging what you all do to pass the time.
Anyone care to respond, I’d be very appreciative because I could do with an alternative life style in my dotage. Thanks.
Hehe, reading through what I wrote….makes me sound like a ‘computer’ NERD who needs to be told to ‘GET A LIFE’!!
Anyway I’m old enough to be past caring and so the question still stands!! Looking forward to some advice.
Thx in advance.
Read the Economist and other financial news.
Or read a variety of good books that are related to the field — eg psychology.
Spend time with family.
Just my two cents.
Swing trading is something that I morphed into over a longer period. I started learning on one instrument (SPX), but I couldn’t imagine doing that now. It is rare that I have more than 35 positions running, average since December would be around 10-20. I spend quite a lot of time looking for other trade setups – and indeed this is why I went back to a day job – because trading can at times get mostly boring. Sort of 90% boredom (looking for trades, waiting/watching) and then 10% of the time elation/excitement/fear/doubt etc. Perhaps thats just me though. In terms of money-making activities, I do tend to get quite bored – whether it is working at one location/company for some time or purely trading and so on, so around 4 years ago I decided to invest my own time into changing this. Now, I trade, I am developing a business slowly on the side and doing a day job that compliments my trading very well and mostly working from my home office. It also gives me time to be a trustee of some private charities, look after my other half who hasn’t been too well over the past year or so and to spend time with family. Almost everything I do can be done from anywhere with internet and a phone signal. I still live in London though as I need good access to the city and also Geneva/Zurich etc.
So I am busier than ever, but more interested and engaged. If you are happy to sit and watch one instrument all day, there is nothing wrong with that at all – but just keep your eyes open – the world is out there!
J
Thx very much for responding John Li and Jegersmart. Both of you obviously have a big ‘family’ element and I guess that’s one of the things that this lifestyle does allow us all. Self development through reading / alternative concurrent career paths is also very rewarding.
I guess age and personal likes/dislikes also play a part in making choices.
My main reason for asking is that I am beginning to find my ‘style’ of trading quite tiring by the end of the day. Even on exceptionally ‘productive’ days I find myself exhausted by the sheer amount of concentration that I put in. I have been considering moving to a swing style of trading where I don’t necessarily need to spend every hour of the day staring at the screen. I think before I move in that direction I need to be clear what I would spend my ‘spare’ time on. At my age (60+) I’m certainly not starting another career but I have a huge amount of interest in all sorts of ‘odd ball’ things in the world. I guess what I don’t want to do is find that the time I do create by ‘swing’ trading is not just frittered away.
Of course once I stop trading completely then I’ve got a bucket list of travel destinations….but that will have to wait for 3-4 more years I guess.
Attempting to apply a Slater9 ..notice the gap is at mid 50% retracement.
http://www.screencast.com/users/prince3000/folders/Default/media/d45db7f7-8850-4915-aa06-b9beff0a6eb6
(http://www.mypivots.com/board/topic/6941/4/slate-pile-6941)
PALS and SPX price next week:
Phase: down until Thursday
Distance: neutral all week
Declination: down until Thursday
Seasonals: down until Wednesday
Planets: negative bias until April due to Jupiter opposition
10 month cycle: negative bias until April
Summary: this week and next mostly negative for PALS. If we have low prices on Wednesday may do a swing trade into next week as PALS looks better then.
Thanks, Valley, for posting these. Much appreciated. Have a great week!
Is Bo Polny the real deal
Hi all, here is a chart from my blog where I show where I think we head into early March:
https://www.tradingview.com/x/kz1JVX8L/
Here is my attempt at using the techniques demonstrated by Slater9 on the S&P:
http://www.screencast.com/users/prince3000/folders/Default/media/d45db7f7-8850-4915-aa06-b9beff0a6eb6
Background:
http://www.esignallearning.com/education/marketmaster/archive/0404/040204.aspx
Thanks guys – some contrasting views which is great
J
BoPo knows nothing more than some of the members on this blog. He was trotted out by Sinclair after being replaced by another guru. I think JS wanted to also believe and BP told him what he wanted to hear. He was never vetted properly, like in independently audited trades made in real time. He made his money as a CHIROPRACTOR: not in the market. BP accompanied him on his seminar circuit saying the lows were in at higher levels. He’s picked 5 out of the last 1 or 2 bottoms. He may have some technical insights but all in all he makes his money selling a newsletter. Anything else?
Thanks Eclectic, he sounded like a con man although generally speaking his view on something happening soon could be on the money especially when the poms leave the EU. Hard to know but owning a little physical gold wont hurt.
Also, not if the latest COT report is to be believed. A caveat is that the shares are still acting bullish. Maybe a great short at circa 1350? As always, timing is the key.
The latest from Ballinger:
Firstly, I want to get straight to the COT report which came out at 3:30 Friday afternoon while I was out of the office so I was unable to get a note out until this morning. Before I explain the significance of this report, in my analysis (which isn’t always correct, of course), I place very little emphasis on chart lines or formations like “Gravestone Doji’s” or “head-and- shoulders” tops or bottoms in the decision-making process for reasons I have documented in this publication countless times in the past. However, early in 2015, I decided to stop being a VICTIM in this mass-manipulation of (everything) gold and silver because a) it was getting depressing, b) it was costing me too much financial and emotional capital, and c) animals and humans were unsafe in my presence.
Accordingly, I had to find a way to align my trading with that of the bullion bank criminals so my trades could mirror the SEC/CFTC- sanctioned “capping jobs” and glide along undetected by the diligent eyes of the regulators. The only way I have found to accomplish such a feat was to watch the COT report and while I acknowledge that even the COT can be compromised with phony data, it has in recent months proved to be reliable, as evidenced by the enormous theft perpetrated upon the Large Specs back in October after EVERY technical analyst in the world declared that gold and silver had “broken out” as the Commercial Criminals shorted imaginary synthetic PHONY “gold” into the massive demand that propelled it to $1,192 to the order of around 16,600,000 illusory “ounces” that the regulators deem “acceptable”. What a joke. No. Not a joke. How about “What a crime!”?
End
Hi All,
It’s been three years since my book was published. iii & Money Observer journalist has done an update on my predictions entitled “The next bear market low is on 22 May” which some of you may find interesting:
http://www.iii.co.uk/news-opinion/richard-beddard/next-bear-market-low-22-may
Regards,
Kerry
Thanks, Kerry. 2018 ultra bull is in line with “Super Boom” of Jeffrey Hirsch and Stock Traders Almanac. He asserts that bull markets are driven buy new technology and last a decade or more and market rises 100s of percent. Please share your ideas about shorter term timing (specific rules if possible) as that is my main area of study and would enjoy a comparison of ideas and results.
Also, 2018 super bull may be made up of new companies/startups that don’t exist today or that will rise in price and gradually be added to main indexes, while older co’s that are mature will gradually be replaced.
HI Valley,
Are you on twitter? If so, please follow me @17_6yrstockcyc (or search kerry balenthiran) and then I will send you a private message with my email address so that we can discuss this offline.
Thanks,
Kerry
Free world of course Kerry, but poor show to pop in to plug your book, and then suggest to valley to discuss matters privately.
If we all did that, what sort of blog would it be.
A dead one.
Meh.
That ‘ultra bull’ could happen, 100,000 Dow a possibility valley.
But it won’t be because of boom times, rather the slow, the speedy collapse of the US dollar by 2035. Armstrong got their first, Kerry riding his coat-tails, a dubious position.
Agreed the dollar as a nominal marker of value could lose half of its value vis a vis some other such as gold, a new currency, etc. However, if the Dow increases 400% from 2018 to 2028 (with addition of new growth stocks and deletion of previous ones) and the dollar loses 50% of its value it still means that the Dow has increased by 200%, no?
GM, this blog was a much better place before you turned up with your sniping and criticism of others. There were many more participants sharing weird and wonderful ideas that often came to nothing, but people were open minded. Now there are only a handful of posters, this blog is pretty much dead already. I remember a snipe at my low turn date of 29th September 2015. Is it any wonder I want to take this offline.
If you’re afraid of debate (criticism if you like), that’s fair enough.
Much like Mark and others (1998 chap). Wrong.
The internet has become very sensitive hasn’t it?
Kerry’s (of course) allowed to lurk, and chat offline, if he’s afraid of people disagreeing with his view, or worse, spotting that his ‘dates’ are flaky Armstrong rip-offs.
All part and parcel of the feminisation of men everywhere, afraid of truth, afraid of debate, afraid of being shown to be wrong. Afraid of everything. Hardly men at all.
(BTW 24th August 2015 was the turn date, the date you mention was just a secondary higher low).
“Armstrong got their first, Kerry riding his coat-tails, a dubious position.”
“..spotting that his ‘dates’ are flaky Armstrong rip-offs.”
I am not afraid of this type of “debate”, I dislike it, and you. Enough said.
(BTW I did very well from “just” a secondary higher low.)
Kerry, I’ve been around this blog for a while and I have to admit that there has been no one during that time (to my knowledge) that has wanted to take ‘conversation’ off line. Particularly conversation that related to the current market’s projections.
Valley has said MANY times before that he only posts on this blog, so for you to attempt to start a ‘private’ conversation with him seems somewhat futile/’dubious’.
Hi Purvez,
If Valley doesn’t want to then that is fine, I have no problem with that. I have met a number of new friends on blog sites and having their email address means that people with a similar shared interest to me are no longer tied to a specific site and we have also met up in real life. Nothing dubious about that, although it may not interest Valley.
ATB,
Kerry
Different bourses that share long term chart patterns occasionally show correlated chart confirmations of probable short term market direction/changes. Where uncertainty exists for a particular short term chart the consensus take is invariably the correct choice. So just take the blinkers off and look around once in a while.
Currently there are channels in play but also a wave B in play (abc – bullish). The B-waves have been turned by the channels on more than one chart. The turn is the b of the abc. Within this b there is a smaller abc bearish. The a and b of this bearish abc appear complete and so the next move should be the smaller c (down). After that the channel should be broken by a bullish move to complete the B wave. Now this is when and where the next Big wave of this big Bear arrives and it should be here in 5 to 10 trading days, probably 8.
This could fit with your PALS there Valley, not?
PALS suggests weakness this week that will continue into following week, and then strength following. Your wave work suggests a small down move, followed by up move, followed by large down move. I will trade PALS with an eye on your thesis. Thanks.
I am looking for 104-106 on QQQ, at that point I will probably look to short…..fwiw.
imho
J
GLD down over 2%, GDX looks to probably gap down on open at this stage….
J
I doubt Kerry needs the publicity,
he was featured in an III article last week
and from memory his outlook has been highlighted in the IC previously.
With the greatest respect to SOLARCYCLES there are very few
people left posting here.
He linked that very article Phil.
Apparently he made 6% (including divis) last year trading the FTSE using his dates.
Enough said.
Apparently he predicted the bull market in commodities would end in 2015 (according to that article).
http://www.bloomberg.com/quote/BCOM:IND
Well, only 4 years out.
People like Bo Polny, Kerry, Armstrong are ten-a-penny, supposed gurus, mystics, using cycle predictions as if they’re something new or magical.
It’s all BS, designed to get you to buy their books/reports, and John H’s approach, and that of posters here is more rigorous and honest. And we all share our views openly. I tend to debate views I disagree with (i.e. Gold manipulation memes) and call out the hucksters. They dislike it of course.
I doubt he’ll like me more for saying that, but the truth hurts, especially for sensitive girl-men like Kerry.
If being polite, courteous and having manners makes me a girl then I’ll take the compliment. It seems like you have a problem with women as well as markets. No wonder you’re so angry.
‘polite, courteous and having manners’
They all mean the same thing Kerry.
Indeed, feminism, political correctness, equality, all the ingredients of cultural marxism do make me angry, as they destroy Western civilisation.
So run away like a girl.
Take your 2015 commodity bull market top with you on the way.
Just a brief update…
I’ve taken off a few select stocks (long), and have hedged (more than hedged, actually) the remaining longs….
I am hoping to see higher prices – where I’ll be selling more – but for right now, I’m at 10% net short…
And another thing… Gold is down almost $20 here, and DUST is barely higher… Like I said, it has my attention…
Not sure what to make of that, but it has my attention… The charts of almost EVERY gold stock looks negative right now, and yet……
I closed my gold 3x short ETF trade today for a loss (10% on the trade, 1.7% of the account). Gold just doesn’t want to weaken, even as the stock market rallies, so best get out on a day when its price is down, and sterling weakness helps a USD-priced ETF.
I’d love to see the miners take a chunky correction, but maybe they and gold have another leg up first? Or never come back again? Don’t know.
“Girl-man”… GM, you’re killing me…
I can’t stop chuckling…. 🙂
It’s weird Barry. Kerry follows me on Twitter (and I him), but he seems to have taken umbrage at a comment from last September, and my comment today. I don’t know, I enjoy people criticising my view and a robust debate, and I’ve flipped my view as a result sometimes.
Is it me, as dear old Terry Wogan used to say (no Terry, it’s the way the world is going).
Isn’t Armstrong’s Cycle 17.2 years?
Not sure geno, but what’s 4 months between……whatever they are.
I appreciate and like Kerry’s input and don’t find anything wrong w/ what he did. This blog has been limited in resources since John’s limited availability which is understandable. in my opinion, with should be a site filled with ideas from different vantage points, not shout downs and name calling. sounds like the republican debates.
this is why Peggy and her spiral updates disappeared from this site along with a host of other valuable contributors
I think Peggy stopped posting because Sean (who is trying to build a business out of his thing) is typical of the Bo Polnys of the world, no other reason.
From a website google will lead you to (angel.co):
‘However, we seek to upgrade the current software to a subscriber based cloud application available to a broader market of retail and institutional traders who would be able to utilize our proprietary trading algorithms to enhance their investment returns.’
https://twitter.com/mjmateer
One only has to look at the last dozen or so tweets, and you quickly see that it’s all over the place, classic Armstrong-style revisionism. So frequently wrong as to be pointless.
If you think that sort of thing is valuable, good luck to you.
There are contributors and there are readers. I see fewer people contributing but then again the markets haven’t really gone anywhere for some time, so investors probably don’t have much to talk about?
I share trades and sometimes reasons for taking them, but in reality there is no need to reply to those – they can either be looked at or not – maybe sometimes someone find them useful.
My comment on Kerry or whoever he is – is that every person is wrong, every system is wrong quite regularly. I may incorporate certain themes into my overall view of the market – but remember the first part of this paragraph – no one is going to be able to tell you what to do and how to make money. As humans we are very drawn to this which is why people can sell subscriptions like this. I would recommend not subscribing to anyone who is not teaching you how to do something for yourself…..
J
Well said, J….
And don’t forget…. Nicolas is on vacation too… 🙂
a couple of interesting charts, perspectives. i do believe this is a bear market rally and right up against 1950ish resistance. amazing to see how excited commentators are saying that oil is soarring and the reason market also soaring. oil has severe damage and under $40 few companies can cover debt.
btw, gm, i utilize many perspectives, including yours. not just spiral. when i see a confluence of information about direction from proven contributors that make sense to me, i trade it.
found this on trading view today
Joe Dinapoli wrote in his book from 1998 on page 85 : “If we get a monthly Double RePo sell on the Dow-0.13% or in the S&P1.36% , say good-bye to stocks!”
This happened two times after his words and as you can imagine brought him much fame and he also needed to answer a lot of questions, too 😉
The DRPO is defined as a close below, above and below the 3×3 after a good amount of thrust has happened in a market. The last part is VERY VERY Important as “Thrust” is something that cannot be measured so good by computers and thats why this pattern has worked, is working, and should continue to work for some time to come!
Joe defines the Thrust as “a minimum of 8 but better 15 candles of thrusting market action”
Well, as you see we had plenty of this since 2009/2011 and here we are again today.
Since 21 days we have a CONFIRMED double RePo sell on this chart, on the monthly DOW-0.13% and on the monthly DAX!
I made this post on Twitter0.55% on 2nd February https://twitter.com/xSheltemx/status/694661865553686528 but boy, even I would have not thought it would go so fast …
The chart should speak for itself, I will post another chart where I show the invalid point of this Double RePo on a daily basis, as I expect the area to get tested before the real fall to 1600 starts .
https://www.tradingview.com/chart/SPX500/iEiLfG7c-Why-it-was-clear-that-stocks-fall-and-why-this-is-only-the-begin/
https://www.tradingview.com/chart/SPX500/tdGhGy4h-Here-is-the-DRPO-fail-shown-in-detail/
Scott, interesting information.
What does ‘above and below the 3×3’ mean please? What is a ‘3×3’?
Thanks.
I’m going to try this ‘swing’ trading lark. I’ve just taken a ‘teeeny weeeny’ short position on the DJIA AT 16660.
I’m going to stop myself from taking a profit after about 60 points. My ‘medium’ term view is that the DJIA will re-visit the early Feb lows or go below. That’s like a 1000+ points below where we are today. So this particular trade I’m just going to leave alone unless it goes above 16660 by about 40 points. That’s my exit point (massive for me).
However I can’t promise that I won’t make separate intraday trades in the mean time.
Let’s see how all this pans out.
To Kerry,
I find your work very interesting. I only post on this blog as I believe JH has the right combination of technical skills, fundamental analysis, and Lunar/Solar cycles to have a winning long term strategy. I would appreciate it if you would post here as I believe you are one to something with your cycles work as shown by your 6% return last year. Seems like we are working on the same set of cycles and comparison our our strategies can be useful. I will visit your blog as well to see what you are posting there. Thank you for sharing your research.
Hi Valley,
I like the work of Stan Harley if his next call is right we will see a new bottom around March 4
But he big one he expects on May 10 this year.
Do you also still think we will head lower from here?
I also see a bottom around March 4 as next week has post apogee and post equatorial declination to South and Jupiter opposition and 10 month cycle weak month of March. After March I have a bullish bias for at least two months.
Thanks Valley. JH got me interested in lunar trading when he was EggBeanGame on iii and I have the utmost respect for him as a trader and analyst (a rare combination).
I won’t be frequenting this blog anymore, so I wish you well.
Agree, Valley.
I used to contribute more in the past before the comments began to be heavily infested with day trade ideas and jargon. I personally believe this trading fetish has gotten out of hand over the last several yrs on social media. I’d love to see some violent volatility over the next several years in order to expose the grand majority as professional coin flippers.
Can’t believe u guys brought up Po Bony or whatever the eff that scumbag’s name is. The precious metals realm seems to be particularly infested with these conman hacks. It seems every year one of these creeps comes out of the woodwork claiming to have insider or other secretive knowledge about immediate impending events.
The gold bugs quote Jim Sinclair while Sinclair’s company has gone from $10/share to under .50/share and has ZERO proved reserves! Yeah, that’s someone to listen to.
Tanzanian Royalty Exploration Corp.
Valley & Purvez – We are entering a period of weakness again (the period of strength ended today). Which means prices should be below 1945 before the next strength cycle begins.
Agree with you, Geno. Tho’ I am expecting a bump Thursday and Friday before continuing down into next week. So far, so good, with 3 put options that expire Friday, which I plan to sell one by one until we reach below 1900.
geno, good to see you are still around. Yes from a purely EW perspective I think we’ve just completed an Expanded Flat from the 20 Jan lows on the DJIA. That also looks to me like a 4th wave from the early Nov highs. My only concern is that the ‘guideline’ of alternation is not met because the wave from mid Nov low to mid Dec (wave 2 on my count) also looks like a Flat.
However IF this is the 4th wave completing then I think we’ll get a drop all the way to the August lows or just lower. That will then complete a larger 4th wave (also a Flat) from the May highs as Alphahorn has been suggesting.
In any case weakness, as you say, until we get towards the August lows.
Sorry geno, did you mean 1945 or 1845?
Gold looks to be in a wave 4 triangle – burning off the daily overbought conditions. USD/NOK seems like a good short trade targeting 7.70
Jospeh Teofilo said:
“I used to contribute more in the past before the comments began to be heavily infested with day trade ideas and jargon. I personally believe this trading fetish has gotten out of hand over the last several yrs on social media. I’d love to see some violent volatility over the next several years in order to expose the grand majority as professional coin flippers.”
I am a bit confused by this, and somewhat saddened. As some have pointed out, there are relatively few contributors now – if we don’t do it, who will – and this site becomes a static page? What would you or anyone gain from that?
I am not really sure how to respond to your second point, where you basically hope that some lose a lot of money/get hurt being active in the markets? Is this some sort of joke? If not a joke, why would you even think something like this? Did your wife leave you for a “professional coinflipper”? That was a joke by the way, but in my experience the vast majority would not wish ill on someone else especially if that/those persons are not hurting you….? So please explain (if you can)…..
J
“you basically hope that some lose a lot of money/get hurt being active in the markets”
That is correct. The market is an income distribution center where a few take from the many.
I’ve been habitually ridiculed for buying discounted precious metals etfs and gold/silver miners, for several years now. I’m ridiculed by those who think Facebook is unstoppable. How is Facebook really that different from AOL? The main difference is data mining/analytics has exploded since then so the amount of differentiation that can be exploited through marketing analytics is much higher, but AOL could’ve been just as useful today if it had remained popular. I’m ridiculed by those investing in companies with zero organic growth, only growth is fueled by financial acrobatics.
I’ve said most of this in past. There isn’t much more to say really. I’m at that stage now where I’m just sitting (and hoping to maintain my sanity in the meantime).
In summary, let’s try to keep this blog going without too much blood and tears being spilled. If not for ourselves, perhaps out of respect we could do it for John H? I guess it would be nice on his return to see even some “coinflippers” (that have not been buried yet in accordance with Joseph’s fantasies) let alone others who would like to share something vaguely useful?
Good luck all.
J
My coin flipping business has kept me clothed and fed quite well. Perhaps I have a ‘bent coin’. I’ll go check.
Does anyone subscribe to realvisiontv.com and if so is it worth it. Also how much notice should be given to Raoul Pal. Seems very genuine.
Loading up short (Aussie). Target around 4400
Don’t subscribe, have seen a couple of video interviews.
If you’re already in gold/miners and read widely, not worth spending money on IMO.
Just a load of *gurus*. Most here know what lies ahead.
Here’s my ‘big picture’ view from last May highs on the DJIA.
http://postimg.org/image/sdayl74xl/
One of my favourite reading haunts are the postings by Jeffrey Snider of Alhambra Partners. His view on world ‘financing’ has been both fascinating and highly educational in shaping my thinking about currencies, banking and finance. Since returning from my jaunts I have been trying to catch up with his quite prodigious output. Today I read a couple of pieces of his from about a month back which provide a historical perspective which I believe deserve a wider audience. Here’s the link to the first. The second is a continuation of the first and is linked there.
http://www.alhambrapartners.com/2016/01/18/we-know-how-this-ends/
For those who’ve not read Mr Snider before, I have to warn you that he is not an ‘easy’ read, although well worth struggling through. The other thing to note, to help you understand the pieces better, is that he differentiates between the US Dollar as a currency and the “dollar” as he calls it. The latter is simply banks across the world issuing credit in US Dollar terms but based on them not ‘actually’ having any currency dollars. Just their own balance sheets. Hence there is currently in this world (according to Mr Snider) way way way more credit floating around in ‘dollar’ terms than there is hard US Currency. Hence any need to start paying in hard US Currency would lead to a DRASTIC shortage of the stuff and drive it sky high. I do hope I have summarised this properly and adequately for you all to be able to follow these 2 pieces.
Here’s a description of Mr Bernanke and his career path by Jeffrey Snider of Alhambra Partners, which I believe is at a minimum ‘chuckle’ worthy, although I had huge ‘guffaws’.
===========
Ben Bernanke has shown a singular capacity from his entire time as Chairman of the Federal Reserve, one that he has clearly held onto and even nurtured in the nearly two years since he left office. Unlike many other notable economists, Bernanke still has the ability to astound, to produce an uneven marvel at how the man ever got so far. The only pathway which could possibly lead to his career is one where ceteris paribus and academia so unfortunately transformed into real world capacity.
====
In fairness to Mr Bernanke and Mr Snider here is the link to the article for the remainder:
http://www.alhambrapartners.com/2016/01/19/this-man-used-to-price-systemic-risk/
I had said for many many months that the USD is on the verge of an historic collapse after this one last gasp sucked in all those that it could.
I have also been a avid subscriber to Jeff Kerm for many years and have a fond kbowledge of his system, suffice to say we are potentially on the verge of getting a buy pattern in the very term price patterns tlhat has never ever been given before.
IF and I say IF because it can be avoided, but IF it is given gold stocks will begin a rise that will last for many years to come in a bull market that will probably make the dot com bubble look anemic
Allan, please may I request that you spend some time looking at Mr Snider’s ‘view point’ before you decide that the USD is on a down slide. Like our host, John H, he has continued to ‘fly’ in the face of market ‘direction’ to state that the USD is about to explode higher.
I know you agree with John H’s point of view and that may well be because you already have a bias of your own but an ‘open’ mind here may prove beneficial.
Of course as always I wish you and ALL here the VERY BEST in your trades.
purvev, mate your response is like you are offended or something because I have an opinion based upon my research and what I have learned over the years?
I have studied the USD with an open mind as with all sectors and both the behaviour of the USD and gold on a long term basis have solidified my decision that USD is topping and on te verge of a collapse.
How about you study a very long tern chart of the dollar and study very closely the lower lows and highs since topping in the mid 80’s and then think about the global circumstances at to WHY and HOW this has occurred!
I can tell you right now that it is my opinion, that it is of no coincidence that Jeff Kerns’ SKI system is setting up for a potential once in a lifetime never ever before given signal and that Aussie gold stocks, THE BEST leading indicator bar NONE, which I have said until I am blue in the fricken face BTW, are telling us all that we need to know!
You don’t wanna believe it, that is your choice but do NOT expect me to be an apologist because I am massively bearish on a dollar which is the most overbought and overcrowded trade in history.
Allan, wasn’t offended at all. Just felt that there was an alternative point of view that you may not have considered in detail. However it would appear that you have and therefore your opinion is valid.
Sorry if I offended you.
We disagree Allan, as you know.
I don’t see how you think the USD collapses before the Euro goes through the mill, then the Yen, Sterling, and many more.
It’s the prettiest horse in the glue factory, but the euro dollar squeeze guarantees a bid.
We will shortly see the USD index rise well over 110 IMO.
Valley says:
February 22, 2016 at 3:34 am
“PALS suggests weakness this week that will continue into following week, and then strength following. Your wave work suggests a small down move, followed by up move, followed by large down move. I will trade PALS with an eye on your thesis. Thanks.”
Said ”thesis” negated by Monday gap up, the gap filling attempt agrees with PALS weakness. Charts pointing to the big B-wave concluding. If so, the bear now returns upon the planet for the big C.
(any +ve economic data is bringing weakness to markets)
Thanks for sharing your thesis with the room.
You share valued info. One day maybe I will arrive in a corner of that vicinity. Feeling my way, Long ways to go.
I’m going to assume that Joseph isn’t talking about the majority of “us” as the ones ~infesting~ the site, specifically with “day trading” ideas…
I certainly don’t day-trade, but I do build/adjust positions regularly as the market prices and volatility gyrate… Not sure how you’d be profitable in this current marketplace if you ~didn’t~ do that….
And I spend too much time reading, charting, and recording indicator readings, EVERY evening, to think of what I do as “coin-flipping”…
And there are a LOT of different trading ideas brought to the site, and while I certainly don’t understand how some of them work – if they even DO work – there are a few others that whenever I’m on the same side as them, I generally feel better about my own positions…
Anyway, I’m giving the benefit of the doubt to Joseph, and assuming he’s been ridiculed by people who are more typical buy and holders, or those that think the market ONLY goes up, and if it doesn’t, it ALWAYS comes back…. I’m kinda tired of those people as well, but I’m sure they’re about to learn their lessons on this soon enough as well…
But I don’t think many of those people really would be attracted to this site anyway…
So, after all that, still a little confused why the bitterness brought to the site, Joseph, but to each their own… I suppose that if my entire investment portfolio consisted of “buying discounted precious metals etfs and gold/silver miners, for several years now”, that one would be resentful of other’s successes, particularly watching “crap” soar due to financial engineering, while watching those go down…..and down…..and down… At least in US dollar terms…..
But why do that?
I’m sure that this will eventually pay off for you, and maybe very soon, but seriously, at what cost over the years?
I made 67% last year, and am currently up 16.4% so far this year… And I could STILL liquidate every position I have, in about 3 minutes, AND buy all the positions you’ve been holding, in another 3 minutes.. And we’d be just the same…. WITHOUT the draw-downs… Or bitterness…
Anyway, we move on… GL, sir…
blue pill or the red pill. Demark been pretty accurate
The S&P 500 is three trading days from reaching “trend exhaustion,” according to infamous technical analyst Tom DeMark. “The foundation of the ongoing rally is suspect,” warns DeMark, noting that if the market closes below these key levels in the next three days, DeMark warns “the decline is going to be sharp.”
As Bloomberg reports, a top in the S&P 500 would also be confirmed should the S&P 500 finish below 1,926.82 on Tuesday, or close less than 1,917 on Wednesday or Thursday, DeMark said.
If any of those S&P 500 triggers occur, the benchmark index will decline at least 8.2 percent from Monday’s close to 1,786, a level last seen in February 2014, according to DeMark. Should the market top correspond with what he referred to as “bad news,” the S&P 500 could see deeper selling down to 1,736, an 11 percent decline. DeMark sees the ongoing market rally as temporary relief as investors exit short positions.
“We’ve seen some pretty vicious short-covering come in, which has caused the market to move up,” said DeMark. “When that happens, it really plays havoc with the market once the downside move begins.”
“The foundation of the ongoing rally is suspect,” DeMark, based in Scottsdale, Arizona, said in a phone interview. “The temporary buying produces a price vacuum beneath the market and accelerates the subsequent decline. The decline is going to be sharp.”
* * *
A handful of chart-based calls by DeMark have looked prescient in recent weeks, including a prediction on Feb. 11 that oil would rally and a Jan. 20 forecast for a temporary bottom in the S&P 500. And traders pay close attention to the levels he suggests.
Thanks Scott Nice
Thanks for this 🙂
Jegersmart, are you still looking for SPX 2000?
I think we will see 2000 by next Friday. I think we will see below 1900 by this Friday. If 1900 is reached I will fully invest to long side with 2000 as target.
I can see one of 1900 or 2000 happening, but hard to see both.
Why not 1900 this week, and then a three to four day rally next week (100 points is only 5.5%)
Spooky, as I flicked into investing.com to see where ES was after reading these comments it was at 1900.00. Bang on.
I guess I might stand corrected then. It is just that a 5% week is rare.
Hi Valley what made you change your mind for next week we will drop first today and tommorow make a higher low and go up next week?
Feel like next week will have rally especially Tuesday and Wednesday. So, for this to happen price needed to fall a bit this week.
I am about 50/50 at the moment, I went long QQQ the other day as shared here and whilst I saw 2.8% gain at the peak on that I got stopped at 1.3% profit (I am keeping things tight right now) – the QQQ’s then dropped to that gap again yesterday and I went long again as I tend to do near support even though my confidence in the broader market is less strong. Some of the reasoning behind the long is that I feel GLD/GDX is very overextended right now and if those fail to carry on with their parabolic rise of late I think we could see a rally elsewhere as money rotates. A little weak reasoning perhaps? Yeah maybe, but the inverse correlation between GLD and say SPX has been evident recently, and as we are near support in QQQ for example, the R/R probabilities in my own view means I would not chase GLD and/or short SPX/QQQ right now. If we did see high 1900’s or sort of 106-107 on QQQ I would start to layer some shorts personally.
Not much help I guess, but there are no certainties here – just some musings and reasoning for my own positioning.
HTH
J
Just for transparency, I stepped aside on the QQQ long, I have some individual equity longs (US), short GLD and GDX and of course my Corn long position….ffs….
J
My ‘big picture’ chart that I posted earlier called for a drop from 16660ish for the DJIA on 22nd Feb all the way to the August lows and I expected that wave to be an impulse wave.
However the action does not look impulsive enough to me and therefore it is possible that wave (iv) in that chart may be morphing into a more ‘complex’ wave. If that’s the case then we could certainly see the Monday highs being taken out.
Since I had taken a test ‘swing’ trade around 16660 and with my changed view point I’m going to close that out. I made nearly 300 points in essentially 2.5 days which is of course much better than my day trading activity. I’m wondering though whether this is just beginner’s luck. I’ll try another one of these swing trades once I feel I have a clear entry point in either direction.
As a matter of interest I had continued with my day trading activity as normal and over the last 2 days I had made 163 points. I haven’t attempted any trades today, as yet.
Looks like we bounced off support on SPX, have gone long one tranche here with a tightish stop.
J
Purvez, remember to also work on your entries and stops when trying a new style – from memory you had a 40 point stop which is tiny for swing trades generally speaking. If 40 points is a lot, use a smaller size.
imho
J
I hear you J. My ‘test’ was with play money and yes I could (should?) have had a bigger stop but because of the way I work my entry a bigger stop ‘where?’ becomes the question. As it is I just put my stop at ’round number resistance’ i.e. 16700.
Right now I count 5 or 3 waves on a 5 minute chart and AFTER the first 5 minute bar starting the ‘counter’ move I take a position with a stop above/below that first 5 minute ‘counter’ bar. In my 2 ‘brain cellar’ that makes eminent sense. Either the 5/3 waver is going to stick or it’s going to extend.
I guess for ‘swing’ trading maybe the answer is to increase the time frame to either hourly or daily. That way hopefully I can still follow my ‘entry logic’ but have sensible sized stops.
Anyone fancy a short on Johnson and Johnson after they have been fined 72mill usd just now for causing ovarian cancer with their talcum powder and shoer products? Hundreds more cases pending apparently……
J
Just got done flipping my coin, and it told me to cover my one big short hedge…
So just went back to about 12% net long the US stock market… Obviously, not a high confidence position, but a number of things are lining up for me so there we are…
Again, either you follow your systems, or you don’t, and trying to be better about following my systems…
To those not interested in anything I do, sorry to add to the “infestation”…
Hi Barry
Yep, just scouting another long on the Q’s have avoided catching too many knives today – but its still early:)
J
Hi J;
I hear ya… Feel like we’re in a correction down, within a correction up, in what is a slowly starting bear market down, and LOTS of cross-currents going on right now…
But there seems to me to be enough support (charts, HY bonds, indicators) for the “bull” case right now, and of course the thought of being long makes me sick, so I’m confident the next tradeable move – to me – is up…
Haha, yes – had a couple of false starts today – took a 0.4% loss on a Q’s long early today but hourly divergence RSI/MACD got me in the Q’s again just earlier. I concur with your view atm.
Good luck to all
J
I will be a buyer US equities Wednesday at 1900 levels. 5% upside next 6 trading days, imho.
SPX already hit 1900. I assume you bought? I am net long too.
Yes, I bought. Waiting on next week. Don’t like this early rally tho’ so will look to go fully long if we reach 1900 again before Friday close.
Hi Valley,
So you think 1900 will be the bottom tommorow or Friday
After that it’s up next week direction 2000 and later on down again making new lows?
John, I think we will touch 2000 sometime in next 7 trading days. How it plays out is not clear, could be early rally or sell off and then rally next week. So, I am avoiding being short until at least next Wednesday.
Thanks Valley.
Okay, I didn’t see a 300 point rally off the lows coming here in the Dow today, but I’ll take it!!
Boo-yahhhhhh!
I’m now short again after that ridiculous rally today based on nothing as usual. Closed out shorts as we dropped today so a good day overall. I dont think we will get through 1950 and I expect heavy selling to commence next week or maybe as soon as tomorrow to take us to the August lows. Stoploss at 16600.
Hi Krish
What do you mean “based on nothing”? There was major support, buyers stepped in and now we will see where we go from here. From my perspective having added to QQQ I will now see if we can breach those recent highs around 103.5 and 104.5. Stops are in so no big deal either way. I am certainly not shorting at this point as we were very oversold…..but good luck!
J
As a fellow reader of Randy Phinney, I’m in the same camp as you jeger, although all in cash at the moment. I suspect a decent rally in ES and broad markets, and a decent retrace in gold and its miners.
Seems a lot of buyers are waiting for the miners to dip to grab positions ahead of a (likely) renewed bull market.
I will go for miners, maybe a little bit of shorting the ES if 2000 is hit. Trading causes me stress as I’m often out, and can only trade UK hours.
Miners should be a long-term hold, and impressed with Brent Cook’s services so far in the junior sector.
Good luck everyone.
Yes my pensions and other longer term investments have done very well being almost 70% in GDX/GLD type funds…..but that is all for the long term…..am also short GLD/GDX and have been feeling a bit squeezed….:D Lets see what the next few sessions bring…..
J
Jeger, I’m with Krish here. I just don’t see ‘MAJOR SUPPORT’ (at least for the DJIA) from it’s bounce point to give a 300 point rally. Perhaps the Qs are different. I don’t follow them at all.
Yes, I am referring to the ETF’s SPY and QQQ.
Cheers
J
My readers were ready for another leg higher. Check out my count: https://stormchaser80.wordpress.com/
Storm, which US state do you live in?
I really appreciate your work and will read your blog with interest.
I am in the intermountain west. Thanks so much, hope you visit my blog and comment there often!
2020 by Mar 1?? Dang, dude, that’s a chunk… I’ll be impressed if we hit it though,and probably VERY short by then, so hope we get there!!
2000 within next 7 trading days, though 2020 would be nice =)
Yeah, its a W2 though, has to retrace Dec-mid Feb. Went up 7.17% in 7 trading days beginning Feb 11th. I would think this leg up matches it. Also want to see a kiss of the 200dma.
Forgot to mention a thanks for your visit. Hope you visit my blog and comment there often!
Thanks it looks very nice stormchaser let’s see if I can do something with it on the DAX and AEX
I will follow your blog
Hi Jegers;
You earlier asked about opinions of JNJ, and I wanted to have a look at the chart before I made any comments.. (and if anyone knows an easy way of how i can publish a chart (html/png/jpg) saved on my computer, PLEASE let me know)
Regardless, an RSI indicator i pay attention to has it in the middle of the range,so no extremes there.. As well, I see a little weakness in MFI, as the stock goes modestly higher these past few weeks, but nothing of serious consequence..
It might be a trade, but not enough indicators on one side of the boat to make it an attractive short ~for me~ at this point…
And if I learn how to post a chart, I’ll post the chart so you can see what I’m referring to…
Barry, here is what I do to post a chart which is on my computer:.
1. go to : http://postimage.org/
2. At the top it defaults to ‘Computer’ for uploading from but if on Web then choose computer.
3. Choose the upload button and browse to where the chart is and upload.
4. Once uploaded it gives a number of different urls for the uploaded chart. I copy the first one and then post that as a link in my comment.
The thing I like about them is that they don’t insist on registration etc. Of course they attach ads but because your chart is at the top, most times you are not even aware that there are ads.
Hope that helps.
HI Barry
My bad, I hadn’t even looked at the charts at that point – and even if I had this is purely interest due to JNJ having known already back in the 80’s that some of their products were carcinogenic and whilst I am no legal expert wonder if this opens a very bad can of worms indeed? Looking at the chart though, the stock seems weirdly volatile over the past few months for such a big stock – often 5-6% on a daily basis…….unless my price feed has errors…..?
I am not touching it for now, but thanks!
J
Earlier we were discussing how to keep this site relevant whilst John is recuperating. I have a thought on that and hence a request too.
John’s previous post marked ‘Latest stock market charts’ had a bunch of charts showing the position at the end of 2015. Most of those charts as far as I can tell were created using StockCharts.com. I was hoping that anyone here with a StockCharts subscritpion would like to attempt to recreate those (some) so that we can get a more up to date picture. Any volunteers, please?
Pump pump pump. Keep on going central banks. Entered my shorts a bit too early but will be holding on for a medium term trade.
Krish, if you are short US equities, think again. We are entering March (historically one of best months of the year), election cycle decision week (super Tuesday), well below 200 DMA (snap back possible).
That is what I say when I get my entry wrong…..haha.
The stops are in profit on my Q’s longs, so will just let them ride.
J
It is worth noting the GSR almost reached 82 today. Such levels have been associated with long term turning points for the precious metals.
I just added to GDX short position, there are some pretty massive divergencies on daily timeframes.
J
and GLD as well. To be clear, I am bullish long term but am a bit underwater and this looks ready to take a well-deserved snap back…..probably…..
J
https://solarcycles.net/portfolio/latest-stock-market-charts/
Update(2016-02-26)
Update(2016-02-26)
Chien-Jen you are AMAZING!!! THANK YOU VERY VERY MUCH for providing these charts. It is MUCH MUCH MORE than I was ‘hoping’ for.
Looking at them it is clear that what John H. was saying in terms of TREND has continued….although I do get the impression that we may be coming up to an intermediate term bottom soon.
THANK YOU ONCE AGAIN.
^+++++^
Hey Jegers (and big thanks to Purvez!)
Here is a link to a chart of JNJ… It’s my default template that I use to do a quick 5-second look at a series of stocks each evening… If it looks interesting (vast majority do not) then it goes to further investigation… If it does not, then it’s on to the next chart for another 5-second look-see…
I think the chart is self-explanatory, but as mentioned, it’s really ~not~ interesting to me from either side at the moment…
Now, lets see if this chart thingy works… 🙂
http://postimg.org/image/jco7rh5n7/
Chien Jen, do you a chart update on OAS Margin overlay? When you posted the long term one in the past, spreads widening and margin contracting was a solid signal for very bad trouble ahead.
SP500 vs OAS
OAS: RSI, 12-EMA, 26-EMA, Volatility, MACD,Signal,Histogram.
Thanks Barry – if I was to touch it it wouldn’t be a technical trade – but I need to do some digging around what is going on with the possibility of hundreds of other cases that are apparently pending against them.
I am looking at a candlestick chart – the volatility has been stunning for such a large cap no? (Unless there is something wrong with the feed)
http://postimg.org/image/pkiprgmkx/
J
Wow,that’s quite a stunning chart…
I’ve got a thought on this,and probably am quite wrong, but I’ll bet there are quite a few large-cap stocks that probably have the same pattern… (if you did this template on every DOW stock, it could probably confirm or reject this thought)
Anyway, my thought is that the majority of BIG traders are just as confused as the rest of us right now… And the biggest stocks are easy to get into, and out of, in size, in a hurry…
So when their outlooks change, they trade those stocks as a proxy for their less liquid stocks…
And like me!, perhaps their outlooks change almost daily… :-O
Anyway, it’s my theory… Because yeah, if these were normal times, we really shouldn’t see that kind of volatility in a “widow and orphan” type of stock…
Not that there really ARE any of those left, to be sure….
Then again, the market’s going higher today, I’m net long, and i’m losing money today, so you see ~my~ mad skills…. :-O
Jegers, yeah, after looking at your chart, and comparing it to your data, i think there IS something wrong with your data feed… The daily ranges just aren’t that wide…
Please double-check me with another source, but yeah, i think you’ve got a data issue…
GL, man…
Should have said it looks like the issue started about a month ago…
The prior data looks clean… GL
Gold either goes up here or goes down: http://fxpro.ctrader.com/c/8GKJn
This signal triggered this January and it looks like it will trigger again for February.
(Also triggered jan15 and then failed feb15)
http://www.dailywealth.com/1414/turn-10-000-into-2-million-with-my-simple-gold-strategy
Interesting… And it makes sense…
Thanks for the link..
People we owe a HUGE DEBT OF GRATITUDE to Chien Jen for updating John H’s charts for us. I do hope you all will ‘voice’ your ‘thanks’ in that respect. He never talks but always provides some amazing charts…..sadly some of them go over my ‘2 brain cells’. I’ll try to concentrate harder next time he posts.
THANK YOU AGAIN Chien Jen.
Early WARNING!! The DJIA looks like it completed a ‘b’ wave of an expanded flat from yesterday’s late night high.
So long as 16650 doesn’t get violated we should be heading down towards 16350 in the short term.
Sorry did I say ‘expanded’….that is patently not true, although everything else stands.
Well its blown through 16650 so where does that leave us? More upside ahead?
Sorry Krish, I closed shop soon after writing that one. I got stopped out too.
This morning it is already over 16800 and whilst it’s looking like topping, once you get this level of momentum then you have to give it a lot of leeway. We are already at 1970 on the S&P so Valley’s 2000 or Storm’s 2020 don’t look unreasonable here. However the market never makes it that easy so I’m expecting some sort of a wrinkle to appear and throw things off track.
regarding ‘swing’ trades. IF I’d held on from yesterday I would be 10 points away from my ‘starting’ position. That is quite different to where I took my profits.
So like in ‘property buying’ you have to look at ‘location, location, location’…… in trading you have to look at ‘timing, timing, timing’. I guess.
Anyone found a ‘SIMPLE’ formula for timing please?
In a flurry of activity, I’ve been adding shorts for the past few minutes…
Currently at 35% net short, if anyone cares…
#howtolosemoneyquickly
demark has doubled down on his call that a selloff is imminent. think a top over the next 1-2 days before 1789 on spx.
http://www.marketwatch.com/story/why-tom-demark-is-predicting-an-ugly-fall-for-the-sp-500-in-march-2016-02-25?siteid=rss&rss=1
for those of you who follow spiral, peggy posted a bottom at es 1886 and targeted an immediate move to es 1939 and 3 additional higher targets up to es 1968. mid march is the target next low 1868
Yes, the falls will come imho. Let’s see where the current bounce takes us first.
J
es spiral 1968 target hit overnight. according to peggy down trend may have started but potential 1979 before pullback to neckline mid march.
PALS next week SPX:
Phase: positive
Distance: neutral Friday, negative Monday to Wednesday
Declination: negative Monday to Thursday
Seasonals: positive
Planets: slightly negative next month
10 month cycle: negative next month
Summary: PALS is very good tomorrow and flips mixed next week. However, due to tendency of price to touch 200 DMA which would be 2020, and elections buzz with Super Tuesday this week, I am bullish next week.
Thanks, Valley.
Hmmm………QQQ/SPY etc up, GLD up as well…..what gives?:)
J
The wave marked (iv) in this chart :
http://postimg.org/image/sdayl74xl/
I’ve blown up in the following chart and updated it. It shows my current detail count. One point to note (not shown) is that point Y got to 50% retracement of the wave from early Nov to Jan 20th which is as far as a wave (iv) from the bigger chart can logically go before it’s no longer sensible to call it a wave (iv).
http://postimg.org/image/5gazc7zdd/
The conclusion that I draw from this is that provided point Y holds (16845ish) then we are still headed down to the August lows or just a bit lower.
What a disservice this comments section has become to what has been one of the most interesting and unique websites. Hundreds of largely irrelevant personal trading “updates”, it sounds more like a schoolboy debating society after the teacher has left. And only three or four people left with anything new to say.
In the meantime the smoothed solar peak (the central part of John Hampson’s work) has now been backtested five times, each resulting in a huge bounce – that peak was March/April 2014 (SP500=1888).
NOVEMBER 2015: “… it [a manic phase for US stocks] will not really get going until 13-19 January 2016”. Now that that low has formed and been backested, it is very likely to hold. But an awkward change of sentiment is due on 3 March (Bradley).
Talking of Bradley, the values calculated by his long term formula from 1850 to 2040 (not just the usual turn dates) formed huge swings with their lowest low in 1931, second lowest in 2009, then 1877, 1891, 1908… all coinciding within a year or two of major market weakness. The highest swing (so far) was 1998, very close to the biggest speculative excess we’ve seen so far.
But the biggest swing is yet to come, around 2027 – making this upsurge in speculation from 2009 to 2027 the biggest ever. But there is a sizeable downswing between 2017 and 2020 (specifically 22 June 2017 and 02 December 2020, but the exact timing will be taken over by shorter term events nearer the time).
These swings typically peak at lunar standstills (a so-far unexplained connection between the outer planets and precession in our moon’s orbit), and we are now just passing the 2015 Minor Standstill and its associated panic.
With the herd now overwhelmingly convinced of the “crash now or crash very soon” scenario, a big surge is very likely. The other less likely possibility is further and increasing volatility right through until late November 2016.
Hello Mark, what a disservice you’ve done to this website (so unique as you say) to have kept so quiet for so long.
Your post today, apart from the initial vitriol, would have been welcomed a very long time ago (and appreciated by our host). It has some good stuff in it.
I am truly at a loss with readers like yourself and Joseph Teofilo who are ready to moan but will not provide any input yourselves.
You do recognise that you are on a public website with a host who is tolerant towards MOST views (not just your own)?
Mark, I’d say you’ve pretty much got all the bases covered right here:
“But there is a sizeable downswing between 2017 and 2020 (specifically 22 June 2017 and 02 December 2020, but the exact timing will be taken over by shorter term events nearer the time).
With the herd now overwhelmingly convinced of the “crash now or crash very soon” scenario, a big surge is very likely. The other less likely possibility is further and increasing volatility right through until late November 2016.”
That’s pretty awesome that you have outlined – to the DAY – moves several years away…
But ANY chance you could tell us where we’ll be next week?? Next month??
Or what you’re doing with your money TODAY?
Because any of THAT would be really helpful…
And if me telling you what I’m doing with my money, practically real-time, doesn’t help you, in any way, PLEASE ignore me…
Jegers and Purvez probably put it more diplomatically, but wow…. Just wow….
🙂 🙂 🙂 !!! Thanks for the chuckle Barry.
Actually Mark, I was about to comment about how few of us are in the “crash now” camp. No one has posted a short position in a while.
Me, yesterday before the close…
I guess that’s what Mark was referring to when he said “the herd”…
Granted, I could stand to lose a few pounds, but I’m ~hardly~ a herd… 😉
Maybe your account size is 100x ours?
🙂
Should have added, I’m not in any way in any “crash” camp…
I’m looking for lower prices ~now~, after looking for higher prices last week, and maybe a week from now I’ll be looking for higher prices again..
No idea what scenario camp Mark’s talking about if he’s referring to me, except the “Try to make a buck in the current market environment” scenario camp….
I’m in THAT camp…
Thanks Mark, much appreciated. Mind you, if everyone posted as often as you, JH wouldn’t have a blog……..? I don’t understand the anger displayed by these people…..:(
J
Since the 16845ish on the DJIA in the pre-market the action has been choppy and mainly 3 wavers (on the 5 minute charts) so I think we are forming a triangle which WILL take use above the 16845ish limit that I had set earlier. If that happens then this is an incredibly DEEP wave (iv) BUT it hasn’t broken any EW rules….other than not ‘looking right’.
So in summary it’s possible we get another high before things ‘fall apart’.
Well the action in the last few minutes has tekn the DJIA below the earlier low of 16754ish. If that’s going to continue then we are in the OPPOSITE of my earlier comment. We are in a 3rd of a 3rd wave down. And those generally are quite strong & long.
Fully invested in SPY at 195 on index. Looking for 5 points next week or 2.5%.
Valley, MUCH AS I LUUURVE reading your comments we have been on the ‘wrong’ side of each other for a while. However 3 out of 5 times you’ve been right.
So once again this bothers me. I’m expecting a small lower low on the DJIA to complete a (i) and then a deep retracement but NOTHING like 500 points.
Still I wish you well with your trades. I am usually out withing a few points (if it goes against me) so my positions are almost irrelevant to your ‘bigger picture’.
Thanks, Purvez. Your E wave prediction is appreciated.
I admire your guts to stay long in the market over the weekend I sold my calls today on the AEX and will wait and see what will happen on Monday to go long or not,what bothers me is the sharp bradley turn on Thursday (25) can not figure out if it’s a top or inversion to new highs?
Nice weekend.
All the G20 positive news coming out now…good to be long
courtesy of chris carolan …spiralcalendar.com
solunar model plus tidal charts
Thanks, Scott. Hadn’t heard of this site before. Really interesting lunar tidal charts.
my pleasure valley….just trying to keep with the spirit of the blog and share items i find interesting.
i hope those on this blog with greater knowledge regarding solar and tidal models can chime in on the accuracy of these charts.
just stumbled across this blogger looking for updates on tom demark … been pretty accurate
http://practicaltechnicalanalysis.blogspot.com/
one more chart . many of you have seen the rounded top the complex head and shoulders. if you match the far left should (1st) with the far right should (RS2) the top of the 2nd right should could be right where we are at now. 1950-1970. the right side of the chart has much more volatility and extreme moves (we are in a bear market iMO) i think it plays into Tom Demarks scenario and we see a cascade through 1800 spx neckline to hit 1756 demark target next 4 weeks. solar ecllipse and lunar eclipse in march top and bottom?
so i am not in the posters camp in thinking we get back to 2002 for for RS2. i think we are there now. spx 1950 . if we do hit 2020, great opportunity to load the truck short (another 2nd chance)
another interesting chart of the top 40 daily gains in each of the bear markets from 2000-2002 and 2007-2009
https://twitter.com/CiovaccoCapital
The 2007-2009 bear market lasted 355 trading days.
During the 355 trading-day bear market:
180 days were RED; 175 were GREEN days
http://ciovaccocapital.com/wordpress/index.php/stock-market-us/big-rallies-are-common-in-bear-markets/
Clearly, Mark is convinced that we will soon see a sharp rally, and that’s all well and good…
I can certainly see a case for that, just not seeing it ATM….
That said, I think I can see where the anger comes from, Jegers…
It must be VERY frustrating to Mark to see the “partially cock-headed” among us making money……..while at the same time “knowing” where tops and bottoms will be – to the day – years in the future…..on the way to THE top in 2027…. (I don’t even know what I’m having for lunch tomorrow, and Mark is confident the market will top in 2027?? Alrighty then…)
Anywayyyyyy, I’m pretty sure going short at 2093 was a pretty good play, eh??
But let me double-check my charts…. I make mistakes all the time, so….better check…
Hmmm… Hmmmm…. Yes, definitely happy to be partially cock-headed….
I can’t even imagine how much money those FULL cock-heads made…. 😉
=============================================
Mark says:
November 17, 2015 at 12:17 pm
SP500 rapidly regaining 2065. Who could have forseen that eh?
Judging by the deafening silence here, it seems the policy is to simply ignore anything which doesn’t fit with the “crash now or crash soon” conviction.
=============================================
Mark says:
November 19, 2015 at 12:02 pm
The partially cock-headed among you should continue to go short at 2093 (SP500).
==============================================
I don’t care whether he is more wrong than most, it is the hatred and disdain displayed that’s puzzling. In any case John H can let us know himself if we have “disserviced” his blog by keeping it alive with activity
….
J
Yeah, I agree with you, and you generally say things more tactfully than I do… 🙂
Just no idea why someone would not post for months, and then start his note with:
“What a disservice this comments section has become to what has been one of the most interesting and unique websites. Hundreds of largely irrelevant personal trading “updates”…..”
Puzzling indeed, and I presumed (some) people would be interested in my postings…
Certainly, I (for one) find postings with specific positions INFINITELY more interesting than reading what someone pontificates years ahead, but can’t figure out (or share) some approximation of where they’re putting their money today….
My weekend update is out. Come back each day as I will have something new for you!
https://stormchaser80.wordpress.com/
Peter_ says:
February 23, 2016 at 6:08 pm
“Said ”thesis” negated by Monday gap up, the gap filling attempt agrees with PALS weakness. Charts pointing to the big B-wave concluding. If so, the bear now returns upon the planet for the big C.(any +ve economic data is bringing weakness to markets)”
Disregarding the Monday gap up the mini dip and bounce is playing out.
This portends that the end of this mid-phase pull-back is near and thereby so is the resume of the big Bear and all that made it grizzly.
I plan on making money this week in spx do the following:
Monday: sell open if it is up and buy back at 1:30pm or if spx sells off by .5%, remain invested if open is down
Tuesday: sell open if it is up and buy back at 5 minutes before the close or if market sells off by 1%
Wednesday: enjoy your profits don’t sell
Thursday: sell open and move to cash.
This should yield a return of 3 % this week and avoid a draw down later in the week. Will review how this worked on Friday at close.
Timing of buys and sells is based on a variety of factors mainly weekly and daily PALS rating and this weeks US election schedule political consideration.
Valley,
Are you planing to sell the open and buy back later or wait to reach yesterdays highs.
I sold most of my position at open, kept a runner into high of day, sold it. Am looking to trade from short side if we reach 2000 on spx.
Hi Valley I have got a feeling this market is going higher at least 2000-2020 but I think 2050-2070 is also possible what are your Thoughts?
Maybe next turn wil be around March 10 our famous little planet at midpoint?
real spx forward PE likely north of 20 non gaap adjusted from accounting fraud https://twitter.com/ericbeebo/status/702869236474109953
compare 1994, 1998, 2011 bullish setups and 2000, 2007 bearish setups to 2016. great video… a little dry, but excellent content from chris ciovacco
a lot of great material i am coming across. must be the 28th. the number of money/wealth #gg33 http://davidstockmanscontracorner.com/bull-rallies-in-bear-markets/
I don’t think a contrarian view is that this is a bull rally in a bear market. Sure, if new AT highs are made then fine, but atm I think most understand that we need to watch to see where we go from here…..no?
J
When is a W format not a bottoming formation? (when it doesnt break up above the breakline)> not sure on this one yet.
http://fxpro.ctrader.com/c/c7SJn
Important Sunday update! https://stormchaser80.wordpress.com
Pump pump pump. Bulls take the lead today. Even a massively oversupplied crude oil market is rallying. Storm chaser post agrees with my thinking. I’ll start layering in shorts this week as we continue to rise.
Mark? A few months ago you seemed to think very strongly that the market being above 2065 was very important. Obviously, we haven’t been anywhere near that number for over 2 months now, and in fact over 10% lower from that number at times…
Could you please follow-up and explain how that number doesn’t matter any longer, or ??
I’m sure it would be a service to the board…
Thanks!
Just a brief update (and not sure if any care, and CLEARLY it annoys a few others), but after selling short a bit more, I’m up to 49% net short…
Looking for around 1970-ish for the next layer of shorts…
Losing money today, but the large majority of that loss is actually a short on gold stocks, via “DUST”… After looking at charts over the weekend, I still believe that’s the correct side to be on regarding gold stocks, and DUST is a bit of a hedge on the physicals and gold stocks I own, but clearly a “small win, larger loss” on my gold position today,
GL
Thanks Barry. I do care. 🙂
GL.
Thanks, Barry. Your trades are of interest.
Wow what a rally this morning. Seems people woke up this morning and thought “Lets forget the last last two months and carry on with the bull market”. Gone with small shorts on dax and ftse and hope to build if the market starts dropping.
On the DJIA, Friday’s ramp, yesterday’s drop and today’s ramp look very much like a nicely formed EW ‘flat’ wave. On the 5 minute chart I’m just waiting for a down wave and then I’ll take a short there with a stop just above that 5 minute wave.
Oops got to go…looks like it’s happening now.
Well that turned out to be ‘all of nothing’. I’m still expecting it to break down provided it stays below 16840. We’ll just have to wait and waste some time….and some money too.
Well, still long positions in QQQ, short GLD, GDX, long a handful of US equities and some March calls SPX are just coming into the money. I stated I had an ideal target of around 107 on Q’s, may start to shave some off as there is 5% or so profit on all of those (or say 18% profit on pot). It would obviously be ideal if GLD/GDX retraced hard whilst the rest kept on climbing – but suspect I won’t get that lucky. 🙂
J
1968 here on SPX… Starting the next layer of shorts….
#howtoloseevenmoremoneyquickly
And fortunately, after complaining about the lack of posts, it’s good to see Mark really step it up and add useful posts to the blog….
Oh wait…..
Oh, the disservice…….
Dax 1 day – 5 EMA & 43 SMA cross over just about to cross back up
http://fxpro.ctrader.com/c/3WWJn
My bullish “thesis” was confirmed this week into “Super Tuesday” sold long position at mid afternoon high on Tuesday. Now am changing to a bearish “thesis” but want to wait until price reaches 2000 on spx or higher before implementing it.
Congrats Valley, your calls came very good today. I’m also waiting to short as per my ramblings elsewhere. I feel we are pretty near a 50-100 point drop on the DJIA at a minimum although I’d hope for better.
Thanks, Purvez. Will watch how your short set up plays out.
Alrighty, the ~1970~ level shorts have been acquired, and holding open losses….
I was starting to wonder if we’d ever see this level again on this trade cycle, so happy we finally got up here… REALLY wanted those positions, and it’s been killing me to watch it keep banging back and forth between 1960 and 1930 these past few days…
Regardless, good job, Jegers and Valley, for holding onto my money today… 😉
I’m gettin’ it back, you know…. 🙂
Have taken about 70% of the QQQ longs off the table and the stops are in on the rest. Not much else has changed, added a scout short position on a couple of airlines.
J
A 300+ points rally on the DJIA on a day without any major news says this ‘bull’ ain’t rolling over to play dead….yet. Although the divergences on the RSI etc are now stretched to breaking point so I guess we get an overnight correction of ‘some sort’.
Well done to all those who called the ‘bullish’ tone here.
Markets do react to news but through the process of buying / selling…..today and the last few days there has been buying – there is no need for news to trigger this imho. We recently landed at or slightly overshot support and as there was no follow through buying resulted.
Let’s see what happens for the rest of the week…..
J
Big picture ES, it’s not really broken yet, the bull lives on.
https://www.tradingview.com/x/SIWGGpvO/
Close up…
https://www.tradingview.com/x/BOCPlate/
We may not quite tag 2000 before heading down to the fib/trend-line at 1789.
Eventually I think we’ll get back up to c.2100.
im not convinced the bull is intact but I agree that if we keep retracing 95% of all steep falls we can’t have a proper bear market. More of a very slow decline that will take years to play out.
Sold my last QQQ positions just now at 106, just fyi. Shorted some Glencore just now, looks like some divergences and apex of rising wedge could indicate a retrace. First target around 120p.
GLA
J
One of the sites that GM introduced to us was the following:
http://www.salientpartners.com/epsilontheory/post/2016/02/19/the-silver-age-of-the-central-banker
I would urge people here to check out the article above as well as the one following it.
If at all, you are a film buff, then it’s a double whammy….but I’ll let you find out that ‘bit’ yourself.
When I zigged IT zagged. When I zagged IT zigged!! IT being the DJIA today. I’m down 7 points and very tired BUT I HATE being down. Equally in these situations my ego just gets a bigger bruising if I try and fight any more. So I bid you all (and the DJIA) G’Evening and retire to contemplate on my navel in my dark corner.
As Jeger said, we’ll see what the rest of the week brings 🙂
This is what I’m seeing on the DJIA at the moment:
http://postimg.org/image/fw6ibdn0d/
So I’m expecting another ramp higher towards 17200 before it starts to crumble.
G’luck to All.
Raise you a wedge (mine’s bigger):
https://www.tradingview.com/x/WM4x19wf/
I like the symmetry with last year, and timing of the top would coincide with valley’s end of March thoughts. Watch out bears, squeeeeeze ahead.
Hehe GM, you boasting?
If what you are suggesting comes to pass then we could be in a LARGE choppy range for most of 2016. In fact the recent 2016 lows would then make the correction from last May a huge 3 waver ‘A’ and then your up wave would be a ‘B’ and we would then need, at a minimum, a ‘C’……although it could extend into a triangle and need a ‘D’ & ‘E’ as well.
I’d be drooling at that prospect!! I might even become a ‘swing trader’ during that period.
PALS next four days:
Phase: +
Distance: +
Declination: tomorrow far south -, then +
Seasonals: + +
Planets: – –
10 mo cycle: –
Fed Effect: ramp up, so it can ramp down into opex week’s fed meeting
Summary: March seasonals are unusually good especially when price is below Dec 31 closing price. Was expecting sell off today which didn’t show. Planets not good. So, keeping a tiny long position in SPY calls for probable continuation rally into next Tuesday price 2020. Thanks to Purvez for his transparency in sharing his experience today. Barry for taking the other side of Jegers trade. And to Jegers for being correct again.
Thanks Valley for acknowledging my little moan. It’s good to be part of a caring community 🙂
I’m just reviewing yesterday’s action and it reminds me of a ‘petulant child’ that is hell bent on breaking all the rules (EW ones in this case). No wonder I was frazzled last night. Haha.
Hi Valley,
I think the uptrend is exhausted for now and we will decline a bit into the March 10 timeframe after that it’s up again direction March 23.
Thanks, Carpe. I have opposite view, up until March 9 and then down into 23rd, yet, nice to have your opposing perspective.
Valley, does your system work with bonds/interest rates?
Thank you Valley I agree it can flip coins so still waiting in moderation what march 9 will be ?
Not tested bonds or interest rates. Doubt correlation as good as with equities.
It should be noted that I am currently wrong on GLD/GDX and Glencore:) Just for balance….
J
Jeger, it’s curious how gold and GDX is holding up into the rally in equities isn’t it?
Something has to give soon I think, either equities take a swoon, or gold does.
Today’s pre-market action has me a bit worried. Following from the wedge formation that I showed yesterday evening I was expecting the pre-market action today to start ramping higher. Since it hasn’t it may be that we are lining up for a ‘fail’ of the last wave up.
If the DJIA drops much below 16800 (it’s at 16880ish as I write) then that would make me believe that the last wave failed.
Other than the Gold short Jegers got me into – hahahaha – JK, things are “on schedule” for me…
I’m prepared for a bit higher prices, but certainly this week has been painful…
But wanted to mention something in the area of HY…
Part of my trading system use HY prices for an indicator… Obviously, they’ve been on a tear higher lately… That said, sometimes the ROC gets ~too~ high, and that usually happens several times a year… Obviously, overbought, in this case, it flashed a warning signal to me two nights ago, and and even stronger (at a level that rarely happens) warning signal last night…
That last signal – the second stronger signal – was at a level that is usually a turning point in the stock market… Doesn’t ~have~ to be, but….
FWIW…
doesn’t a puetz crash window open in the next 10 days? solar eclipse 3.8.16 lunar eclipse 3.23.16
could be a signifcant top tuesday into a nice low in the next 3 weeks. solar top / lunar bottom
looks like it: window opens around first full moon after a solar eclipse, when that full moon is also a lunar eclipse. window is 6 days before to 3 days after the full moon
Ha ha Barry – I keep reminding everyone that I am as wrong as anyone else:) Feeling squeezed today, half my Glencore longs got stopped for 3% loss, still holding the rest and ofc GLD/GDX have a firm grasp of my sack. Not painful, but firm enough to just be slightly uncomfortable:) I have some US equity longs that are nicely in profit, a couple of short airline stocks mildy under water but am net short now – even if not the indices yet.
Just shorted USO at 9.26 with 9.45 stop – looking for about 8.5 area on that one. More inventory builds, especially Gulf Coast – EIA should confirm next week. Tight stop though so a low risk (and therefore low probability of success?:)) trade.
Sitting tight mainly for now.
J
Hi Jegers;
Yes, I too think oil has about run it’s course for this rally, so shorted oil stocks (via ERY) earlier this week.. I was looking for the 34-35 (oil) area as a top, but we’re still here, so “no bueno” here (yet) for me either…
Lot of red on my run sheet today….and this week….
JH, I hope you are feeling better…
I have completely given up on shorting. This means a major peak in 1 month…I know, not much help. Tick tock. I will be fashionably late, Barry.
John, I’m hoping it means a major peak ~today~…. 🙂
Obviously no offense meant, but I’m sure you can appreciate my thought…
Markets ~have~ to squeeze shorts (to liquidate) before they can go down (and vice-versa)..
Otherwise, the ~wrong~ people have the correct positions… :-O
And professional traders don’t like that… At. All…
The only question is when is it “enough”, before the turn can be made…
I think we’re close, and maybe it’s here, but this slow, little sideways movement trading the past few hours tells me it’s ~not~ right here… *big sigh*
No offense. I completely think that a peak today is possible — it is within my one month window. I am just on the beach right now, so why ruin it…
Gold 60 minute, could be a cup and handle pattern, which would target 1320 ish.
http://screencast.com/t/nRlHo7h3
I am tempted to short FTSE a little tomorrow, but there’s a fib just below, I suspect it’s just going to test it, then resume upward, so I’ll probably sit it out, wimpishly.
wimpishly is quite often “wisely” 🙂
J
Here’s a picture from yesterday’s pre-market high on the DJIA till today. Yesterday I was complaining about the ‘back and forth’ action. Well the ‘fog’ is clearing now. I think it is one of my favourite waves to ‘hate’….a triangle.
So I think as long as (b) doesn’t get violated to the ‘top side’ then we’ll have an (e) down before the final ‘thrust’ up towards 169200.
http://postimg.org/image/6nj680pg3/
Mother of all short squeezes there Purvez, up to Dow 169,200.
Dollar collapse so soon eh? 😉
Hehe GM, I hadn’t noticed the extra zero last night. 😉
Ha! I’m all over the place here. The real number should be 17,200. Apologies.
Aaaaah Weeeeeelll!! Ce la vie. No ‘triangle’ this time round either….but I still believe that the next wave will be down….soon. It’s just running a bit late… like the railways.
Just to be clear here. Since it’s no longer a triangle I’m no longer expecting another wave higher. The next wave (provided it doesn’t go above the start of (a) will be a third wave down.
…..BUT recently ALL my prognoses have been plain WRONG!! (read that last word in TRUMP sized ‘UGE caps please).
As a bear I have thrown on the towel. There you go purvez….my words should mark a market top 😀
Well, the Q’s didn’t participate in that at all……..hmmmmm:)
J
There is always tomorrow.
My colleague bought gold with his pension money 12 months ago, then last week before Christmas through in the towel…and sold and bought some stocks.
I did say to him, perhaps you should keep that gold for a little longer….
That is such a sad story Pulp.
On both sides he will curse his timing.
If he wants to get in touch with me, I’ll turn him back to the good side.
So $USindex finale done? I think so. And the B wave in the bear done? for SMI it sure looks like it.
Start the parade down Main Street straight after tea time.
http://barestbodkins.blogspot.co.za/
Peter_, I draw my fibs from the highs last summer, means a bit more rallying ahead on the indices.
Faux pas come and go – its all a game of guesswork in the finalysis (patent pending)
But if SMI 8046.5 is broken, then I will give the bull a little grazing to fatten up a bit before letting the hungry bear return. Otherwise this is the bear in that chair in your lounge – just there.
Thanks for the end of the week chuckle Peter_.
Dax has a three day narrowing wedge: http://fxpro.ctrader.com/c/u7jJn.
More likely to break upwards(?)
Looks more like a triangle to me, certainly not a wedge quitelike the one I like to trade:)
I just went short IWM with a fairly tight stop.
J
Jegersmart, yep-corrected..triangle 🙂
Gold just rejected by a BIG OLD fib level.
http://screencast.com/t/Qa75dxot
I’m too scared to short it though!
(But will short Ftse at 6260 next week for the ride down to 5,200).
which will be followed by a rally back to 6000 as per the usual BTFD trend.
Also looks like oil has confirmed a bottom. Wont rule out a dip to $30 again but those predictions of oil in the teens are history.
Like your confidence Krish, but I suspect lower lows to come for oil in the next year or two, as the mighty (euro)dollar is squeezed ever higher versus the other currencies. Deflation in full force, until the golden emergency button is pressed by Mr Draghi in due course.
Question for the EWavers please.
From the 11th February low, how many waves back up so far for the FTSE100?
I reckon this is only the 3rd, and therefore a brief dip for 4th, and a final high for the 5th.
But EW not my forte. Nor trading, but I am starting to lick my lips if FTSE futures reach 6260.
Thanks, have a good weekend everyone.
GM, the move up is a corrective move and hence it will be in 3 parts or multiples thereof. Currently it looks like an ‘a’ upt 18th Feb, an expanded flat ‘b’ down to 24th Feb and a ‘c’ in progress which in itself should be in 5 waves. Wave (i) ended on 26th Feb with (ii) ending on 1st Mar. The action since then is debatable. One option is that (iii) & (iv) both occurred on 2nd Mar and we are now working on the (v) up.
However I personally don’t subscribe to that view as the look of (iii) is suspect and it is smaller than (i), which would then require (v) to be smaller still. I think wave (iii) is going to extend and therefore the 2nd Mar top is just a subwave [i] of (iii).
Anyway we should get to 6260 on this basis and I would be inclined to assess at that time whether all waves (i)-(v) have completed or not.
Hope this helps.
That is very helpful p, many thanks.
I don’t know, but good weekend – let’s see what next week brings – this week has not been great, first time in a while so should be welcomed….or so I tell myself lol.
J
Yes this week has been trying…at least 3 out of the 5 days. Now this is something that I never expected to say but the intrusion by the ‘non-farm payroll’ data steadied the markets. Since the pre-market high the waves have been text book. I had to keep pinching myself. Now I’m blue in a very ‘delicate spot’. ;-p Still It was worth it
I really should ‘EDIT’ what I write before hitting the ‘Post’ button. THAT sounds extremely rude. All I was referring to was my under chin….still OUCH!
LOL, please don’t edit purvez, I’d miss the giggles.
Get some creme on that ‘spot’ now.
Not quite finished yet:Dow
http://fxpro.ctrader.com/c/48jJn
Yes Pulp, 17200 still beckons although this evenings reversal from around 17060 has a 5 waver to the down side on the 5 minute chart so I’m still expecting something lower than 16945ish at a minimum, before it starts up. It may happen in overnight trade on Sunday. However the 5 waver may be signalling something a bit more ‘elongated’ than just a move below 16945.
In the words of the (in)famous Jeger, let’s see what next week brings.
PALS suggests SPX:
Monday: end day at 2000 to 2020
Tuesday: end day at 2000 to 2040
Wednesday: beginning of day at 2050, end of day at 2050
Thursday: end day at 2020
Friday: end day at 2010
Summary: maintained full position Friday at close with price of 2000. Will sell full position on Wednesday or when 2050 is achieved. Will short half position at 2050 or Wednesdays close and keep into next weekend.
Valley, thanks again for your posts. Targets are even more welcome although I’m intrigued as to how you arrive at those from the PALS system. Is this something that you are willing to share, please?
Thanks
Your are welcome, Purvez. I use PALS and then based upon its swing trade and daily component project what a likely beginning or ending price might be.
Hey Valley did you sell your longs yesterday at close?
hope John is still reviewing his blog from time to time….maybe i have had my bear goggles on too long, but this sure feels and looks like Jan 6 2009. another 2nd chance for the masses to liquidate. what globally is there to be bullish on?
global debt? NIRP ? nat gas at 16 year lows and oil at 36 still crushes oil and gas and other nations.
when markets/economies have been week, the puetz window can open up even wider than normal. the move to the 61.8 retracement and touch off the 200 ma seemed mechanical. is there a rug pull in the works? a chain reaction bankruptcy? north korea, something to trigger a black swan waterfall? now i sound desperate!
Scott, I have no idea as PALS is a short term buying and selling system. However, if I were to guess, I would guess that we have a sustained commodity rally and tame equity upward move into the November elections.
I’m conscious of the Peggy mid 1800s Mid March target, but it does seem like a sharp decline from where we are at the moment.
We are in a downtrend, would not be surprised to see mid 1800’s and more over the comign weeks and months. imho
J
My detailed updated thoughts are here: https://stormchaser80.wordpress.com/
Layme man, no slay me, no play me doo Fah. Just a layman having a lay spasm.
Doo Dah. Doos – whatever etc as detailed
I pass this info on:
http://uk.businessinsider.com/john-burbank-utimco-comments-2016-3?r=US&IR=T
http://trader-moe.com/nymo-and-the-spx-on-january-6-2009/comment-page-1/#comment-35669
Interesting comment re NYAD line, something to keep an eye on next week.
Long FTSE at 6205. Targeting 6400 this month. May coincide with new ATH’s in US indices.
Despite the short-term dip from your buy point, I reckon we’ll see ES up to 2040 sometime this week (FTSE 6,300 maybe), or maybe a spike into FOMC next week. I have a feeling that a quick nasty short squeeze at the wedge apex is *planned*, but the plunge to follow that spike would be sharp and deep.
If we get the spike, I’ll go 300% short, if not, maybe only 299% short. 😉
Good luck everyone.
Here’s an ultra-short term wave count that I’m currently following on the DJIA. The (a) on the chart is the low from the spike high after the non-farm payroll report on Friday.
http://postimg.org/image/xg5e43975/
If you ‘understand’ the chart then you will know that I’m once again looking for that ‘Elusive triangle’. So once (d) is over we should get an (e) down towards 16960ish before we get the major crank UPwards.
Of course the ‘breakdown’ point is (c).
Fair warning regulars here know my track record with the ‘Elusive triangle’.
For ‘Scarlet Pimpernel’ aficionados it should read :
We seek it here, we seek it there,
Those Frenchies seek him everywhere.
Is he in heaven? – Is he in hell?
That damned, elusive Triangle?
With all APOLOGIES to Frenchies…whoever they may be.
LOL, very funny.
You should take a trip to Bermuda, perfect for you!
🙂 🙂 Thanks GM, there are very many nicer places in the Caribbean with much lower prices and also MUCH MUCH more fun to be had.
OOOps sorry GM. I JUST ‘now’ got the Bermuda joke. (Blame my 2 brain cells).
Yes VERY FUNNY INDEED. Thanks very much for the ‘guffaw’…belated though it was.
All I can say about this market is WOW WOW WOW.
People I hope (although I didn’t mention it) that everyone realised that violation of (d) was also a ‘breadown(up?)’ point. I’ll be more careful to TRY and note ALL breakdown points in the future.
i haven’t visited in a while – kinda waiting for a new post from john
helluva bear market rally
very suprised at all the bulls here
thought most would be looking for short entry opportunities like me
oh well the gold advance has been fun
in the last gold bull run from 2001 i had 17 gold stocks taken over
the next gold bull run has begun and i already have number 1 take over
The overnight reversal in the DJIA has a clear 5 waves down on the 5 minute chart. The pre-market counter trend rally is nearing it’s end at 17020ish. May stretch to 17060 but then we’re going to have another down wave which should take us a LOT lower than the 16920 support shelf.
For GM….that sadly also means that we are not going to see the 6260 that you were hoping for. As a consolation prize you could go short from current levels of 6165ish with an initial target of 5900 and a stop above 6200.
Of course all the stuff that I was referring to for GM was for the FTSE. I really MUST EDIT!!
I am on vacation this week just relaxing whilst the other half of my glencore short runs 35% offside haha.
I added qqq short positions just now.
Gla
J
Barry – you asked me a couple of questions about the 2065 level for SP500, and also how much I’m trading with/profitability etc.
1 – I first explained 2065 being a natural high for SP500 back in late 2011, when it was still under 1365. I said then, and several times since, that there was an 80% chance of SP500 going into a bubble after breaking through 2065. More lately, I’ve said that that probability had increased to 90%, and that still remains my view. You didn’t ask for any explanation of what I was saying back then because you have been shorting repeatedly while SP500 rose from 1365 to 2065 and above, and because you couldn’t conceive that it could go that high (in the same way that you now can’t conceive that it could keep going, with interruptions, until around 2027). Yet you’re showing a very strong interest in 2065 now.
2 – I’ll post a link to my UK ISA in the hope that it will answer your questions about what I’m doing with my own money, and erase any doubts about whether I’m actually trading and investing at all. If you’re keen to check profitability, you can add up all the possible annual subscriptions I could have put into an ISA since they were introduced in 1999 and subtract that from £19,636,306.45.
https://www.dropbox.com/s/aeour69jcrwoqis/ISA%2008%20March%202016.bmp?dl=0
Mark, this could be based upon the 29.5 year cycle: 1929 peak, 1958 peak, 1987 peak. Tho’ there are many more places (emerging markets) for capital to create a bubble than in previous times. So, maybe 1/3 Intl. Including US, 1/3 Emerging, 1/3 Commodities?
Impressive.
Mark, you “wing it” when you write things quite a bit, don’t cha’??
My (almost) 89 yo mother does that too, but she’s veering towards Alzheimer’s, so ~she~ has an excuse… Takes one sentence that’s true, and makes a whole paragraph out of it, that has no resemblance to reality…..
And quite frankly, if there was an “Ignore” feature on this site, I’d have used it at this point… But alas…
Anyway, to tackle your points, first of off, I did ~not~ ask you how much you’re trading with, nor profitability…
You made that up… I won’t look at the link you sent, because A) it’s none of my business how much you trade with, B) for all anyone knows you have several accounts, with opposite positions, and show the one you want at the appropriate time, and C) I. Don’t. Care.
What I asked for, and would have been more helpful, is a simple: “I’m 80% net long across my accounts (for example), and another 20% long gold”. Or whatever, you’re doing….
And ~I~ don’t show “great interest” in 2065 now… I mentioned it because my question was to ~you~, and it seems very important to ~you~… And I asked if it was still important, now that we’ve been underneath that level for months now… Clearly, we’re NOT going into a “bubble” unless we get back above that, right??
But as of now, we’re ~not~… THAT was the basis of my question…
Secondly, I wasn’t HERE back in 2011, and had never even heard of you..
So obviously I “missed out on” your original posting, and contrary to your statement above, I have been trading long AND short for about as long as I can remember…
You have ~no idea~ what I was doing in 2011, because again, I wasn’t posting here until the last couple of years (I believe – if anyone wants to find my first post, that would quantify it for everyone)
I have been predominantly trading from the short side since I’ve been here however, because I believe that will be the more profitable side going forward, until it’s not, but I have no problem going long when circumstances dictate… Right now, big picture, just not seeing it though…
In looking back, it’s clear that ONLY trading from the long side would have been a better choice these last several years, but to claim I’ve only been shorting since 1365 is simply uninformed (the kindest word I could think of)..
Third, I can conceive of the market doing just about anything…. With a very “fluid” currency situation – worldwide – I have no doubt the stock market could be worth YUUUGE amounts….
Unfortunately, it might also take YUUUGE amounts to buy a loaf of bread at the same time as well…
I’m sure that given enough time, we’ll ALL be billionaires, and stocks will soar….
Just not so sure that makes us all wealthy… *please see Zimbabwe*
Anyway, the main point I got out of your note(s) was that,
a) 2065 was hit, therefore we’re going into a bubble for the next 10 years;
b) you have been, and still are, holding 100% long in anticipation of that, and
c) that little squiggle from 2100+ to 1800-ish is insignificant to your outlook, and not even worthy of acknowledgement….
Is all or any of that correct??
Barry, please may I request, that having said your piece (very eloquently) you let any further comment from Mark pass you by. I, for one, would not want (like) a long drawn out wrangle. There are far ‘better’ sites than this one for ‘discussions’ like that….Dan Eric’s springs to mind but I’ve recently been on a couple of others as well.
So for the sake of domestic harmony at this site and world peace, please may I request your indulgence.
Many many thanks.
Hi Purvez;
Fair point, and I’ll try…
It’s the wildly inaccurate statements about me that kindof got me going this morning…
Probably should avoid coffee too, whenever I read Marks’ posts… :-O
But appreciate your note here, and you’re right…
Kindest regards,
Barry
heh… I have the same problem with coffee. I don’t do it regularly and I’ve found that drinking coffee and perusing forums like this one don’t mix well for me. Best thing I can do after drinking coffee to to go on a long bicycle ride (2 or 3 hours) or an all day hike. I actually the like the physical boost it gives me when I’m planning something with extended physical activity. I say this with all sincerity, but I’m also finding it funny that you mentioned the coffee thing. Good trading to you!
I second that. I have learned a lot from Mark. For example, keeping with the site name “solarcycles.net”, he pointed out the the weak solar cycle 7 points to a 2/2016 market peak. This adds value as few of us look at data from 1830. Although my positions tend to mirror Barry’s, I would hate to lose other points of view in this forum, especially one with a different (much longer backwards and forward) timeframe.
I’m trying to keep my trap shut, because I just took my STFU pill, but…..
I clearly missed where he said:
“he pointed out the the weak solar cycle 7 points to a 2/2016 market peak.”
Because his other statement sounds like the opposite…. ????
A year or two ago, he posted this:
SC1 Late 16/Early 17
SC16 Sep-15
SC12 Jul-17
SC13 Nov-17
SC7 Feb-16
SC10 Jun-17
AVG Dec-16
which I thought was a good roadmap for those who believe that a weak solar cycle had a different dynamics that the recent solar cycles that was the more mainstream view. Clearly, shorting 10/2014 was a wrong move for the bears.
I will leave it to Mark to clarify why he no longer believes December 2016 will be a peak, but to be fair, I don’t think he ever did say that it would be. Rather, he was providing the turndate data, and I interpreted it differently from him.
“AVG Dec-16” — that line was mine, and not Mark. Please disregard that.
John Li, thank you for the clarification, but this post alone helps me understand why I don’t believe anyone can use solar cycles to “accurately” predict markets, and it’s a fools errand to try…
I allow that many people are smarter than myself, and maybe some can make heads or tails of that, but if I’m reading this correctly, you can pretty much read whatever you want to read into it…
Not that there aren’t many OTHER forms of analysis that do the same thing, but this is just a perfect example of solar cycles….
“I interpreted it differently from him” tells me all I need to know…
Sorry, but that’s how I see it… GL, man…
Very frustrating for sure. I thought the solar maximum was in 2012 inline with 100% of the global warming scientists who can never be wrong. Four years later is a very long wait for this crash…
“I interpreted it differently from him” —
1) JH’s view is that we have two stock crashes and then one commodity crash. Eg. 1980 Gold crash, 1990 Nikkei Crash, 2000 Dot Com crash.
Click to access trading-the-sun.pdf
Therefore, re. 2014, JH’s view from 2012 was this crash is in commodities — and we did see it in Gold and Oil. The question then is why JH thinks stocks will also crash this time around, unlike 1980.
In this sense, Mark’s view might be close to JH’s original thesis in 2012, but I can’t say if Mark’s conclusion is based on this 1-2 pattern.
2) JH added demographics and valuation to explain why stocks will also crash in 2014, which is the date on the PDF. I am inclined to agree with him here.
Thanks Barry for your forebearance. Also thanks to John Li for pointing out what Mark has and more importantly CAN contribute to this site in the future.
Even his previous post that started with the ‘disservice’ comment had a quite a few good points that were very relevant to what John H is trying to promote on this site.
Mark we very much welcome your contribution. You have NOTHING to prove to any of us but your contribution can and DOES enrich our knowledge and I would like to thank you for that.
‘People’ I try and contribute with my 2 brain cells but it’s the more ‘informed and educated’ comments from everyone else here that makes this site unique. THANKS A MILLION for that.
Now, onto the actual markets…
As many of you know, I am a big proponent of watching the HY market to help guide me in the general US stock market….
Obviously, we’ve been on a tear higher since the Feb 11th low there, but I am starting to see cracks here… Call it “loading the gun”, and the actual turn will “pull the trigger….
As well there was this comment late last week:
“Barry says: March 3, 2016 at 3:23 pm
Part of my trading system use HY prices for an indicator… Obviously, they’ve been on a tear higher lately… That said, sometimes the ROC gets ~too~ high, and that usually happens several times a year… Obviously, overbought, in this case, it flashed a warning signal to me two nights ago, and and even stronger (at a level that rarely happens) warning signal last night…
That last signal – the second stronger signal – was at a level that is usually a turning point in the stock market… Doesn’t ~have~ to be, but….”
Well, we’re ~still~ ~there~ on those readings…. Which tells me a turn down is going to trigger at any time… And if it does, it’s gonna be a good one….
I just saved a few charts that look like they are starting the “turn”, so if this works, here’s three charts to follow…
HY is one canary in the coal mine. I think volumes are another. Low volumes mean a boring market, which is “never a short”.
Specifically, SPY volume was only 80mn shares today — and I am looking for days for >160mn shares to return. I am sure that will make me fashionably late to the party, but at least I cling on to my +0.80% MTD gains for now.
There’s the old saying “never short a dull market”. Hubert Senters claims he’s looked at past data and low volume generally means that whatever trend is in place will continue. So if you’re in an uptrend on low volume, it’s likely that that uptrend will continue.
http://postimg.org/image/cuc51tznt/
http://postimg.org/image/os80j0yrv/
http://postimg.org/image/4cvrscx1x/
Barry, many thanks for those charts. I’ll look at them tomorrow morning. Right now the ‘wine’ is taking over! LOL.
Valley,
Did you go short or are you waiting for a POP.
PALS is mixed, day trading options, small size, reluctant to short below 2000.
It’s almost always amusing to see those times when someone posts a link to personal financial information in a bid to prove something.
Having said that, the only thing I will add to this particular discussion is that it seems to me that apart from the sh1t slinging surely this is a classic example of different participants having different time scales and goals? A buy and hold investor will never have much in common with traders?
I just think that we should be able to co-exist without the “disservice” comments and other time-wasting rubbish? If there really are posts that are offensive to you, just don’t read them?
Good luck all.
J
If there is a way to segregate ST trading comments from longer-term swing trades, I’m all for it.
Solar related
Puetz crash window.
Solar Eclipse 3/8
Lunar Eclipse 3/23
Crash window 6 days prior to til 3 days after a lunar eclipse that happens within 6 weeks of a solar eclipse.
Crash window is thus 3/17-3/25.
i am positioned accordingly. How about you?
Remember that crash windows are common, they happen once or twice a year, whereas crashes are very rare, happening what, once every few years? The point is that most crash windows go by without the market undergoing a crash. Good luck.
What is a crash window? Is it the start of a crash move? i.e. we can go down say a mild -3%, and then -10% in 4/2016. Or does it go down -10% between 3/17 to 3/25.
The answer gives different meaning to “positioned accordingly”
hi john
i’m 60% junior miners 40% leveraged short index etfs at least through 3/25
I wonder if that was the peak and now stocks will head down fast and hard into end of March. I’m short DAX with a small stake.
Here’s that wedge on the DJIA that I had shown earlier. It now has 5 separate touch points on the upper line and 3 on the lower, so they are very valid trend lines. I’m hoping today’s pop will take it marginally above the top line coz that would be an amazing shorting opportunity.
Oops it wasn’t there…it’s here:
http://postimg.org/image/kuan5ibep/
Sorry, Working from someone else’s computer. I accidentally spilled some drink all over mine and now it’s refusing to wake up,. Must be a ‘diva laptop’!!
The DJIA just broke below the lower line of the wedge…..and it’s having difficulty even coming from underneath to ‘kiss it goodbye’. It LOOKS like we’ve got our top but it certainly doesn’t FEEL like it. My money is on this being a fake out move, At least until we drop another 50 points on the DJIA.
Gold About To Soar?
This is a rather contrarian prediction but I think gold is now going to soar, leaving the doubters behind in the dust. I base this on a technical pattern knows as the “3-point convergence”. As a retired trader, I know how dangerous it is to predict instead of react. Just saying. 1240 must hold as that is the break point at today’s low.
The ending diagonal of $gold has been complemented by an ending diagonal for $USindex.
The bear market for equities was proclaimed by ending diagonals. Its is all playing out just as JH as shown with overwhelming reasoning. Any dip in $gold can only be transitory now.
Dax – seems to have “fast tracked” up and then “fast tracked” down, and is just below that important support line from 20th August.
http://fxpro.ctrader.com/c/jN8Jn
Been at a sporting event (spectating at the All England badminton) but placed 2/3 position short ftse via 3x etf at Ecb bounce earlier today. Will add final 3rd on bounce tomorrow or early next week, plan to hold until 5300ish on ftse.
1800 test on ES lies ahead in my opinion.
Gold top in the next 2 weeks, c. 1339.
Then everything changes for a while.
Bulls take a while to die, but selling the rips should drive equities lower over time.
Good luck all.
My healthy profit at yesterday’s ftse close mostly evaporated overnight, so took the profit this morning.
Will layer on shorts today or into Fomc next week.
One last short squeeze possible, to ES 2030?
Chien-Jen, if I’m reading the OAS signal correctly (bottom pink line), it seems there’s been very little upside movement even though the stock market has made a rather strong reversal. Is that your interpretation as well?
Is it just me or is trading difficult?
Its VERY DIFFICULT…..BUT NOT IMPOSSIBLE is my experience.
How long have you been trying to trade Pulp?
Ive been a traded shares for 20 years and moved into forex trading over the last 3 years . I was quite shook up by the drop in the bank share value in 2008 which has made me look at other investment methods.
Sounds like you are more a medium term investor rather than a trader. Trading usually has a maximum horizon of 3 months to be ‘in’ a trade. Hugely different mind sets as well as techniques / knowledge required imo.
Despite being from an accounting background I only got into the Stock Market about 10 years ago….just around 2007 Lol. My ‘baptism’ was more like napalm than ‘just a fire’. Lost a ton and have taken a looooong time to get it all back and a bit more. Now I take it one day at a time.
~Finally~ hit 2010, so layered into my next sell point this AM, and at this point am ready for a decline to start… Obviously, the market cares not one whit what I want, but just saying I’m plenty short at this point, and ready for a “Risk Off” moment in stocks, oil, and gold… 🙂
John H., is there any way an “Ignore” button could be integrated here?
I hate to keep annoying the people that I seem to annoy, so they could have an easy way to just ignore me… I mean, easier for them than just ignoring me… 😉
Thanks!
$US weakening cannot be prevented by the organising of forced selling of gold. Its just another waste of prospects for yet another future generation. The only solution remaining to parabolic debt and its foreverlasting effects is nuclear war. Just press the button – all problems will be promptly & permanently fixed. Not funny now so you just got to laugh whilst you build a shelter fwiw.
Peter_ you are early with your End of Week ‘chuckle’…..but it’s still good. Thx.
Yesterday’s fake down, break down was quite convincing. I’m sure it managed to ‘stop’ both bulls and bears out.
Today’s pop higher should reverse back towards 17000 on the DJIA before we get a final pop higher.
The weasels are now a protected species. I am glad you did not mention them alongside any final pop. Meanwhile we have bankrupt traders multiplying and dropping from their afflictions like rabid vermin. So I suppose a pop up can happen for a moment or two during the wake for them as a sort of goodbye sideshow.
Peter_ I LURVE the ‘imagery’. 🙂 🙂 Thx
I just read up on weasel protection status in the UK…..and they are NOT protected. Apparently they are ONE of the MOST resilient rodents around. Colonies do die out in ‘bad years’ but they are soon taken over by healthy ones.
Sounds a bit like Banksters. LOL.
Its one small step for a bankster, but its a giant leap for a weasel.
We need Nicolas to come back from vacation…pleeaase?
Huh!!??? You want higher highs, John Li? Or is he your ‘contrarian’ indicator?
He is my indicator…but I agree with your view. Historically peaks come late in March or early April.
Egg on my face. Well, I guess that’s why I don’t trade any more. And good riddance to that past life! I’m sure a ton of shorts were added today. Unbelievable: to me at least.
PALS next week SPX:
Phase: – all week
Distance: neutral
Declination: + all week
Seasonals: + + all week
Planet angles: –
10 Mo cycle: –
Summary: Mixed week PALS, price is at 200 d ma so not oversold or overbought technically. Will day trade this week with small size.
Big changes coming, see how we did this week! https://stormchaser80.wordpress.com/
Hi Storm, enjoy reading your site, good call on Thursday’s post for rally Friday. You were correct about size of rally.
Thanks Valley!
I added to QQQ short positions and opened initial IWM shorts.
Good luck next week.
J
This market still looks very resistant I think it still has more legs up till March 23.
The bradley made a turn on March 10 and the next is March 25.. we will see what is in the cards..
Agree, Carpe. March 23 may be short term high. Target of 2100 by March 23, if target is reached will move to cash.
Maybe not seen this link but I think it is interesting:
http://www.financialsense.com/contributors/tom-mcclellan/oscillator-bullish-signal#.VuSSYQgeBT0.twitter
Chien-Jen,
Can’t get too bearish until unemployment claims move higher…
EW Question:
Can a three wave correction end in a triangle, as the third wave? I’m asking about the gold correction in the Nov-Dec time period, 2015. Some analysts have labeled it as such showing
the current upmove began on Dec 30th.
I can’t recall ever reading about this in the older, traditional literature, so maybe it’s a neowave concept? Valid or not? Thank you.
eclectic, as far as my knowledge goes, nothing can ‘end’ in a triangle. It is the penultimate wave in both impulse and corrective waves. i.e. occurs in position 4 or B.
updated post https://stormchaser80.wordpress.com/
I see Peggy has moved the goalposts again on Twitter.
Was calling for mid 1800s (ES) at the start of March, now calling for mid 1900s imminently.
However, to be fair, the prediction that the real downside won’t start until early April chimes with valley’s seasonal expectations, which are proving to be prescient, good job valley.
I’m sat on my hands til tomorrow, may short any FOMC spike, and looking at the Nov/Dec 2015 patterns repeating which could see a few weeks of chop/volatility starting now.
March 23, Lunar eclipse would be 7 weeks since low of feb 11. 7 months since flash crash low of 8/24 and just over 7 years since 3/9/2009 low. having fun w/ 7s with the ides of march aligning with the puetz crash window.
Another fabulous day for the bulls. I am now short all indices. This is a make or break situation for the bears in the short term.
Tks purvez. I thought the same.
Seems to me that the only ones buying equities are the buyback merchants….let’s see how long they can keep this up….:)
J
Moe reckons a big triangle forming, could take a few months to resolve.
http://trader-moe.com/big-right-shoulder-triangle-likely-forming-on-es-daily/
Dip to 1930s, back up to 2040-50s, down to 1800, that’s a plan for next few weeks. ES.
Good to see gold dipping in the short-term.
GM: “Good to see gold dipping in the short-term.”
This.
😀
J
Quite some squeeze these past few weeks jeger, but it had to end at some point.
Do you have any downside targets in the short/medium term?
Anyone else have a short-term/medium-term view on gold they might like to share?
Some see one final washout low, I’m not so sure, but I do see sub $1100 at some point again.
For anyone interested, I’m about to sell my home, and move into a rental home for a good few years, maybe permanently for the years I remain in the UK.
The sale proceeds will be invested carefully and moved swiftly overseas into a Swiss vault. No prizes for guessing the asset into which funds will be flowing….
The old times are ending, the time to make final preparations is running short, and being nimble in the years ahead is key.
GM: “Anyone else have a short-term/medium-term view on gold they might like to share?”
I’m no gold follower but from an EW perspective this bounce has run it’s course. However it is just wave ‘(A)’ within an (A)(B)(C) correction. It ‘may’ go a tad higher (mid 1300s) but then a reversal towards your sub 1100 before heading up higher. Those are decent ‘moves’ to trade though.
My wife would probably send me to the mental institution (no office to those inside) if I suggested selling the house and converting it into gold. @GM do you do persuasive block bookings.
Hey GM
on GLD around 114, on GDX around 17.25-17.5 or so – all v imho ofc:)
I sold my last property around 9 years ago, haven’t decided where I will go next!
J
House vs Home:
We are now in our 3rd property. Each property gave us approximately a 300% profit. We started with a house worth just under 30K. (Hope your multiplication abilities have survived your school education).
I’m trying to get my better half to understand that the incredible ‘run’ we’ve had cannot continue. Unfortunately the 3rd one is the one she turned from a ‘house’ into a ‘home’. Now I can’t get her to think of it as a ‘house’ any more. Aaah well it’s a good thing that we’ll have paid it off in a few months. Also, it’s a good thing, I’m getting quite fond of the view over the landscaped garden that she’s created.
For most in the UK, with property, our wealth is tied up in our property. I can see my net worth deteriorating by about two thirds in the next few years but I’m hoping the re-bound will be substantial. Although there is the possibility that ‘other’ assets may take over where property used to be.
Me, with my ‘hard hat on’ I’d sell and stay where I am but rent the place. That way I get my ‘view’ AND let someone else take the ‘equity risk’.
Anyone here got any ‘advice’ on how to handle ‘better halves’ in this situation please?
I don’t think you’ll see anything like 2/3 off property prices purvez, even in London.
Maybe a 30% dip, but then prices will creep back up, as a (poor) inflation hedge.
Tricky with regard to your better half, but stick it all in gold, wait a few years, then you can have 2 houses, one in London, one in the sun, and a decent stash still in the vault.
OK GM, you’ve got the ‘job’ of convincing her. Your fee…20% of whatever it is that I ‘save’ if you can get her to sell!!
I do however think you are wrong on the property prices dip. The 2007-2009 dip showed how quickly things can turn ugly. I know they didn’t ‘stay ugly’ for long but they did get ugly!!
I know a bloke who bought 2 properties in Central London…just off Marylebone Road. They were comprised of 4 flats each. He paid £8K for each property. Each of those is worth upwards of £2M now…..and yet at the time he said no one wanted to touch those. Now THAT is investing when ‘blood is running in the streets’ or whatever that bloke said.
Pretty good if he bought them in 2003, not so good if he bought them in 1734! haha
J
J, he bought them in early 2008. We used to laugh about him selling when they got to £100K but to his credit he didn’t waver. I’ve lost touch with him now but I’m fairly certain he has got ‘rid’ of them by now….at least I hope he has. Sometimes ‘your BEST trade’ you want to hang on to.
since the site has lost quite a bit substance recently, thought i would add northman trader’s update from monday in case there is anyone who hasn’t seen it.
http://northmantrader.com/2016/03/12/nifty-fifty/
Someone asked about an EW gold count. I don’t agree with the author’s long term count; but I think his intermediate view is valid.
http://imageshack.com/i/pmhrCuNwj
Thanks eclectic.
So, where do you think that ‘5’ gets down to in late 2016, and what comes after that please?
Separately, was it you that mentioned 17 miners being taken over in the last bull?
Any chance you’d fancy sharing some names in your current portfolio please?
I can share one or two names I have been watching too…..Claude, and Richmont mines.
Re houses for gold, it’s a tough call for most, who view their homes as somewhere they live, rather than an investment. If that’s the case, fine I suppose.
Most have no idea that a repeat of the 70s lies ahead (on steroids), and how their lives will never be the same again. Staying in the UK is likely to be a terrible option, but likewise Japan, and eventually America…..totalitarianism and war are headed our way, plus a permanent bursting of the bubble and resultant depression in large parts of the world. We’re FUBAR.
http://chinamatters.blogspot.co.uk/2016/03/a-revolution-in-strategy-us-shifts-to.html
Dax – Increased probability of hitting 9800 or 9600 based on the pitchforks: hihttp://fxpro.ctrader.com/c/cWqJn
Alternatively : Jerry’s Dragon setup??

http://fxpro.ctrader.com/c/NzqJn
Or is this a Jerry’s Dragon set-up?

http://fxpro.ctrader.com/c/NzqJn
Update on the DAX pitchfork:
http://fxpro.ctrader.com/c/CNsJn
Thanks all.
GM, the article you reference does echo my own thoughts but also reminds me of the countless times over the past half a dozen or more decades where “justification”, imagined or otherwise has paved the way for criminal activity by governments.
On a similar but tangential note, my thinking for the last 20 years or so has been that the world’s population consists of approximately 90% retards. Sounds arrogant right? I don’t mean it like that, I don’t think I am better than anyone which leads me to my next point – and I think I should have changed the word “retard” to “zombie” – I was young when I started this…:) When I watch the current presidential debates and electoral process in the US for example (it is on most channels often) – my attention is not drawn to the politicians, but rather the crowd. I believe we are all equals until proven otherwise, and I find myself not at all understanding ANY of the people at these rallies/debates. The politician in question says something meaningless, and these people scream, applaud, get on their feet – but the most scary thing is the look in their eyes. They look at the human up on the podium making some noise with their mouth and are enthralled, and are certainly NOT thinking……which is what reminds me of zombies. People are sleepwalking their way into continuation of the current systems, wars, and lies. And they pray before them as if to a deity – when in reality the dumpy lady, the follicly bird-nested “tycoon” are just human beings, with more shortcomings than most. Politicians have proved time and time and time again that they do not possess the know-how to solve problems. All they do is overspend, pander to their supporters and the majority loves it. Then they protest against austerity. Maybe “zombie” is not the right word after all……but I am sure in excess of 90% of people I have come across are one of these……
For what its worth, I think you are doing the right thing GM. The 90% are on auto-pilot to grow up not thinking, reproduce, slave away to pay off debts before they die. They do not question, they just accept. They accept that it is right for us to kill ISIS but it is not right for them to kill non-ISIS people. They accept that they have to buy a home for 5 times their gross annual earnings that they spend 25 years paying off, they accept that one can only have £1M in a pension, they accept bank bailouts, bank bail-ins, privatisation of industries that affect them negatively but benefit only corporations and their share holders, they accept the horrendous waste of resources used in wars, conflicts, weapons of mass destruction, ships that can destroy the world from their home harbour, they accept the corrupted democratic process which has been failing the taxpayer for decades, they go to election debates and go postal with rapture when a politician tells another lie.
To quote Clive Owen in one of the Bourne trilogy films, and in reference to our current institutions/system:
“Do you get the headaches? Look at what they make you give…..”
J
🙂 🙂 J. What caused this soap box oratory? Delightful as it was.
Not sure P, I hope it didn’t offend up to 10% of the people here 😉
J
Jeger, you’ve summarised the perpetual issue humanity must deal with.
We are not all equal, and those with certain *prowess* will rise to power and milk everyone else, in some guise or other, until it all collapses, and the cycle repeats over and over and over.
I feel blessed to have realised the game at hand, and able to prepare as best I can for the latest troubled cycle, which promises to be a humdinger, marxism enjoys spilling blood and creating havoc whilst destroying society.
Where to hide? That article re China rules out most of the East of the world, maybe South America somewhere? Not really ideal.
Oil flying again. Got greedy and waited for a bigger drop. Brent should now rise towards $44 adding more tailwind for stocks.
Must be someone needing to offload some more of those 170k contracts of USO they picked up last week or week before. I must stress that really, I am not at all bullish on oil. Remember that even if production instantly fell to 1 million bpd consumption bias today, it would take 9 months just to burn off most of the stocks we already have that we can see….I would be very careful with longs for the time being……
imho
J
p.s. I am neither long or short oil / spreads/ options in any fashion currently.
Good eye GM. FWIW, I NEVER believed there were 5 waves down from August 2011. If you look at daily chars from that time period (LMBA prices and fixes) the initial move down was comprised of only 3 waves: not 5 as this author suggests. Author suggests 1190 for completion of wave b, then possibly 1350 for completion of wave c. It is from there that we part company. I view the entire move down from August, 2011 – December 2015 as a series of three (3) waves. Check out Daneric for that count, although he too is labeling the 2011-2015 as a five. Probably academic or maybe not. I certainly don’t know.
LOL, actually I confess to not having that good an eye as regards the gold chart, as EW counts confuse me greatly anyway.
I was just curious as to your view of where that ‘5’ reaches, and what comes next?
Thanks.
Can’t post Daneric’s Mar 9 update.
http://www.moneyandmarkets.com/next-mining-crash-76612?ccode=03152016MAM3465MAM&em=rcsilverngold@gmail.com&sc=&ec=
another success story for the FED. Stocks go up!!
I shorted the FTSE again at around 3.15pm, futures were around 6100 at the time.
A 1/4 position, and this time I will hold on, and add more tomorrow, as I am now positioning for the end of the bear market rally. Ftse looks lacklustre, and will be dragged down by oil’s drop back to new lows IMO.
I’m hoping for higher prices, by a smidge, in the next 2 days to get the rest of my positions loaded.
Allan and I have had a few (amicable) disagreements about the USD, I think up, Allan thinks down (over the medium term).
Longer term we agree it’s doomed.
But an interesting view that I read at the weekend could see both Alland and I proven wrong over the next year:
http://rambus1.com/2016/03/09/wednesday-report-112/
Certainly possible.
Hi GM, I think dollar will decline over next four years, commodities will rise, along with equities lead by commodity producing nations. If I had capital I would invest in these areas buy and hold. Don’t so will focus on PALS system and the SPX as I enjoy it.
Valley, why do you think the dollar will decline (I assume you mean against other currencies)?
Equities could rise in the next 4 years, but not after a significant bear market first, at least 40% down from the peak IMO.
(I changed my mind, and took small profits on my Ftse shorts, the fib at just under 6,080 is providing support at the moment, so perhaps now a bounce back to high 6100s…please).
Thanks for that GM. Appreciate your opinion.
US markets recovered all losses this year. Excellent work by Janet Yellen and Co. Poor work by me expecting January to be the market top for the year!!
Are you continuing to short as we “cannot possibly” make new ATH?
SPX now in the new year gap and closing by 2044, beyond which we transit from neverland to neverneverland where nothing is real and I am the Walrus.
Maybe climate change is preventing the markets from ever going down again…
https://weather.com/news/climate/news/record-warmest-february-global-2016
Aaah yes, hot air always rises until it meets cold air. Me thinks the ‘meeting’ is close to hand.
Also my ‘personal canary in the coal mine’ (aka the FTSE) is saying that it doesn’t want to participate in this mad cap rally. Despite the DJIA’s enormous 900 point surge the FTSE has essentially traded sideways since early March. More importantly it seems to have participated in the dips but not the ‘up side’.
….just saying.
Pima
That makes most sense out of anything I have seen over the past few days lol.
Feeling squeezed here…….:D
J
Congrats on your long call to 200SMA on SPX and to 2000-2050. I didn’t think it was possible, but now that we are here, I am looking even further up my screen.
The largest market on the planet is the illegal drugs market. And today I saw the effects of it. Or was it all a dream?
Peter_ you get better and better!! We are near the ‘end’ rather than the ‘beginning’. So have heart. Just don’t go anywhere near the illegal stuff. You’ll be ‘just fine’.
Alphahorn seems to have called this market right. Well done. Where to from here.
Exactly what I was thinking, Red Dog…
Without wishing to usurp Alphahorn, ‘where to from here’ is either a triangle with D completing about now which means an E lower before we go higher by several thousand DJIA points to complete the 5th wave.
Alternately the Feb low was the end of an ABC flat correction and we’ve already started the 5th wave higher.
My personal preference is for a triangle but the triangle count doesn’t fit too well with the S&P as C (Feb’16 low) was lower than A (Aug’15 low) which is not a valid count.
In any case some sort of minor correction which stays above the Feb low before we blast higher.
I should have ‘qualified’ my earlier reply by saying that : ‘If Alphahorn’s call is correct that we are in a 4th wave then….’.
The alternative school of thought is that we completed a ‘C’ wave of a huge Expanded Flat back in May and we are in nested 1,2s downwards. In that scenario we’ll soon get a 3rd of a 3rd Down which will prove quite devastating.
I personally am in the Alphahorn camp simply because all of the waves since last May’s high are 3 wavers and for this to be going down the ‘down’ ones needed to be 5 wavers.
Hope that bit of EW babble helps.
Plan on buying with size Friday SPY mid day at lows (if they appear), and selling on Monday at close. After Monday next week, will be cautiously bearish.
I agree Valley I think the period March 22 till 31the market is ripe for a correction.
Nice call for today Valley.
What is your view Valley for next week you write cautiously bearish?
Thanks
Two reliable negatives are 10 month cycle which bottoms on 4/7, and post Jupiter opposition which should suppress price until about the same time.
Full moon is Tuesday and I believe it is an eclipse Full moon. Next week is apogee as well. After full moon and during apogee price tends to fall. Seasonals are often down entire week post opex (next week) in March, although March into early April is bullish overall.
On the positive side: Monday is Jupiter moon conjunction which is very bullish but fades day after. Next week is declination North to Equator which sometimes has gaps mostly to the upside.
Price is extended, but it would be surprising if it just kept on to 2150 quickly which would annoy shorts or cash holders. So, cautiously bearish after Monday, just can’t be fully bearish given seasonals.
Thanks Valley for sharing your thoughts again.
If we turn down it should be between March 22 and March 31 that is what I think right now..
I f we turn monday an Tuesday with a sharp drop then we will go up March 23/24 till end off the month.
Have a nice weekend
Afternoon all.
Unlike Valley, I have sold with size this morning.
All of my ISA (c. £345m ; ) is now in a 3x short Ftse etf.
I now have a non-ISA trading vehicle, and will short a US index later today, same leverage.
A short sharp decline ahead, but no crash yet, I think 2100 ES lies ahead first int early April.
how do you have £345m in an ISA?
I have this cool program, allows me to show any ISA balance I choose on my screen. It’s not real however. In my head it is. 😉
LOL, I would never reveal my finances online, only someone with serious psychological issues would do that IMO.
hahahahaha… I can’t stop chuckling… 🙂
Donald Trump?
GM, you and Valley are not that far apart. I suspect you’ll have a ‘smallish’ draw down on your ISA. (send me the ‘spare change’ please 🙂 ) and then you both are looking for lower prices.
http://screencast.com/t/DVcfxAQxM
5 waves up, and the last fib?
I shall short the Nasdaq later.
Nasdaq spiked to just above Fib level I was watching, so bought QID, ultra-short QQQ, whatever that means?
Good luck me.
Hey GM
That would be enough to move the price significantly GM – good luck!! haha
J
I think we may head straight to 2100 before a drop with the current strength in US markets. I’m looking for the S&P to finish the year near 2100 after a 15-20% dip later this year. Central banks still have huge levels of market control and it will take a while for this to diminish. Northman Trader’s nice topping arc is starting to break with this recent rally.
Interesting chart, BTW… Just something to be aware of, and easy to change the parameters if you’d like…
http://stockcharts.com/h-sc/ui?s=%24SPX%3A%24VIX&p=D&yr=1&mn=0&dy=0&id=p12356165706
Nothing has changed since my last post several weeks ago. I continue to favor slight new all time highs. As I’ve noted previously, I viewed the fall to 1810 SPX as John’s “shakeout” phase and judging by the overwhelmingly bearish sentiment on the Internet, it surely did its part. The bear’s last stand lies ahead at the trend line off lower highs. We’ve seen a 242 point bounce off 1810 leaving it just 81 points shy of new highs; we’ve been long the entire way, as well as long precious metals and miners.https://alphahorn.files.wordpress.com/2016/03/spx-daily5.png?w=1280 My System is still solidly long for now.
Here’s the bearish count: https://alphahorn.files.wordpress.com/2016/03/spx-daily-count15.png?w=1280
You were calling for a big old triangle AH?
I still reckon that’s a good bet, up and down for many months.
Plus, it would keep purvez happy!
I dropped that at 1810 when it violated the rules for the SPX
See above my Feb 16th post, 2 charts bullish and bearish counts, no triangle.
Thanks, AH. You’ve been right as rain on this move up, despite all the static you got on this board when markets were in the low 1800s. They know who they are, lol.
Somewhere earlier in response to Red Dog I had suggested a wave count. Here it is in glorious technicolour!!
http://postimg.org/image/5fosjf7ml/
Note that W,X,Y are just ‘larger’ versions of a,b,c. Also note the wedge forming with it’s obligatory ‘throw over’.
You may need to expand the pic to see all the ‘gory (ious) detail though.
The implications is that we get a ‘FAST’ retracement to the base of the wedge i.e. X.
I see a broken wedge on the Ftse today.
I also see that not all currencies and central banks are the same:
https://www.marketnews.com/content/ecb-coene-question-if-2-inflation-goal-still-realistic-press
Must have been reading JH’s thoughts on demographics?
One day the ECB will change to 0% inflation target (they already have IMO, just don’t have a need to announce it yet and upset apple carts).
Good to see some honesty in Europe, as opposed to Yellen’s endless drivel. Poor woman.
GM, I really wish I understood your stance regarding the ECB. You keep attributing a set of ‘powers’ to them that I fail to see….and yet I know that you’ve done your homework on this and I just need to get my head around it.
I’m fairly certain that if you are correct it will have serious repercussions on my wealth. Perhaps one day the ‘penny’ will drop. (Note: I am handicapped by the number of brain cells and hence will need some more time)
You’d never hear a central banker in the UK, US, or Japan utter those words (re growth/population/inflation) because those central bankers are poodles of the government they serve (and their voters & other cronies).
The ECB is its own master, with one mandate, given to it voluntarily by all countries that join: price stability. Nothing else matters, because (I believe) the ECB knows that monetarism is a big fat myth, and all that money can do is remain stable, or collapse in a heap, it can’t produce growth or employment (but it can destroy those when debased). That is all we need our money to do, remain stable over time. Barring revolutions, watch the ECB allow markets to bring socialism to its knees, back to affordable levels.
Was that the top just now? Hope so.
Yesterday I mentioned that the FTSE was not joining in the ‘party’ with the DJIA and S&P. However it was still heading, albeit very slowly in the same direction.
Today since about 11am BST the DJIA has gained about 70 points…..and the FTSE has LOST about 60!! Does the one index know something that the other one doesn’t?
…….Just asking.
Wish I’d put my 2nd trade on the FTSE rather then QID, having just discovered that my broker (Hargreaves) adds 1.5% spread to the exchange rate to cover ‘extra costs of dealing in the US’.
Rip off Britain, roll on.
Bastards.
Their guy on the phone said ‘oh sir, but we did the deal at the interbank exchange rate for you, not the retail rate’.
So, I agreed, and asked for the 1.5% back please.
He was somewhat perplexed. Complaint lodged, for the hell of it. Grrr.
1.5% of £4,564, 566, 655.45 adds up to a lot of money you know. Do the maths.
On topic, oil has reversed hard today, has it peaked (for now)? $42 (Brent) was the bottom during the August slide, so potential for resistance here.
Now a days a magnifying glass is not enough to read the small print. You need a microscope or perhaps even an ‘electron microscope’ and even then some of it is ‘open to interpretation’!!
You just have to look at petrol prices to know how much of a RIP OFF it really is. I remember the first time petrol went over a £ a litre was when oil was over $100 per barrel. Today none of them want to drop below a £/litre in case everyone gets ‘used to the idea’….despite oil being sub $50 for a looooong time.
It comes from the populace being lulled into a ‘nanny state’ like most of the rest of the world.
Aaah so that trade wasn’t through your ISA then….that’s where you went wrong. With the ISA they have to stick with pre-agreed prices/costs.
Still at that level I would have thought you would have got a ‘better deal’ indeed. LOL.
Apparently once your balance reaches £1,388, 663, 876, 344, 398.12 in the ISA, rules prevent you from going higher, hence I’m in a non-ISA as well. Crap eh. 😉
Actually I was thinking the opposite. Your trade size was not big enough to allow Hargreaves to give you a decent discount. LOL.
I do however agree with your sentiment on the ‘limitation’ rule for ISAs.
Well have a great weekend all, a very quiet week here – let’s see what next week brings….:D
J
On the DJIA, since the 17600 touch I can see a 5 waver down on the 5 minute chart. I intend to take a ‘swing’ type trade once it get’s back up towards 17585 with a stop over today’s high around 17605.
My down side target is the X wave (around 16200) in the ‘picture’ I posted earlier. Although I’ll continue to do my ‘day trades’ I believe that this one could very well be a genuine ‘swing’ trade, worthy of the name.
I’ll keep you posted on progress.
Ok, I’m in the ‘swing’ trade at 17585. Stop at 17610…a bit further than I really feel I ought to but just allowing some wiggle room.
By the way my ‘stop’ values are only ‘hit’ once a 5 minute bar has completed. i.e. if intra-5 mins it hits then I dont’ count that. However I also have an overriding rule that during the intra-5 mins if it goes over by more than 15 points then I’m out.
Sounds confusing? Then you should see what my 2 poor brain cells are doing to try and keep up.
Ahh well that was the ‘shortest swing trade’ in history?
Tough luck, I tend to allow 1-2% for my short swings. I’m no expert trader mind.
Armstrong has next week as a panic week for the Dow.
I see lots of views aligning that a correction is at hand.
After the stomach flu, we are back upright! https://stormchaser80.wordpress.com/
JH, hope you are feeling better. Not trying to rip on you, but as we approach April, do you have an updated view? I think the solar maximum in 1920 looks interesting — and it is also a 2nd term US presidential year, with a swing high in April.
Glad you are doing better Stormchaser; thanks for the report update. Dollar bounced off of support yesterday and should continue higher next week which will bring the commodities back down and with it the market.
Much to ponder in this post.
Whilst one can’t argue with the data he presents, everything (bar sentiment) points toward complacency having returned among those doing the buying.
http://fat-pitch.blogspot.co.uk/2016/03/weekly-market-summary_19.html
Here is another article: http://www.marketoracle.co.uk/Article54421.html
and this one is for Purvez to while away the time whilst trading: http://chatwithtraders.com/podcast/
Buyback blackout seems a plausible reason for short-term weakness.
From that article:
‘If so, then VIX is taking the lead in announcing the turn in the market. Confirmation may appear as the VIX rises above 1893.00 again.’
Imagine Vix at 1893. Time to buy. 🙂
Thanks for that GM and Pulp – I am going to assume we are in a downtrend until we are not if you see what I mean. Having said, that I do not have a lot of short exposure either – just sitting on some losses on GLD and GDX shorts and some of the Glencore still. I am most probably going to watch and wait – as the R/R is not on the long side right now imho.
Good luck all ofc.
J
Solar activity looks to be on the slide:
http://www.swpc.noaa.gov/products/solar-cycle-progression
Futures update is out! https://stormchaser80.wordpress.com/
GM, Pulp, many thanks for those excellent links. Best to remain nimble here.
Watching Ftse futures on Investing.com.
It might be a bad data feed, but the index is jumping up and down by 10 points on a tick.
Weird, and causes me to suspect a whiff of panic in the air.
I am biased (short) of course!
Until the S&P gets below 1975 I feel its a buy the dip market and its working well so far. Every dip gets bought back heavily. Ultimately I am looking for the February lows to be broken in the next month or so to confirm the bear market. Any subsequent recovery above S&P 2000 for me would suggest we are in a flat market rather than a bear.
Hussman says 1975 as well — what so special about that number?
Its just a number i’ve had in mind over the last few months. Can remember where it came from but i have been neutral/bullish when above it and bearish when below it. I’m looking for oil to drop to $30 again too in the next few months. I hope all the shale oil producers have hedged production for another year on this recent rally and are ready to start pumping the crap out of their already drilled wells.
In case you are interested, this is his link
http://hussmanfunds.com/wmc/wmc160321.htm
Cheers John! I think we will break below 1975 but i reckon a drop to 2000 followed by a bounce to 2030 or so and then a break below 1975 is the likely scenario. I’ll be going with a small long around 2000.
https://www.tradingview.com/x/7PZuzalq/
Two fibs just above for Ftse, one from May 15 top, the other from 2009-15.
Close to the top.
Here is an updated magnified view of the wedge:
http://postimg.org/image/6tp8xpjf1/
that I had shown in this chart:
http://postimg.org/image/5fosjf7ml/
At around 8:30am BST today the DJIA futures touched the top of the wedge and bounced off, as you would expect the first time around. We now have to wait for them to fall back a second time and hopefully break through. Once the top of the wedge is broken I suspect we’ll end up pretty swiftly towards the start of the wedge at around 16450.
Here’s another interesting bit about what the DJIA is doing. If you draw a line connecting the May high to the Nov high and extend it you’ll find that the DJIA (including after hours) touched that one too before reversing.
Increasingly Alpha Horn’s triangle call is looking more relevant to me.
To find out where ‘E’ of the triangle may end, connect a line from the August lows to the Feb lows and extend. Of course that is just TOOO PERFECT for a triangle….particularly one that I’m endorsing, so we’ll also have to keep a look out for the ‘wrinkle’.
Well looks like attempt 2 at around 13:50 BST today also failed to penetrate the top wedge line. The more attempts the better because that sort of ‘guarantees’ that it will break at some point. So be nimble at the trend line and you’ll do ok.
hope no-one got caught by the bear trap this morning. We have seen time and time again markets sell off in the aftermath of a terrorist attack and then be rebought when investors realise the profits of volkswagen and bmw or any other company will not be affected by the attacks. Bulls still in strong control but I feel the market is losing momentum and a drop could be around the corner. I have a small speculative short but keeping stops close as the odds are against me on this trade.
The recorded preservation of this entire generation of supposedly free interaction with forever free access by future humankind is both threatened and yet but a faint hope with scant possibility. This is just something we accept and yet silently deny. Lemmings do the same (we are told).
Maybe before we start we should stop any (futile and unjustifiable) protest. We know that we are owned. Meaning that we are not free. It is evident that most of us like it like that.
God knows that the devil moves in mysterious ways (even when it is obvious to us mere mortals).. And we know that this world is increasingly unhealthy for our children and more-so for our grandchildren and if there should be any great grand children etc. I am sure others have posted similar or elsewhere.
Omens are rare. This is an Omen.
Berkshire Hathaway is one of the richest companies in the world, enjoying billions of dollars of cash on hand. Despite its longstanding success, however, the company has an unwritten yet steadfast policy against paying dividends to its shareholders. During the tenure of its current CEO, Warren Buffett, Berkshire Hathaway has only paid a dividend one time. That was in 1967, and to this day Buffett questions the decision, joking that he must have been in the bathroom when it was made. Instead of paying dividends, Berkshire Hathaway invests excess cash back into the company for research and development, expanding operations and making acquisitions. The company also engages in a generous stock buyback plan. In a Berkshire Hathaway buyback, shareholders often receive as much as 120% of market value for shares they wish to sell back to the company.
This practice was originally referred to as a Ponzi scheme, being highly respectable in its day.
Despite this present era of copious information being freely available (via internet) the general mass of the majority public remains seriously uninformed and otherwise stupid in the face of their own demise.
Peter_ why are you ‘flying straight’ tonight? I’m only referring to the Berkshire post. The former is in your very inscrutably erudite prose. I do however like the:
‘God knows that the devil moves in mysterious ways (even when it is obvious to us mere mortals)’
Very nice indeed.
People, I have to apologise about my earlier posts this morning regarding the DJIA hitting the top trend line of the wedge and bouncing off etc.
Until Krish mentioned ‘terrorist attack’ I had no clue of what had happened in Brussels. (I try and stay away from news as it makes my trading biased). However my sincere commiserations to the families of those affected and I did not mean to suggest that the drop this morning was caused by ‘market movements’ when it clearly wasn’t.
https://www.tradingview.com/x/8lrppcCq/
Will this be the 7th straight green week for the Nas100? Could be.
Longer-term, it’s headed to 2750.
Any reason for the explosive move higher in the DAX today or just general market exuberance? We are in the drop window now and markets still pushing higher…Time to abandon the shorts and wait for a better signal for me.
I suspect the market makers want every last short stop taken out before the plug is pulled.
Ftse still going sideways, and sterling sliding versus dollar is helping my QID short.
Overall on both positions I’m at breakeven still.
This from J Snider of AlHambra is a must read for anyone interested in understanding what ‘money’ is today and how it started. Very informative, even though a tad ‘dry’ to read:
http://www.alhambrapartners.com/2016/03/22/in-some-ways-it-has-always-been-forward/
Off-topic really, but lefties and statists galore in the comments section of this FT statist article. I rant a bit in the comments and try to put some lefties right. Waste of time, as Armstrong says, we’re going over the socialist cliff at full speed:
https://t.co/7RfNlsIhnh
The top line of the wedge on the DJIA that I had shown earlier, has been broken to the downside at around 17583. As I write it is at 17550ish. Ideally it should come back to ‘kiss’ the upper line from the underside before peeling away. That would provide an ‘IDEAL’ swing short set up with a large down side target and a ‘tiny’ stop point.
I closed my shorts earlier this afternoon, around 3pm.
I’m waiting for a H&S pattern to complete (on the shorter-term charts, 30 mins) as per Trader Moe’s guidelines.
It could be close at hand, or not.
My prediction : This is the top of the recovery wave we will decline into the end of March retrace and after April 18 it is all over and the panic or capitulation fase will kick in till second week of May.
surprises will be on the downside..
carpediem, thanks very much for the prediction. It would help if you explained how you came to those conclusions please.
There are a lot of indicators pointing to this time frame
an important indicator is a crash cycle that was active in August 2015 and Jan 2016 and will return in the end of April into May,
Submit your entry for event #3.. http://barestbodkins.blogspot.co.za/
Hi GM
I do take a look at Moe’s once in a while but didn’t see anything that was worthwhile in short term trading *apart* from some of the levels he talks about. Should have stayed in matey, you were right:)
J
Yes indeed, and I need to decide whether I’m swing trading or day trading I suppose.
Not mutually exclusive though.
GM, in my opinion, swing vs day trading are different in the time scales used. I trade off 5 min charts even though I constantly refer to hourly ones as well for the ‘bigger’ picture. With swing you have to have a much broader time scale and view of the market vs day trading and therefore associated stops and limits as well as position size.
So although the basic idea of putting a trade on at a ‘support’/’resistance’ point still remains the 2 types of trades in all other ‘parameters’ are very different. Most people appear to have far more success with swing than day trading. Largely because you have to condition yourself to take many more tiny losses than big wins which psychologically is very hard to do. Particularly when you can have a string of 3-4 consecutive losses in a matter of hours.
From the little you’ve mentioned I would definitely put you in the swing camp and whilst it’s ok to take profits early I usually find that markets tend to go further in either direction than one expects at swing trade points.
I’m not totally sure what ‘pearl of wisdom’ the above is supposed to impart, other than to help clarify in the trader’s mind what their trading style might be.
Thanks p.
I’ll reload pretty soon, but I think ES 2100 beckons before any sizeable decline.
This is a fascinating read:
http://www.marketanthropology.com/2016/03/the-markets-graduate-to-commodities.html
My readers were ready for the downturn, and today’s reversal! https://stormchaser80.wordpress.com/
Good info, Storm. Congrats on exceeding market return by 8% so far this year! PALS is suggesting the following:
Monday: open at 2030, close at 2010
Tuesday: open at 2015, close at 1990
Wednesday: chop at 1990 to 2000
Thursday: off to the races, up to 2100 by April 8.
This is based upon seasonals, and all the lunar, planetary angles that PALS includes.
Thanks man! I would be very surprised to see 2100 again this decade. We shall see!
As I have said several times, I am expecting a financial mania in the next 18 months. Not buy and hold (though would probably be best) but will do my best to trade it.
Valley, by ‘financial mania’ do you mean a surge upwards? Thx for the PALS update.
Yes, all financial assets until end of 2017.
Always happy when my *guess* coincides with Valley’s view.
I recall purvez mentioning that corrective moves are 5 waves, so 1 more wave to go?
https://www.tradingview.com/x/xt7loBYT/
Enjoy the Easter break, although I believe US markets are open on Monday.
5 waves up is bullish, 3 waves up is corrective but the RSI agrees with a 3 wave corrective top here. (Nonetheless the pattern can still evolve within the bearish rollover pattern, but that would due solely to CB manipulation with current data and sentiment opposing).
My take is with the synchronised head bump on daily RSI of Russell 2000 where the 50% line is now resistance instead of years of support. http://barestbodkins.blogspot.co.za/
The washy wishy Tide is eventually turning regardless.
Rules, Patterns and Characteristics, The Wave Principle Guide with Technical Analysis by Andrew Baptiste, Morgan Stanley – http://astrocycle.net/PDF/Wave_Guide.pdf
Study time, thanks.
I follow you that the market will stay under pressure till Thursday how far down is hard to say (mayby SP 1950) but I think after that it is up again till April 18.
You can spend hours simulating trades. Most auto trades don’t work. Literally nearly everything doesn’t work. RSI , bollinger, cross overs, distance away from the average, buying on Bollinger size change,martingayling up (Nick Leeson).
In this particular simulation, sell when the 50-60 Exponential Moving Average widen.
http://www.screencast.com/users/prince3000/folders/Default/media/290e044e-fb31-4b97-8269-463272c9204d
Im feeling more positive about auto trading today. Here is a Dax 1 day trade on above or below the BB-20-2 : http://www.screencast.com/users/prince3000/folders/Default/media/d5b540b1-305a-4733-b32d-b8dde34fce6b .. Its simple and effective, but you do have to have quite large stoploss of 500 pips.
Why auto trade? Is it to free up time because you spend too much time on it?
J
Nice point J – perhaps i’m wasting my time.
Why Auto-trade is a very good question. One good reason i can think of, is that it is a good test of trading methods. You may think that you have found a good way to trade, but if you test that trading mechanism over a long enough time frame and data, it puts it into question.
Well, I’ve tried not to infest the board with any more of my comments lately, but…….time to do a disservice…one….more….time…. 😉
As most know, I’ve been doing a scale-up sell strategy for the past several weeks, contrary to my actual trading system, and all it’s gotten me is a whole lot of pain…..
That said, after running all the numbers Friday, my trading system has moved to a “Sell” signal…
Which means liquidate all longs, and go 50% short… I’m already wayyyyy past that, so I’m not really changing anything, but thought a few of you would like to know that I’m officially on a system sell…
As well, HY looks likes it’s rolling back over too, and in going through LOTS of stock charts every day, the sheer number of stocks that look like GREAT sales are just astounding right now…
And believe me, if I had more money to short with, I would be…..
*Jegers, if you’re still curious about JNJ, it ~now~ looks like a great sale too*
Not saying there’s has to be a crash or anything, and certainly I really need to be better disciplined in following my own systems, but just that it looks like a great sale point right here, right now….
Wish it didn’t seem like everybody agrees with me right now (or me with them), but again, you have to trade what you see, and not what you hope or think…
GL
Barry
Another ridiculous post, do you not have any shame??? haha
Thanks Barry, always appreciated.
p.s. I am not touching JNJ……it looks way to difficult to trade from a price point of view….
J
haha I’m too old to have shame!!
I’ve been trying to “contribute, by not contributing” the past week, but the logic still escapes me…
And I thought about writing a post that would be of much more service to others…
That one would be:
“We’re OBVIOUSLY going into a bubble, therefore we’re absolutely going higher for the next 11 years…and you’re an idiot for thinking otherwise….
Unless we don’t go higher, and go lower…..or sideways….. That could happen too……
But either way, you’re an idiot, and I’m brilliant, so glad I’ve settled that for you…”
That’s what I was THINKING about writing…. And I’m sure some would have thought, “~Finally~, a useful post from that jackass…”
But I’m a weak man, Jegers,… With no shame…. *shaking head slowly side to side here*
So I wrote briefly about what the charts and indicators were telling me ~now~, instead…
Hope a few found it helpful….
Barry
Barry, I DO HOPE it goes UP, DOWN AND SIDEWAYS in small (300 DJIA point) steps. That’s where the real money is to be made….for me at least.
Hi Purvez…
Glad I could be of some useful service…
You’re ~all clear~ for 11 more years… 😉
See, Jegers… That’s how it’s done, sir….and we’ve been doing it all wrong… hehehehe
PALS:
very negative Tuesday and Wednesday. somewhat negative Thursday and Friday. Quite positive next week. Given seasonal tendency of market to rally into April, will buy full position if we reach 1975 on SPX.
Shake hands I have a target SP 1950-1975 and Friday will be the buy day..
Nice drop in the dow on open and then pumpety pump pump. Up it goes! I think a pullback to 17k dow is due soon which probably tallies with 1975 on S&P roughly. Will be closing some shorts at that level. Currently short DOW, DAX and CRUDE OIL.
Yes, I read that one wrong too. I was sitting on a nice 70+ point profit from pre-open and was expecting it to continue down. Ah well I’m glad I got out with my day’s quota because it decided to continue higher and has since been waffling within a 25 point range.
I was waaay too chicken to take the ‘ride up’. After all who knows what Yellen will be yellin’. However now that it’s nicely set up by her I’m planning to take the ride down. As I write, the DJIA is challenging 17600 with the thrust from the 25 point waffle triangle (I mentioned earlier) complete. Once I see a small red candle on the DJIA 5m chart I’ll be taking a short position.
If it goes higher then I’ll hedge until …. it gives up!!
Yeh Yellen just blew it for the Bears. Clearly she was displeased with the loss of bullish momentum in stocks so had to pump it higher. Let’s see how the market finishes this week. FED still has maximum market control as evidenced today. All my shorts will be closed today if the market holds its gains.
Serious question for Barry (and others who are willing to bear big draw downs).
Barry wrote : ” …I’ve been doing a scale-up sell strategy for the past several weeks…”
Please may I ask why, at a minimum, you don’t hedge when the position goes against you? Where’s the ‘logic’ in NOT doing so?
Is it because:
i) You don’t have a ‘stop loss’ point?
ii) You are worried you won’t know when to get rid of the hedge?
iii) Cost of trade?
iv) OR TOO MUCH MONEY?!!!
OK that last one was to ‘rile’ you into thinking….but no apology extended.
We are at a CRITICAL juncture with the DJIA. It’s currently at 17635 (as I write) but the absolute maximum (if the wave count is to hold) is 17645. OUCH!! That is close and will be a ‘test’ of whether EW holds or not.
Of course if it doesn’t hold then there is always the ‘alternative count’. …..now I just need to work out what THAT would be. LOL.
Out of my short positions apart from OIL. I did say i would wait until we got below 1975 S&P to short and I didn’t stick to it. Took a small loss but I should have been more patient! The wait continues…
Hi Purvez;
1 – when it hurts ~too~ much..
2 – Absolutely…..and neither does anyone else…
Let me know the ~exact~ turn point, and do it consistently, and I’ll have a new strategy… 🙂
LOTS of people give a price target, or a date, or BOTH, but jeez….all you have to do is track people for a while, and you realize they don’t even know they’re just guessing, based upon lots of “crap”….
And to be fair, we’re ALL just guessing….. I usually try to get the probabilities on my side too, but it’s easy to see I started the current trade too soon… I say that only because I started selling when my own system was on a “Buy”, so that was an easy mistake to avoid… They’re never “easy” at the time, but I say easy in that I could look at my spreadsheet, on a “Buy”, and I sold anyway….
Discipline is a problem for me, and I’m paying for it…..
That said, looking at the data and market ~at this point in time~, I would put on exactly the same positions I currently have… Wish I put them on today, versus building them up the past few weeks, but here we are…
The gold short is a perfect example… I noticed Money-Flow rolling over on really just about every PM stock chart I look at, and this was weeks ago…. Price just continued higher… But like I said, it’s on every single chart…. And it’s STILL going down, and has been for weeks…
RSI confirms the extreme as well….
So I’m pretty sure this is going to break, and the bigger the divergence, the bigger the break…
So I’ve been adding to DUST, as it’s been going lower (PM stocks higher)…
And, for just a few hours last week, I actually had a (tiny) profit on the entire position….
And now it’s back to getting hammered again today…
Is it a bad trade? I don’t think so…. It’s just losing money ~at the moment~….
A LOT of money at the moment… And if I didn’t own it right now, I’d be buying DUST with both hands right now… But what else WOULD you do, if you already owned the position you’d buy if you didn’t already own it…
The answer is….nothing… Just suck-it-up, and do nothing…
3 – not sure what you mean there… ????
4 – Sometimes…. And if this trade works out, I won’t even be able to be safe around myself!!
Boats and strippers for EVERYONE!!!! Make it rain!! Make it rain!! 🙂
Anyway, fair questions…. No worries…
Barry, LUUURVE your response….. Had a massive giggle. Only point I’d like to re-iterate is why don’t you ‘hedge’ when the market goes against you? To make sure your ‘understand’ when the market goes against you is when the price is ‘higher’/’lower’ in the OPPOSITE DIRECTION than when you entered it? That’s the MINIMUM point of ‘cover’.
I just need to understand the psychology here really. I used to be hundreds of points ‘under’….in the past. Now I either ‘hedge’ within 20 DJIA points or am out of the trade. Either way I sleep well each night.
I don’t hedge purvez.
I tend to leg into swing positions, then hold on, with mental stops.
I’d rather get out and review with a loss than hold on with a hedge. I’d become disorientated I think. But I’ve never tried.
Re markets, 78.6% fibs seem to be attracting ES and the NQ100, not far off those now.
Lots of info out there that the rally is running on fumes, quarter-end window-dressing, all sorts of ratios screaming ‘sell’.
I’m in cash, but not far off starting (again) to take position.
I noticed today the USD was down, but so was oil, just to confuse everyone.
🙂 Helping people laugh from time to time is a goal of mine, so glad I could give a chuckle…. 🙂
And what GM just said about hedging is pretty much it, for me too…
Just adds a complication… If I have doubts on a trade, it’s time to lighten, or bail…
Often wrong, never in doubt… hahaha
And wouldn’t say I’ve ~never~ done it, but as I said, it just adds a complication to the whole thing, and it’s just easier to get out and re-group with a wad of cash, not a bunch of conflicting positions…
The scaling into positions helps keep your Reward/Risk ratio somewhat more constant…
As you add, yes, you’re increasing your risk, but you’re also increasing your reward on the other end, because your position size is bigger…
If you DON’T add, your risk (losses) can continue to grow, but you won’t make more money on the other side, because your position size stayed the same…
So your Reward/Risk ratio goes down….
Hope that helps….
Anyway, just got home from my golf league…. ~Now~ it’s time to review charts… *big sigh*
Barry, I do take your point about not knowing where to get rid of the hedge. As you say none of us have a crystal ball. This is the strategy I use:
I take a hedge as soon as a position goes against me by a few points. Since I count EW waves I then wait for either 2 waves or 4 further waves to pass (depending on whether I think this is corrective or impulsive) and then close the hedge at the next 5 minute ‘opposite’ wave. If it goes against me again I take another hedge. I continue doing this until it breaks. Each time I lose a bit of money on the hedge but at least it’s tiny compared to letting the whole thing ride. There are times when I get whipsawed too but again that is small in the grand scheme of things.
I guess I’m doing the equivalent of your ‘scaling in’ except in the form of hedging. Personally I find that easier to control.
My VIX longs are losing a lot at the moment. Trust volatility to die down just as I took a position. Risk remains to the upside anyway for the VIX and won’t take much of a bad few days to break even.
Rambus, always interesting to read, especially if one has a bearish bias:
http://rambus1.com/2016/03/27/weekend-report-93/
Could the Fed cave in within months and launch QE4?
That’s the only way I can see his ‘jaws of life’ scenario happening.
Would the UST bubble burst with a crashing dollar?
Open minded me, always willing to change my view (except on gold longer-term).
Hi GM, Rambus’ top trend line of the blue triangle on the ‘Jaws of Life’ is incorrect. To get ‘proper’ trend lines for a triangle you need to connect the bottoms of ‘a’ & ‘c’ and the tops of ‘b’ & ‘d’. Although connecting the START of ‘a’ to the top of ‘b’ is a good guidance for where ‘d’ might finish….it is just that, a guidance. We are still in the process of finalising ‘d’ currently. Of course the ‘upper limit’ for ‘d’ is the top of ‘b’.
It also doesn’t help that Rambus’ numbering style is not in line with convention for a triangle on 2 counts viz:
1. He uses 1,2,3, etc when it should ideally be a,b,c etc. Nitpicking perhaps…. but if someone decided red lights meant ‘go’ then you’d see the kind of chaos that could cause.
2. He starts numbering at the START of the triangle rather than at the end of wave (his) 1.
So…the bottom line is that I still think we are in a LARGE triangle from the August low and just completing ‘d’ from the Feb lows. We then have to wait for ‘e’ down before we have a FINAL thrust wave up to lay this ageing bull to rest.
“Please may I ask why, at a minimum, you don’t hedge when the position goes against you? Where’s the ‘logic’ in NOT doing so?”
Purvez, what do you mean by “hedge”? Do you rather mean “lock in loss”?
J
Jeger, I take an equal and opposite position rather than close my original trade. However hedging is the exception. I usually close my trade out at break even or a couple of points profit if its reversing. I can do this since I’m micro managing at the 5 minute level.
I hedge if there is a ‘sudden’ movement against me and I can’t figure out why that happened then it’s easier to hedge whilst I dig around for the ‘reason’. Also this way I capture the movement against me which I would otherwise not have done.
Hi P
Ah, I remember someone on another board several years ago doing this – I guess if it works for you then you should keep doing it. Perhaps it suits your timeframe and the size of movements you trade?
Remember, I don’t subscribe to the notion that one can ever really assign a definite “reason” for a price action – unless perhaps it is a single equity where the number of variables are somewhat lower than an index encompassing a number of companies with different business models, income streams, sectors, and industries. The only thing we can know for sure is that when price rises there are more buyers than sellers and vice versa.
All vimho ofc.
J
Hi Jeger
Yes it works for me so I do intend to keep on doing it. Usually the ‘reason’ is some bit of ‘news’ (that I try and stay away from) which causes the ‘sudden’ movement. Take yesterday for example. The DJIA was falling nicely after the open and then it suddenly stopped and reversed. Although in this particular case I just stopped out at my ‘quota’ point at any other time I would have hedged and hunted for the reason.
The reason as it turned out was Yellen scheduled to talk. (I had forgotten about that). Once I know the reason then I make a judgement about either holding onto the hedge or dropping it as per my ‘strategy’. Of course with Yellen still ‘going to’ talk I would have just held my hedge until I knew the results of her utterances.
My ‘strategies’ are just that…not hard and fast rules. I break everything in the book as often as I need to to gain my ‘quota’.
S&P now heading to 2100 before a drop. No shorting for me until then. Fantastic success by Yellen pumping up asset prices. She really knows how to screw the bears over 🙂
Well divergences are building, I don’t know if we will see 2100 this time round or not – for good measure I added to my existing IWM short position this morning.
Good luck all.
J
Anything is possible with Yellen in office. That’s my biggest learning over the last 5 years.
Krish, you ever wonder why Bernanke didn’t bother to ‘save the markets’ back in 2008?
Just couldn’t be bothered maybe?
Well, this current Emperor also has no clothes (metaphorically only, thank God), and when things turn against them (a certainty), she will be impotent.
For now, for some reason, animal spirits seem to be still evident, but let’s see if ES can take out the 78.6 fib level today?
Bulls have expanded a lot of energy to get up here, quarter end approaches, I visit a bull blog, and they are once again diving in to all sorts of cr*p, and can only see upside.
Meanwhile, most bears are in trouble, or have been squeezed out, or (like yourself) are resigned to the Yellen put carrying us ever higher.
Risk-reward for some shorts today seems excellent to me.
Jegers, are you planning to subscribe to RSOTC please?
I’m mulling.
Going to leg in via 3 short trades on FTSE, just took first, futures were at 6144.
Good luck bears.
GM, please may I ask. If you trade goes ‘for’ you, when do you put on the other 2 legs? What’s the criteria?
I sort of understand if it goes against you then you add more at various resistance levels but if it goes ‘for’ you (and I very much wish it does, for my sake as well as yours) then how do you know when to add more?
I’m resigned to accepting the stock market will not crash and stay down as long as Yellen and co. are in office and remain dovish. I certainly don’t expect stocks to blow upwards with huge gains. Good luck with your shorts. I certainly don’t see the risk/reward you see today. I still maintain I will short US markets if we drop below 1975 S&P.
puvez, in this instance I see a shelf of support (possible H&S neckline) on ftse futures at 6,000, so unless we take that level out, I wouldn’t add any more. But if we go up, I would look at all sorts of things before adding more. I do rely on my nose, not just charts. I do sniff a top at the moment, within days.
Thx GM for that explanation. It’s always interesting to understand others ‘points of view’.
Divergence of Indices: https://chart.finance.yahoo.com/z?s=%5eGDAXI&t=5y&q=l&l=on&z=l&c=%5EFTSE,%5EDJI&a=v&p=s&lang=en-GB®ion=GB
https://chart.finance.yahoo.com/z?s=%5eGDAXI&t=my&q=l&l=off&z=l&c=%5EFTSE,%5EDJI&a=v&p=s&lang=en-GB®ion=GB
Remember April Fool’s Day? Ever been caught napping?
I started my career in the financial world on April 1st 1987, with Halifax BS.
Took me 21 years to bust them.
Now the world…!!
ES tapped its 78.6 fib twice, will it hold?
http://screencast.com/t/NOJTqr8GL2YP
NQ100 is 45 points away from its 78.6 fib.
Next fib up for ftse is at c. 6260 from memory.
Purvez, a question for you…
” Each time I lose a bit of money on the hedge but at least it’s tiny compared to letting the whole thing ride.”
Why would you go into a position that you already realize helps you lose money??
Hi Barry, that particular point needs to be read in conjunction with what I was explaining to Jeger. Hedging is not my standard procedure. I can usually get out at BE or 1-2 point profit. However there are times when I start a position and then I get a ‘sudden’ movement against me. Rather than just kill it I place the hedge which gives me time to gather info/thoughts.
Of course once I start a hedge and after every attempt at taking it off, it moves further against me then I just repeat the process rather than bailing out. I guess there may be some benefit in bailing out i.e. no further costs….so I guess it’s just habit. In a way talking about it helps me to analyse my thoughts and actions. Thanks very much for that.
I confess I don’t grasp what you are explaining purvez.
If you have a hedge equal to the original position, and the original trade is going further into the red, wouldn’t the hedge be going further into the black, hence limiting your losses?
I may need a figures example to grasp it, but no sweat.
GM, what you say is correct. Most of my hedge transactions are profitable in their own right. However, having removed a hedge because I had counted the appropriate no. of waves, it still goes against me then I have to let the market move against me in a 5m span. THAT is the amount I’m losing each time. Here’s a ‘figures’ example:
Say I’m currently hedging a short transaction from say 60 (round sum simplification here). The market continues higher till 100 and then the next 5m bar ends at 96. So I remove my hedge at 96 and the market continues down to 90 but then reverses. To ensure I’m not being whipsawed I wait till there is a completed 5m bar above 100. Say that 5m bar finishes at 103. So I’m now 7 points down (+ spread). The example I’ve given is not too far from the truth. Most reversal bars are tiny and therefore I can do this 3-4 times before it starts to take it’s toll.
Hope this helps.
There is one other thing I do which I have not explained:
If I believe that my original trade was flawed then I continue my hedging until I get a smallish correction which is larger than the sum of the ‘losses’ on my hedges and then I close both positions. That way I usually get out with a small profit or very occasionally a small loss. Most of this happens daily thanks to the markets internal girations. It is tedious work but can be rewarding too.
OK, I get it now. Yep, certainly sounds tedious, and obviously crucial to get the wave counts right more often than not.
But you know what you’re doing, so good that it produces profits for you.
Yep – its all there…..could go on for a while ofc, but if your timeframe is more than a few days or week….
I added a DAX short position now.
J
Why? Nicolas is still on vacation…he needs to return.
Scout long on VIX – stop below recent low.
GLA
J
TVIX? GL.
Here’s a picture of the VERY SHORT TERM. This chart shows the action from around 09:00BST till 18:00BST.
http://postimg.org/image/tt8f6kpgx/
Amazing trend line being drawn by the market. I wonder what happens when it breaks? There are already 5 touches, it’s just a matter of time I guess.
Sorry, should have said, that’s the DJIA all hours….but I hope you guys know that by now.
And when it does break this happens:
http://postimg.org/image/t9qnh9g8t/
P.S. That is the updated picture at 19:45BST
Opened a Dow long position based on the views of the man who has been most correct over the last 5 years.
http://www.cnbc.com/2016/03/31/tom-lee-when-and-why-i-expect-new-stock-records.html
He clearly sees something the rest of us don’t and has been very successful because of it. Will hold this position with No stop loss. I will close and switch to short if the S&P drops below 1975 though. Yeh I know I’ve switched from bearish to bullish but all successful traders do that. The trend has clearly changed and this is more than a short squeeze now imo.
Ouch Krish, given how far this wave has gone would you not, at least, want to wait for a reasonable correction before establishing position?
He’s just an industry perma-bull, I mean that is blindingly obvious surely?
http://blogs.wsj.com/moneybeat/2014/03/14/a-look-back-at-the-many-bullish-calls-of-jpms-thomas-lee/
Didn’t do your due diligence there krish, hard lines.
Amusingly, the article mentions 2 times he was cautious…both wrong.
Just a guesser.
Point taken. I didn’t say he was 100% but mostly right. Please let me know the name of an analyst or forecaster who has had more correct calls than Tom Lee over the last 5 years.
My position is small. I will add on a market dip but as I said will switch to short below S&P 1975.
Krish
Good luck although I would reiterate my earlier suggestions along the same lines that you should never trade on someone else’s advice – EVERYONE is wrong sooner or later. Switching from bearish to bullish is never a problem and should be encouraged, but understanding *why* one switches is even more important. If you switch from bearish to bullish based on someone else’s opinion…..well that would be pretty dangerous imho.
At least you have an idea of when to get out if you need to.
J
Took a risky long on the Dow when it dropped earlier and banked 95 points. It’s a buy the dip market for now. The riskiest is trade is being short but it also has the greatest reward at the moment. I’m reckon Dow 18k will happen this month and punch a gaping hole in the bear market scenario. This is based on my own feeling. Tom Lee just provides me with a bit more confidence. Solar cycles, zero hedge and greedometer have resulted me losing money. Only my own ideas have allowed me to remain overall in profit so I do trade my own ideas mainly.
Some further thoughts on this ‘yet forming’ huge triangle since last May’s high. We’ve completed ‘A’ to Aug low. ‘B’ to Nov high. ‘C’ to Feb low and may have completed ‘D’ in the last day or so at Mar end high. So that leaves ‘E’ down.
Now one of the things that happens in conjunction with ‘E’ waves is some sort of ‘news’ item which the market then attributes as being the ‘reason’ for the ‘E’ wave.
So….I’m wondering whether tomorrow’s Non-Farm Payroll numbers may turn out to be that news? I read somewhere today that the ADP numbers and the NFP numbers sort of gyrate around each other but then cancel out by the end of the quarter. Apparently the nos have continued that pattern this quarter but with ADP lower and NFP higher. So the ‘article’ was suggesting that to even out the NFP nos will have to be LOWER!! Of course all guess work, but that’s what turns this mad cap Market that we all love so much.
If the NFP numbers do come out much lower than expected then I will take that as a sign that we are in ‘E’ down (but staying above Feb low)
….but wait bad news equals good news because more QE can be expected. OH HECK!! Why did I ever get into this mad cap circular logic, up my own hooter, game?!
Tying in with your view p, the dollar due to bounce?
http://screencast.com/t/Dv7Xa3hDlGsu
Would hammer oil, and hopefully the markets.
Yep GM, dare I say it another triangle forming there too. There, I’ve jinxed that one too.
Friday should sell off (hopefully) a lot. I won’t be short SPY or long VXX options past tomorrow, as PALS is quite positive until April 5.
So down 10-15% tomorrow?
Cool.
Hey Guys, I am moving to Stormchaser’s site for future PALS posts, until JH continues his articles. Have enjoyed this site for several years and will return when JH continues. Thanks for all of the comments and ideas for trading. This is not an April fools joke (although some may believe PALS is a continuous April fools joke =))
Valley, will await your return here.
That’s sad to hear valley.
What about when he goes subscription only shortly?
No one will read your stuff?
Shame.
Excuse my manners Valley. Meant to say, ‘Thank You’ for all your guidance. I believe you’ve brought together something quite unique in PALS which has been helpful to most of us here.
Hi Valley,
Sorry to read that you are leaving this blog but I m also on Storm.. so I will meet you there..
Next week should be super bullish till new moon 7-8 April after that we will see a correction comming when we are near OPEX these are my thoughts..
Cheers.
Hi Valley
Look forward to seeing you back here soon.
J
Thanks guys. Appreciate your input over the years. Learned a lot.
Here’s the DJIA on April 1st at around 08:40BST. It shows the late Jan early Feb double bottom and the subsequent ramp up. I was fairly certain that we were going to break through the bottom of that wedge back on Tuesday last but yellin’ Yellen arrived in the nick of time. We are now approaching it again and it will be the 4th touch. However I suspect we’ll get a small bounce at that point before it finally succumbs.
http://postimg.org/image/t4lvtnr39/
Following the NFP report the bottom blue line of the wedge, in the chart above, was touched/broken slightly and it is currently hovering at that line as I write. I’m still expecting a small bounce from here (somewhere in the region of 17650ish) before we finally break it decisively.
Sorry typo above. It should read (somewhere in the region of 17750ish). I’ll post a chart shortly as to why I think it will get towards there.
This is a picture from the 30th March high up to date. Looks very much like a Leading Diagonal to me and those usually get retraced a significant percentage.
http://postimg.org/image/4rcd0r1bb/
If however the current decline drops below 17530ish then I’m wrong about the retracement.
Ok this is freakish. I need to ‘bottle’ whatever today’s ‘magic potion’ is!! I know Diagonals both Leading and Ending get retraced quickly…..but THIS?!%*&!?
I’m taking my ‘profit’ and lying down in my darkened corner to contemplate on my navel.
I’m beginning to wish I had ignored my navel now!! That’s about 30+ points I’ve just lost out on. Would have bought me some VERY NICE wine. However it’s getting TOO close for comfort to the start of the Leading Diag (17790ish).
IF it does breach that then we are headed towards 17900 next. I do hope that’s not the case though….I’m bored with this ramp higher.
If it wasn’t Friday I would probably look to add to my DAX short positions tbh…..if GLD/GDX/Glencore drop like that next week I may take April off….^^
J
Can’t remember J. Are you short GLD/GDX?…or ‘take April off? (in disgust).
Thanks Chien Jen. The above chart (stocks above 50MA) is something that my 2 brain cells can handle. The one above that unfortunately someone will have to ‘explain’ it’s significance.
SP500 vs Option-Adjusted Spread ???
Red box comparison, esp the option adjusted spread, add the mega rollover and macro EW bear take and the Chef can only create a Bundt cake out of it all. Imagine the centre of the cake is not just a hole but in reality a black hole. The sidewalls go all the way around. Something like that tsunami in that Interstellar movie but with no escape.
DAX Cross downwards on the 12/50 sma: http://fxpro.ctrader.com/c/H9bbn
It’s been a pretty easy move to count waves on with well defined 2/4 – 1/3 channels. Here’s my chart from earlier this week


Here it is today:
DOW longs going very well so far. No-one but the FED to thank for it. I reckon we can hit new highs in US stocks towards the end of this month. I would expect a dip before a power rally into end of the month. If oil crashes then i reckon the DOW will drop around 10% before a recovery bounce into mid year.
…or just say ‘thanks’ for a second chance, Krish?
Don’t forget to thank Tom Lee too… 😉
Given zero sunspots today, I am all-in, and have bought 20% OTM SPX on my entire account.
John, zero sunspots = bearish results is that right?
If so, good luck!
Ha! So the plan is to direct all of the entire broken world QE into the US marketry as a last ditch attempt to save themselves by saving the great creator of all gravy.
My favourite song for all such occasions is by Air Supply…
Making love out of nothing at all….
Out of nothing at all, out of nothing at all, Out of nothing at all, out of nothing at all, ad infinitum
bulls enjoy chasing the last 2 %… bears have been saying that for the last 7% move. i’m still in the bear camp. https://www.youtube.com/watch?v=CfkqeP5iyEc&feature=em-subs_digest
see retest or push through 1800 spx by 4th of july fireworks
Wikileaks appears to have started a new millennia trend of digitized information leaking into the public domain sooner or later… To begin with this should ( but will it?) change the world (as we appear to have become accustomed to it [the world that is] either willingly or otherwise).
Making the Internet creation a gift to all humanity in perpetuity has to be the greatest gift next to life itself. Unless, of course, all humanity is/remains heavily in favour of all things evil in perpetuity in which case you just got to laugh… again… http://tinyurl.com/h4wes5p
After all, the average person that wins a fortune makes the switch in a nanosecond.
These wealthy people aren’t evil, they’re merely the most advanced amongst our species, for various reasons they have accumulated surpluses.
The most advanced will always end up in power, as they are able to put aside emotion to advance the interests of their own. Good for them.
I watched a documentary on Canadian bears a while back, amazing creatures. Watched a poor mother bear howl as one of her 2 young didn’t make a long swim to an island full of resources. Horrible to watch, upsetting.
The same mother and her mate (the big daddy bear) later together killed another female in an unprovoked attack, apparently to prevent their own bloodline from a potential threat.
Were the two bears evil?
I don’t believe so. Just living their bear lives.
Mankind thinks far too highly of itself, we’re advanced, but we’re only animals, living our human lives.
It’s tough being an animal, but their company is welcome.
http://screwtapefiles.blogspot.co.uk/2015/04/its-not-easy-being-animal.html
( I rescued a medium-sized spider I spotted as I was taking a shower yesterday, I am scared of big spiders, so it was a bold move, but necessary. However it appeared to have been damaged in the rescue attempt, by my handling or by some water, and was shriveled up on the top of the shower screen where I placed it. I was pissed off that my attempt to save another life might have had the opposite effect. I was moved to think of the fragility of life, the irony and pointlessness of it (in the grand scheme of things). When I’d finished showering, I noticed the spider had vanished, I assumed it had fallen off, but couldn’t find it. I feared the worst. But the next morning it was back in the bottom of the shower, alive and well, so I moved it to the window sill before showering, pondering where it would find its next meaty fly. I felt relieved and joyful. My point: who gives a shit about the wealthy and the powerful, we create our own world through our actions and our state of mind, and our interactions with other animals, humans and otherwise. Don’t be a victim of the shit that lies ahead, it’s always been the same, always will be, just prepare as best you can, and rise above it). Good night.
Yes, most creatures are a product of their environment. Why not change the environment?
p.s. bears are unable to do this to a very large degree – humans are.
J
We don’t want to re-hash the debate jeger, but the ‘environment’ on earth is often difficult, hence animals will need to fight like hell to survive. I suspect the brief period of warming will pass, and a mini-ice age will make matters worse for humans and other species.
Humans certainly the most advanced animals, so many ways to kill in volume.
Don’t be naive. Systemic secretion of proceeds from massive embezzlement, devastating drugs, human trafficking, bribery, corruption and pure theft by banksters, gangsters, public figures, royalty, heads of state for 40 years with not a peep from anyone is evil, sickening and needs eradicating. This entity is directly responsible for promoting the starvation of millions in Africa alone. All because of evil greed, by all involved. Be careful which bus you catch.
Meanwhile know that the turn is straight ahead…http://barestbodkins.blogspot.co.za/
‘Twas ever thus Peter_, and ’twill be for ever more, so get used to it, mankind will be ruled by those you call evil, I call more advanced. Greeks, Romans, Ottomans, Germans, British, Americans. It isn’t going to stop.
Free info (not paid for service): Dax topped this time last year at just under 12380 13th April.. After the top it dropped 1000 points in two weeks.
Pump pump pump! Dow longs doing great. Cheers Janet!
Closed my short this morning, teeny tiny profit, but happy to be out.
Possibility Ftse is going to pop up to some major fibs.
That which doesn’t go down, will go up. Bears beware…for a brief period.
So tempting to get fully short here, but perhaps best to wait for the confirmed trend change.
Is that what this site has now become, GM talking to himself.
Hope John Hampson is OK.
Welcome back Phil (or is it Mark, similar tone).
I am taking profit on 3 out of the 8 short DAX positions just now.
J
DAX: We are on the third lower high: http://fxpro.ctrader.com/c/Hj0bn
Thanks Pulp, I had a rough target of 9250-9400 but don’t want to be greedy (on all of them).
J
FFS, is there no one capable of using a question mark (?) ?
😀
J
Hanging my head in shame here. 😦
DOW bouncing back. Did Yellen make some more phone calls?
I am taking some more DAX shorts off now, will keep 30% with stops at appropriate levels.
J
Bulls must buy with all they got, go mega short gold and more on the side. More, more via fanciful CFD’s, EFT’s and leveraged futures. Next week there will be none of y’all. Too good to mention. Bye
Was a little worried to see the European markets drop so much but US has resisted very well. This little pullback should be coming to an end allowing the DOW to power ahead through 18k later this month. The trend is very bullish and I think it’s foolish to short until we see a clear break in the trend.
A lot of different views, for me it is foolish to go short at bottoms and long at tops. Problem is, no one knows what they really are until afterwards……
Krish, may I ask what you use to make these calls? All I can see on most US indices is negative divergencies building since about Mid-March, which makes me very cautious going long. You will remember I went heavily long the QQQ’s when *positive* divergences were in place at or near the most recent lows? I am just wondering how you come to any decisions in general? All I remember from you are statements like “DAX should hit 13k by end of year, I am long” and so on……do you have processes or a system in place to follow?
Cheers
J
I don’t care about negative divergences. When you have the FED in control these tools that have worked in the past will be a complete hit and miss. When the FED loses credibility we can start using normal tools again confidently. A lot of people have been saying the FED is losing credibility but I think their credibility is around 90% of the peak. Once it drops below 60% this bear market can get started. Until then we can see market crashes only in our dreams.
http://www.t3live.com/index.php/articles/market-analysis/5964-jeffcooper20160405.html
crash cycles
Thanks Scott, this Jeff Cooper seems to have it all figured out – with diagrams too….! But no, seriously I am not criticising – if he is asking for subscriptions instead of making hundreds of millions in the markets make sure he is teaching you how to do this yourself, and how to apply it ahead of time so you can actually use it as tradeable/investible material…?
imho
J
astro cycle http://trading-daze.blogspot.com/
Time to short again
Took last DAX shorts off this morning. Just FYI.
Naive? Not a word I would use. Surrendering is just not taking responsibility. “Look, I am helpless and weak – I cannot help myself or others, and those that have stood on the heads of those they have been allowed to take advantage of are my heroes. I want to be like them.”
Mindblowingly bizarre thinking right there. Unfortunately, the 90%of people that are sleepwalking zombies agree with you. You would be the guy 100 hundred years ago saying that “slavery? get used to it, it was ever thus and so will it ever be”.
Just utterly closed-minded and weak with a nice does of narcissism thrown in for good measure. You should open a shelter for the “least advanced” giving out hot cups of “lie back and take it like I am”. And charge them for it as well, that’s the way anyone does anything because it is “human nature”.
Terrifying how blind people can be.
imho
J
“Look, I am helpless and weak – I cannot help myself or others, and those that have stood on the heads of those they have been allowed to take advantage of are my heroes. I want to be like them.”
jegers, who are you quoting there?
Not me for sure.
Just wondered who?
I’d say those who don’t accept our nature are blind or idealistic, I am a pragmatic realist.
One has to be blind to imagine slavery has vanished:
https://en.m.wikipedia.org/wiki/Contemporary_slavery
I am so glad I see reality, and have no biases that blind me.
The BIGGEST slavery that exists today is ‘Debt Slavery’ and on that count apart from the top 5-7% of the worlds population we are ALL slaves. Just wish I knew which ‘master’ to obey!!
Debt is a matter of choice more often than not IMO (so much consumption and waste).
It was weird to read jegers contention that one might have said 100 years ago that slavery will continue, given that he probably believes it doesn’t, but in fact (if one had said that it would continue) one would have been correct. So, that tells me a lot about the cognitive dissonance at work for jegers. Funny old world eh?
Yes GM you are right in the ‘letter of the ‘word”….debt is a matter of choice but for a HUGE swathe of the populace, driven by ‘marketing hype’ and ‘supposedly’ cheap credit it is a powerful drug. (One that I can claim to being seduced by for a very looooong time). For MOST there is not much ‘choice’ in the matter sadly. It takes ‘knowledge’ and ‘intelligence’ and ‘perseverance’ to break the habit. Even then getting out of it’s clutches is a battle that can wear the greatest of ‘Goliath’s’ amongst us down…..am I giving my ‘game’ away here? I do hope so because I NEVER want anyone else to go through what I had to.
???
https://en.wikipedia.org/wiki/Standing_on_the_shoulders_of_giants
I’ve re-loaded 75% into short FTSE again on the bounce today, this time I will hold on. Rest to be added tomorrow.
GM, the ONLY trades to put on are the one’s where you know WHEN you are going to get off….in either direction. My comment stems from your comment : ‘…,this time I will hold on’.
Yes, poorly worded, I have a mental stop at the 6305 level on the index. Two big fibs up there.
Hoping the falling trendline will hold though, with a divergent RSI.
https://www.tradingview.com/x/OSiAkCkt/
Aaah good. I really don’t want anyone to be burned like I was when I didn’t have ‘that simple strategy’ worked out.
I wouldn’t be surprised to see ES tag 2087 before rolling over, maybe tomorrow.
I’d add my final short there (on the FTSE).
Nikkei already leading the way down though, off 9% already from recent peak.
Suspect if (when) other markets join in, it’ll be fast and furious.
Added my final tranche of shorts at 11.30am.
Hoping that the top is in (for now):
Good luck to bears!
This is a chart of the DJIA from 4th April high to 19:15BST today. Unless it drops further beyond 17450 I favour another ramp higher to the top line.
http://postimg.org/image/5p2wn0sn3/
The reason I say that is because the ALL the waves from 4th April high to 5th April low are 3 wavers at the 5 minute level. So I’m thinking that that drop represents wave [A]. If we get to the top line again then that represents wave [B] and then we’ll have another wave [C] down which will probably extend to 2x wave [A] at least.
Thinking big whilst using a microscope needs some special kind of spectacles but counting waves when they not arrived yet takes pure imagination. If I appear skeptical then you now seeing clearly. But I been wrong before many times, so its not a problem.
Peter_ I understand your scepticism. I too am wrong many times (usually within each day) but without ‘some method’ of counting waves before they arrive it would be impossible to trade.
I notice that you too make prognostications about waves before their arrival. Using a microscope to trade does not preclude me from ‘seeing big’. My 2 brain cells preclude me from ‘thinking’ beyond the next second.
Fantastic recovery by the Bulls. Onwards and upwards.
Yes indeed Krish….so it would seem. Do have a ‘small profit’ level to get out at if need be. GL.
Krish, a comment from Moe’s today indicated that market makers were left with lots of unsold shares, so they went for the gap up to unload to mugs.
I’m happy to see up overnight, down in daytime trading, indicates the end is nigh.
Although I’m expecting a rise to 17750+ on the DJIA in the next session or two, I too am working on the assumption that we started our journey down towards the Aug/Feb lows from the Monday 4th April highs. IF/WHEN we get towards 17750 I’m going to become a swing trader till we get towards the Aug/Feb lows. I will of course continue day trading to keep my practice up, but the bulk of my trade capital will be in the ‘SWING’. I can see my better half getting annoyed when I get up in the middle of the night to ‘check on the market’s progress’!! Hmmm better get the spare room ready!! LOL!!
As I write we are at DJIA 17666ish. I can see a quick scenario where it drops to 17600 or just lower before heading for the 17750 target. So a short here ‘with nimble fingers’ makes sense.
US30.http://fxpro.ctrader.com/c/ucgbn. I just thought id post this as it has some bonny colours on it.
Blimey!! pulptrader, what have you been ‘smok’n’? Reminds me of those 60’s spiral glasses which made everything look ‘MULTI’ dimensional….with a headache to boot if you stared through them for more than 10 minutes.
I saw one of those whilst diving
The DJIA just touched 17540, which is a lot lower than I was expecting from when I wrote at 17666. Of course the market never does ‘EXACTLY’ as I say….BUT at this point it is VERY TEMPTING to take a long position, with a stop around 17515, with an eventual target of 17750+.
Just to be clear….it’s too late in the evening for me to take ANY trade. I’ll evaluate on Sunday night when the market’s re-open.
My ability to include ‘apostrophes’ in the wrong places seems to have increased!! Sorry Miss Cooper….:-(( ….(my English Teacher)
https://caldaro.wordpress.com/2016/04/09/weekend-update-547 : useful information: “Just look at the weekly chart. While looking you may note that volume, which we rarely even look at, has been declining throughout this entire uptrend. During the bull market, uptrends after steep selloffs have displayed at least steady even volume.”
Futures close out end of next week, that event should be the end of this manic phase, if not before. I accumulate things like gold miners and index shorts.
Now this page is about as overextended as the markets. And we have no sign of our host since his last post here on Feb 16th.
I worry for him.
Peter_ I agree, John H’s absence this long is a bit worrying. He has an email address somewhere on this site. I wonder if he’ll respond to that?
valley,
can you update the pals system. dont like stormchaser site.
Hi Bill,
I am over at Peter Temple’s Cycles site which has an active astro trading blog/EW blog/cycles.
PALS suggests:
This week will touch 2000 or lower.
Next week will touch 2100 or higher.
So when it touches 2000 buy, and when it touches 2100 next week sell. 5%. In one week.
Thanks valley. I will follow this trade plan as it closely matches my own. Getting down to 2000 is the hard bit though. Will wait patiently.
Pump pump pump. Central banks at it again this morning. Drop followed by inexplicable explosion higher.Think this proves clearly that central banks have huge control over the market. Good luck to those expecting a market crash as it wont be allowed to happen at the moment. It will happen one day…just not in the near future.
I hope Alan is having as much fun in the miners as i am. My posts here have only been about 3 things – gold going much much higher, biotechs going much much lower and stupid ideas about a overall market crash based on puetz crash windows. Well 2 outta 3 ain’t bad.
The Bears are setting up for massive disappointment in 2016. The market ascent is going well. Anyone thinking markets will crash in the next few months is nuts.
Specie, good to know you are having fun. Are you a buy and hold type person or do you actively trade in and out of the market? Gold at the moment seems a bit extended and am wondering whether you’ll trade that or is it just ‘noise’ to you?
Hi Purvez, thanks for the question and also thanks for your part in keeping this site alive. I am a long term holder of gold and gold stocks. i began in 2000 and up till 2007 i had 17 miners that were taken over. sold half my gold position when gold reached 1050. didn’t buy any on the drop to 750 and rode them up to 1920 and down to 1050 again. added some new ones in 2014 and 2015. thats all i own and thats all i will ever own except for a few forays into shorting stocks when i think conditions are right. that shorting hasn’t worked well. Really interesting to see stock bull cheerleading to the extent its shown here.
Have closed 50% of dow longs. Will close the rest near 18k and wait for the next signal (which will probably be a sell).
Congrats Krish. Finally getting it right. What is the profit on the trade?
Well played on your long profits krish.
Well played specie on the gold miners and gold, with you there.
Less well played me, should have been more patient with ftse shorts, but it’s now at a key fib level, I’ll give it a little leeway.I think the end is nigh for risk assets this week.
Posting will be infrequent from me this next 11 days, back in Morocco.
+7 in my first round of golf for a month, happy with that.
A stop is a stop GM…
Except when it’s not JL!
😳
I’d be very worried holding long term shorts at the moment. This solar cycle has been an epic failure at predicting a stock market crash. John analysis, as good as it was has proven useless in this central bank controlled environment. Secondly the fabricated data out of China holds 100% credibility to the investment world so China can quite easily fabricate a global bull market. Until these two fundamental tailwinds change the chance of a bear market has as good a chance of happening as Yellen winning gold in the 100m Olympic final. Good luck to the bears…you are gonna need every ounce of it.
OK a 25% average market drop during next 3 to 4 months, agree, no need to shout.
GM good to know you are enjoying your time in Morocco. Do you go to different hotels or just the same place?
My better half and I went once with our, then, 6 year old son to Tunisia (somewhere on the coast) and because of my Pakistani background they detained us for over 4 hours at the airport before finally letting us go.
Now she won’t go anywhere near North Africa.
I do however love the culture and food there.
Same place purvez, I use an apartment, very nice, by the marina in Agadir, pools for residents, very cheap as I’m a regular.
Beat a Moroccan guy 8&7 today, gave him 4 shots, he was a tad erratic, me very steady.
Celebrating my 49th birthday tomorrow, not that birthdays mean a lot to me.
Seven is my lucky number, so 7×7 this year…..who knows what may happen?
Krish, don’t get carried away by a rally on little volume, and still not back to the highs.
Look back a year, see where prices are today. Flat.
And please, forget the myth that central banks control anything. The only way they prolong a bull is the way they don’t want….full scale currency crises. May well happen, but real returns will be abysmal.
I’m with specie, gold and its miners due an epic 20 years as everything collapses.
Was talking to my Morrocan friend today about buying a farm out here in 4-6 years, food supply likely to be important as supplies dry up into the mini ice-age.
Jeez, the future is so grim. Enjoy every day eh.
Good luck to bears, nearly there.
Happy Birthday GM, you ‘spring chicken’. Hope you have a really lucky year….or since the year just gone was the 49th then I hope you DID have a lucky year.
In any case ‘Enjoy every day’ is a good motto.
Thanks Purvez.
There is only today.
Rest of DOW longs closed. Don’t want to get too greedy. Peter I doubt we will get a 25% drop in the market from this level…but if we do it will be the buying opportunity of the year.
Every bear has a bounce.CB interventionism appears to make the bounces appear bullish. You should forgive yourself for getting it wrong. Unadulterated wave analysis conducted in an anechoic chamber within a Faraday cage has the power to guide the more broadly experienced.
The average 25% projection is not the end of this bear, that is still next year.
Is the crash this year or next year or never?
Ok Peter lets see if we get an average 25% decline in the next 3-4 months as you say. We can set the 1st of August as the end of this time frame. For your predictions I am expecting the DAX to average 7500 between now and then. The DOW to average 13,500 and the FTSE to average 4775. This would be the average 25% decline you talk about. Now my predictions for the same indices are below:
DAX: 9500 (average decline 5%)
FTSE: 6100 (average decline 4%)
DOW: 17000 (average decline 5.5%)
This is based on there being another significant market correction in this period but with a full recovery afterwards. Good luck Peter but to me your prediction looks utterly bonkers. It would require the market to spend significant time far below those 25% decline numbers to get the average that low!!
I don’t think he is talking about average prices, but that the average of his forecasts is for -25%…but honestly, I am just very confused. I have covered all my shorts and have given up completely, but as I said to GM, a stop is a stop, and I am up MTD/YTD and so pretty happy anyway.
It is hard enough to call for -25% drop, and it amazes me that one can forecast a -25% drop, then I guess +33% rise to new highs, then a crash in 2017? That takes real skill which I clearly do not have.
45 points from S&P ATH. Hope John is in good health. Would love to know his opinion of the recent market action and how it affects his models.
When we all become too otherwise engaged with ourselves we should listen to our conscience and dispossess ourselves of all imposed/adopted brain shackles. The concept of a collective conscience is non-religious. We all come from the 10^-10^-infinity chance of such life flourish in the Universe and we will all return to it. That’s physical as well as metaphysical.
PS: Its just one of many to come opportunities to buy gold. You can keep it or sell it asap. It will just continue to be the most complex element in the Universe and do its job as such.
What are your opinions on the ever uber doom ponzi website?
http://ponziworld.blogspot.co.uk/2016/04/the-fed-put-is-wall-street-fantasy.html?m=1
It seems less sophisticated than ZH, and that’s saying something.
Pleased to see the Ftse back below the fibs I have as stops.
All eyes on Doha, but there’ll be no deal, so watch out next week.
well looks like there is a deal so expect oil to explode higher overnight. FTSE could hit 6450-6500 very easily now but should decline after that as oil will ultimately head down!I hope shale oil takes the opportunity to hedge for the next few years and go for maximum production to severely damage the control/finances of OPEC. The FTSE was a magnificent buy at 5500 but easy to say in hindsight.
Krish is in the Middle East I believe, and has persuaded the Iranian government that they too must freeze production. Stunning diplomacy.
In the real world, Iran will keep increasing its market share, and everyone else will continue to pump as much as they can. OPEC is a dead duck, as the Saudis have changed their policy to full production for as long as the oil exists. Freezing at January 2016 levels still leaves a huge glut anyway.
A sell the news event if ever there was one, in my opinion.
I’m so sorry! The Iranians didn’t listen to me. No deal! I fully agree GM. Iran has no benefit in freezing production. They should continue to pump as much as they can. Only when Saudi get rid of the stubbornness will there be any sort of balance. I thought there would be an agreement without Iran but was proven wrong today. I would expect this to create headwinds for the markets but oil alone certainly WILL NOT create a bear market. Yellen lies waiting to fire more bullets from her near infinite arsenal if need be.
You do know that most of the Middle East can produce oil for under $10 a barrel?
The only beneficiary of high oil prices has been the US.
Wars and financial shenanigans have been used to this end.
Next up BS redacted 9/11 pages, the Empire of Chaos will stop at nothing.
Your faith in Yellen is touching and common-place. But entirely misguided as events will show.
Nick used to say the same I recall.
Of course Yellen and her phonies will ultimately fail. The trillion dollar question is timing. If she fails in 2018 we have 2 years worth of bull market left. If she fails next month then we fall heavily very soon. Everyone thinks she is going to fail next month and usually the majority are wrong. I think she still holds huge power in the market at least until later this year. All big falls will be subject to 100% retraces until then. GL with your trading.
I mean we had a nice drop in the morning as oil fell but since then PUMP PUMP PUMP PUMPETY PUMP. Most likely it was central banks panic buying futures to stop a heavy decline. So far…fantastic success! If earnings season goes better than expected BANNNNGGG…probably a 5% rise in indices on the way. Carry on shorting if you want though…I need the bears to get burnt to fill my pockets will lots of cash.
I love Ponzi World Blog. Mac10 does a great job.
some may feel it’s a little over the top but i find it very helpful.
He uses simple charts and draws his own conclusions. You may not agree with his conclusions but you can’t argue with his charts.
i tend to agree with 99% of what he presents – i only defer on the timing
I don’t want to spoil the… neversaybearbull+contrian+disillusioned+nowZHalsodoubts+Iwasonceabearbut+neverlandisreal ifyouknowwhatImean etc. But….
If C equals some or other multiple of A then how many times have we all been here before?
So Doha was meant to be the start of the next leg down.The actual result was a non-event. All indices showing full recoveries of the drop this morning. Hope you managed to cut your FTSE positions GM. Oil only down $1. So much for the “we are gonna crash into 30’s”. Sentiment remains bullish everywhere for the moment. Market headwinds quickly disappearing…watch out above. Good news for all the bears on the sidelines…you’ll be able to short from much higher levels…just be patient for now.
The Ftse is not finding much of a bid today, lower than it was on Friday, the big fib is holding it at present.
The clock is ticking for the bulls, the top is likely this week or next.
Sentiment driven stuff – by the “experienced” traders of today who were still in university pre-2008/2009 and don’t know anything beyond the “sentiment” trade. Watch Iran, who have increased their production by around half a mill barrels in the last 6 weeks alone.
I am happy that you got at least one trade right for this last 12 month period Krish, but seriously one cannot judge the reaction from something like this even before the Yanks wake up. I don’t have a position in oil atm, too volatile and better opportunities out there in my opinion. Lots of financials bullish oil at least publicly, wonder if these guys are ramping and buying puts. They have muscle, and haven’t seen signs of the huge USO long positions entered several weeks being sold off – unless they are iceberging….
Good luck as always to all.
J
Lets see what happens next in markets. I’ve talked enough so need to see how things play out to see who was right or wrong.
CB tapdance can sustain to infinity by just ignoring the debt
Why not ignore all debt, not just the sovereign stuff
Oh yes, that would make the banksters bankrupt and they own the planet already
Not the sovereign stuff, that crap been put on the back of the muppets
Mmmm Iceland did it and it worked, but look what the bankster cops did to their PM
Seeds of (begins with D)
Hehehehe. What did i say….
Today’s actions since the open…on the DJIA…reminds me of a ‘blow off top’. So if it turns down in a ‘big’ way today then I think we are done with this wave.
Unless of course Krish tells me that there is an agreement with Iran…..then all bets are off.
Might be a blow off top. I’m pretty happy with the longs i loaded up on this morning. Stop losses to break even so maybe i’ll walk away with zero at worst. A shame I didn’t buy oil but to be honest I don’t understand the recovery today. Oil should be trading much lower!
The DAX is the one im really interested in. A breakout here suggest huge upside due to the “fake” chinese data providing heavy support. Gone with a short on oil but have bought some call options at $45 in case the panic buying boosts prices even higher.
Just for follow-up purposes, I have an additional 50% add to my system short today, hit at 2088 SPX.. That is, add an additional 50% short to the initial system short of 50% taken three weeks ago at 2037.05.
System trade is 100% short as of today’s close…
I am currently much more short than that, so…….. Yayyyyyyyyyy ME!!
Taken a lot of pain lately, but there we have it….
Theoretically, we could flip back to a buy signal at any time, which would mean a “Cover All Shorts, and go 50% Long” signal, but we haven’t so far… Watching closely for that…
Otherwise, carry on…
As I said, a stop is a stop for me…but GL to you. Will your system flip at new ATH, or is it more like a flip if it dips?
It could flip at either one…. Or not….
It astounds me you are so short at this point. even if you are correct is it not better to wait for a drop followed by a 62% retrace at which point to short? It would provide more confirmation of a top rather than guessing where this rally will end? I mean if you are right the profits will be larger than waiting for a confirmation but the risk is also significant.
Dow closing on exactly 18k on 18/4/16 takes some serious planning.
The God of stocks speaks again….
http://www.cnbc.com/2016/04/18/tom-lee-sp-could-be-up-double-digits-this-year.html
http://www.cnbc.com/2016/04/18/tom-lee-sp-could-be-up-double-digits-this-year.html
The God of stocks speaks again…
Calling all Solarcycles.net posters, join me and several others from this blog at worldcyclesinstitute.com. Some really interesting posts there recently.
Sad to see valley attempting to kill this blog in Johns absence.
Well, I’ll be staying put, I’m happy to talk to myself if need be.
Disappointing though valley. American ways.
I am there, will be back when John feels and starts posting. Best wishes to Johns speedy recovery.
Bill, you’re just a valley fan-boy. Off you go then.
You are a real piece of work, BM.
GM, there is an advantage to posting on a site that is active and that has a skilled moderator such as our Canadian host, Peter Temple.
GM are you out of your FTSE shorts yet? You have to admit the shorts were timed very poorly.
I have just started building short positions in the FTSE with 6398 as the first entry point. Will build on further rises if they happen as I believe this rally needs a retrace before possibly continuing higher. Not touching the DAX as sentiment is fantastic there and 11k come come in a blink of an eye if the bullishness continues. However, a sharp drop is also on the cards if sentiment turns so too volatile for me. DOW breaking 18k is a massive deal but I favour a retrace before hitting new ATH’s maybe this month. Even Tom Lee might get this wrong as he predicted new ATH’s by end of May. He was not bullish enough!
Very poorly?
No, that would have been shorting down at 5500.
I’m within 3.5% of the current price, entirely acceptable for me on a swing trade.
Pleased to see you joining me, I think.😬
Krish
I don’t know who this Tom Lee is, but the current PE ratio on S&P500 is 24.2 as of yesterday…….so either he is a moron or CNBC are morons or probably both – at least according to my theory that 90% of people are morons…….
When you quote him (or anything/anyone else) on here, do you not look into the (mis)information that is proffered?
That is not to say that the SPX cannot go to 30 or 40 PE, but suggest we should at least have some “facts” in the mix……
/facepalm
J
p.s. Bonus information for you, Nasdaq is at around 22.5 PE as of Friday 15th……
He mentions forward P/E which is as this link shows well below 25. https://ycharts.com/indicators/sandp_500_pe_ratio_forward_estimate
Of course its a forward p/e and it could be wrong as its a prediction so I see what you are saying too.
Well he mentions 15 no? So what did he do? Predict the forward PE to beyond that chart you posted whilst still maintaining that this year will be up “double digits”? The problem with that as I am sure you know is that the price affects the P part as much as the E does on the E part……..so will price remain the same and earnings will increase 50%? Not fukin likely…..will earnings come down and price go up…….probably not in the long term……so maybe what happens is that the price goes down 40% whilst earnings flatten out…..and so the PE *ratio* reverts to the mean of say 15 ish……timeline? Not possible to say ofc…..
The point I made is that unless the media outlet is misquoting him, there seems to be only limited understanding of how a simple ration works…….
I asked a guy the other day why he was buying stocks, just out of interest. He said it was because he couldn’t get more than 2% in safe bonds, maybe 3-4% in “high risk stuff”. I asked hiim what the current yield was on S&P 500 as a whole. He said “oh, around 3.7-3.8%”. The current yield is just over 2%……..
J
I guess that’s fair enough. If earnings dont explode higher as you said stocks will be at best flat and more likely lower. Oil will be a factor too I think. Once Kuwait is back online at normal levels oil should drop heavily. If it doesnt then there is no need for a production freeze as everyone apart from Saudi is going max. production and the price is staying strong. However, a 40% drop in my eyes is absurd unless you are looking at a multi-year time frame and a collapse in forward earnings expectations. I hope i’m wrong and you are correct though…its better to have a 40% drop now and return valuations to normal rather than another ramp higher only to setup a larger fall in future which would be more damaging. At moment everything is exploding. Indices, gold, oil etc. all blowing up which may suggest a blow off top but lets see.
This is the mega capitulation of the bears Tom Lee was talking about. Shame John H isn’t around but hope he is well and I hope he keeps this site alive as it contains a lot of useful and sound information that will one day (ie. when central bankers/their current policies are extinct) help us predict stock market cycles.
So when all bears capitulate what do you have? A top I reckon.
It’s great to see someone get so excited over a pretty standard bull market topping process, which always includes healthy rallies.
When news like this
http://www.investing.com/news/economic-indicators/german-zew-economic-sentiment-improves-in-april,-beating-expectations-396354
sends the DAX soaring 2% what chance in hell do bears have?
I believe here is a “.886gap5” which Slater9 had previously made us aware of: http://fxpro.ctrader.com/c/Msdbn which signalled the start of the DAX push upwards, using the Doha dip as the calibration.
They turn into bulls until it is time to be a bear?:D
I kept some of my shorts, but i’ve I had to go long to cover these.
Dax: Hit the top blue line next? http://fxpro.ctrader.com/c/00xbn
Nice chart. Yes it would be ideal for a touch of the blue line before a big drop. No shorting the DAX just yet then!!
FTSE short stopped at B/E. Stupid trade on my part tbh.
The GAAP Vs Non-GAPP differential is approx 26% currently,
so forward PE’s may be a tad more generous than at first glance.
On the flip side you have a huge need with yield in the context of ZIRP
and now NIRP.
So where does that leave us, a topping process? –
I thought markets had topped early Summer 2015,
today is perhaps the first day that I am beginning to doubt that.
Some divergence in the DJT and RUT if you looking for lower
levels and need something to cling on to.
Tom Lee makes some astute calls, then again I remember his
2008 year end SPX target, it turned out a little differently.
here is all you need to know about central banks and this market. they will pull the rug when they want to and not a moment before http://www.metatech.org/wp/conspiracy/sinking-the-titanic-create-federal-reserve-bank/ considering less than 1% own 50% of all stock/bond positions, they move it back up when they want to as well
The bottom chart here:
http://spiralcalendar.com/2016/04/is-it-may-yet/#more-10088
shows the Dow diverging quite significantly from a Solar/Lunar trend line which it had been following fairly accurately. Does anyone here have any thoughts or understanding on why this would have happened or even what it means?
Thx in advance.
Interesting chart, it kind of reminds me of the relationship between GLD and GDX, sometimes in sync, sometimes inverted, sometimes totally out of whack. I.E. I would put limited faith in it, but potentially useful at times….
The only explanation I can offer is that there is no system or pattern that I know of that is even close to excellent (let alone perfect), however much we want them to be….:)
imho
J
Thx Jeger, I was hoping for a more ‘technical’ explanation. Something along the lines that Solar flares had decreased/increased or the magnetosphere had wobbled. 🙂
Just look at the DAX fly! I’m long from the drop this morning with a target of 10800 in the coming weeks.
Wow Krish, 0.2% up….and you were lucky to get in at the low as well……:D
J
1% up actually so far and its continuing to pump pump pump higher. Yeeehaaa. Oil is off to the moon. No-one cares about the glut now it seems.
Do you feel the immense power of the bulls Jeger? Does it make the ground under your feet tremble? Probably not but my DAX stop is now at B/E + 10 points so I think my trade was very successful. Thanks for your 0.2% comment anyway.
Congratulations Krish – well done! My 0.2% comment was based on the price at the time, I am happy that it came good for you. I am a bull and bear at the same time trading a long/short portfolio so any movement is nice as long as I am on the right side ofc……
J
the SPY and DIA made new all time highs yesterday confirming my wave count. My subscribers are having a great year riding the long trade for equities, precious metals and miners.

Where do you see wave 5 ending Alpha?
2170 to 2200
Alpha, hopefully your subscribers will forgive you for the mistake of calling yesterday’s action in SPY as achieving a new “ATH”…..?:D
Some divergences building up on SPY, it will be interesting to see where we go from here but seems almost unavoidable that we get real new ATH’s quite soon…..
Good luck.
J
SPY and DIA both made new highs when adjusted for dividends and splits, it was not a mistake
I am not sure what you mean Alpha, but basically what you are saying is that these indices have made new ALL TIME HIGHS, if not in outright terms (clearly) but in an adjusted way? If so, I haven’t really heard of this before in terms of trading. Presumably that also means that it is possible that an index could make a new low (on the chart) but really it hasn’t due to adjustments for divi and splits? Or even Fib levels would also need to be adjusted as to where they might be if one adjusted for divi and splits of the underlying instrument being measured? I think this would confuse my brain, so is there an easy way to make this adjustment you speak of for all the thousands of instruments I scan every week to see if this has any merit?
Alternatively, you may have meant “new highs” instead of “new ATH’s”?
Cheers
J
just look at the chart above, what do you see for the SPY and DIA, check out Cobra’s post 4/22/16.
Closed 50% of Dax long with just over 200 pips profit. Fantastic trade so far. Hope some others got it too. The chart has a clear target of 10800 so will hold the rest until there.
I’m seeing this on the 5min chart of the DJIA at roughly the time of this post. So it certainly doesn’t look like we are done climbing.
http://postimg.org/image/p9jjn6393/
Hmmm, a wedge that didn’t recover. That is indeed rare.
WOOOOOWWWWW the market is down today. Wasn’t sure that was allowed. Lets see if the stock pumping machines can regain their momentum….otherwise Yellen and co. will have to step in again.
And now that something like never before has actually been created for real, what now?
http://tinyurl.com/jcj6hkw
Sure, lay back and drink that pinacolada or whatever
Sure as *hit and run…
Very nice indeed Peter_. Thx for the chuckle. Hope it’s SLOOOOOW drying paint.
The WORST bit is that they ALL look so SMUG with their accomplishments.
To be fair to Draghi, his one mandate is price stability, and he’s delivered that very consistently.
He can afford to look smug as he has his red button at the ready ( the gold bid QE). The others will not be so lucky, as they’re forced into fiscal QE. The helicopter blades are stirring. Blame the politicians though, not the central bankers. Ultimately blame your fellow voters, Marxists to a man and woman, just not realising it.
Ah to marxist to marxist to buy a fat …mmm
Kind and Onerable Sir please help me,I’m just a poor marxist with 15 hungry children
Go away you pesky critter, go next door before I call my personal law enforcement
The Uk tax take is already around 30% of income on average.
I’m all for some tax and some help for those in genuine need.
I’d like to remove the big leech in the middle of the payer and the receiver though.
All those non-jobs and all that waste, and all those wars and deaths. All because of govt.
Meanwhile, is the top now in?
I see you’ve admitted TA defeat?
You should share your charts here.
Still holding long for now. Peter Temple still expects a final burst up too. I’ve loaded up on a Dow long for the final attack. Then time to short…
Ah….the Peter Temple indicator…..haha…..
Do you ever do your own analysis and make own deicsions or is the strategy purely based on guys on the internet?:D
J
Jeger what is your current positioning? You were right 2/2016 about the rally to 200SMA, but now it continues to amaze…
Hey John
Hope you are well buddy, sorry I missed this.
At the moment, I am long a few US and UK stocks, short MIB (Italian), short a couple of airlines, short MDY, short FAS and of course I still hold my underwater GLD/GDX shorts……I did get out of my remaining ill-timed Glencore short last week at around 133 – but that was a 2.4% loss overall but considering I went almost 30% (on that position) offside due to a missed stop due to travel, I guess I should be happy with that…….
I have no positions in commodities right now, and nothing relating to US indices (directly) per se except MDY.
My current view is that whilst the market is churning and not really going anywhere, I will trade a bit long and short and keep it relatively light for the time being. I am considering going long FXI for a longer term swing trade as it has broken out of downtrend, but think it needs a retest/pullback so am watching and waiting.
What are you seeing atm?
J
Thanks for this…I very much respect your view, and you certainly made money over the years.
I have been mega bearish for the past year. Strangely though, I was up pretty much every month in the last 6 months, perhaps due to luck and perhaps do to stops.
I am at a loss as to why Hampson’s crash has not happened yet. The solar max was supposed to be 2012, and then it got delayed to 2014 — ok, it is a weather and the forecast was wrong. But then we got new solar swing lows in 2015 and no crash. 4/2016 would be a new solar low (ISN=35 or so) since the peak (ISN=146). I had thought the market peak would already have been in, given the big drop in solar. Granted, the new highs are in SPY and past analysis on the Dow did not include dividend adjustments. The SPX is still below ATH. I think I am the few persons left talking about the solar maximum in “solarcycles.net”…how far we have given up.
I don’t currently have much of a position. At this point, I am pretty happy to wait to be one month late into the crash. I don’t think a 1987 or 1929 flash crash will occur, but it is that crazy fear that keeps everyone max short while SPY is above any moving average you can come up with. Even in 1987 or 1929, moving averages can work.
My only position is short ASHR. It is costly to borrow at 10%, but it is trading at 30% premium A shares to H shares, not to say anything about the poor balance sheet quality. I guess I could hedge by going long FXI. It is a small position, so I am totally fine if China wants to buy and double Shanghai — just crash in 3 years please. After that, it will be the next solar cycle.
I haven’t read what Peter temple expects after this top but I expect a pullback 5-8% and then another rally which will blast us to new highs. 2250 S&P is a reasonable year end target for me. I fully expect no bear market. Most blogs I read are bearish so I don’t just follow the Internet. Greedometer came out with another prediction of 60-70% decline about a year from now. Completely ridiculous considering the huge pile of ammo still available to central banks. Once the ammo is out markets will collapse big time. Until then I buy the dips and I hope there are many of them! Also nothing wrong with following guys on the internet if it makes you money…just need to pick the ones not to follow and do the opposite.
In your mind, the CBs have some ammo, in a pile, and one day it will be exhausted?
Not literal ammo, I realise that would be very dangerous. But metaphorical ammo.
I’m wondering what this ammo is, and why you think it will be exhausted one day?
Only. because they didn’t seem to be bothered about using it when the 2008-09 crash happened, although they did ease and say soothing words all the way down.
Big shout out to Freddie, I’m sure we’re all grateful for his continued contributions to the blog.
Here’s a piece that I read today which I felt deserved a wider audience.
http://www.salientpartners.com/epsilon-theory/my-passion-is-puppetry/
The author has a nice writing style and has an interesting take on the ‘Central Bank’ led financial industry.
OK style but the CNBC influence not. Think mega leverage Fed agents inside trading total control. Think bankster megacrooks muppet puppets to everything and everyone else. Think self preservation go along optionless. Don’t worry be happy or else.
Hehehe!! Peter_ you are commenting on writing style?
The rest of your prose (the bits that I can decipher) I agree with as does the guy who wrote the piece, I believe.
Just can’t stop chuckling at you having an opinion on ‘writing style’.
Early cycle tops imply weakness. I am selling before May and going away. I hope you get better John. Bye.
So….everyone out there has been duped by (what looks like) a bear market rally.
Talk of bubbles, blow-off tops, fear of market responses to CB moves. Even a return to c.1800 is now considered impossible by some. Bulls are loving it, once again lulled to a cozy sleep.
It’s different this time everyone cries, the CBs will buy it all, it can never fall far.
Even Peggy & Scott’s guy has shut up shop, along with all the other cycles guys. It’s perfect.
All of the above BS makes me think a hard fast deep dip lies directly ahead, at least to 1800, maybe lower. I’m 160 ftse points in the red, waiting patiently.
I am cutting back on my posting. Crude has completed an upward corrective Elliot “5 of C of C” (a 5 wave ending Diagonal Triangle) and is set up to break to new lows. If so, then not only will energy stocks sell off but a liquidity crisis is likely to happen which will cause a major decline in all stocks as almost all major stock declines were preceded/caused by liquidity drying up.
Noticed you’d been very quiet Richard.
Hope you still post occasionally though.
At tis point I agree with you, the rally in *risk* is looking mature, and things will get very tight during the summer.
I expect some first signs of banking issues, maybe failures, over in Europe.
Notice I am short FAS. That is an insurance policy of sorts – I will probably only take that off if Crude regains the 60-70 range…..vimho.
J
John Li, I also look at the sunspots every couple of weeks, and scratch my head.
My feeling is that humanity has its collective head in the sand at the moment, about all of the things JH has highlighted, and a lot more besides.
But I expect the solar influence to win the day, and it feels like a rubber band being stretched whilst markets stay up. The snap back I expect will be violent and shocking (to most).
FUBAR our world is.
If I recall correctly there is a Geomagnetic reason for stocks to top in May and sell off for the summer to the next Geomagnetic event in the fall. There may also be in “inverted” Full Moon reason in that this past Full Moon produced a high turn instead of the usual low turn.
I am looking for Stocks and Crude to top and head lower (crash) for the summer. I am also looking for the potential of a super rally in Rough Rice futures like what happened two Delta Long Term Rotations ago (eight years) and, additionally, for Grain rallies this northern hemisphere summer as El Nino transitions into La Nina. There is growing drought in northern Brazil which is impacting their second Corn crop; and, La Nina’s produce drought in the USA Corn belt (a potential one-two knockout punch to Corn this year).
I hold today’s rally in Crude to be the 5th wave of a “C or C” corrective rally that will end and break to new lows. I hold the rally in Crude from January to now to be corrective. Elliot corrective rallies are often contained in Channels. If fact, when rallies are confined to channels it is a warning that it is deceptively a corrective rally that will surprise and break lower and not an impulse rally to greater heights.
I hold the rally in Crude to be “deceptive” because it is contained in a Channel and I expect it to surprise to the downside by taking stocks down with it.
I think that it is a very dangerous time to be long stocks.
Do you have downside targets? Crude is being manipulated higher to keep stocks from falling..ideal opportunity for Saudi to increase production by 2 million barrels as they will get $45 regardless of level of oversupply at this rate. I am now short the DOW at 18020 trying to figure out at what price level the FED will reflate stocks again leading to the next power rally.
In Elliot corrections Diagonal Triangles only occur at the very end of the corrections. The rally in Crude from March 5 appears as a Rising Wedge or Diagonal Triangle and is totally contained in a rising Channel (5th of c of C). This is a –double warning– that the rally from January is Corrective and will end with prices breaking impulsively below the January lows. If so, then Stocks could sell off hard for many reasons including a liquidity crunch/crisis. Throw in Geomagnetism and Sun Spots and I think that it is very dangerous to be long stocks at this time.
My mistake; April 5. I would like to see JH start a new article/report as this one is long in the tooth.
I see an end of trend in crude accompanied by extraordinary volume and levered by a massive divergence. The weekly picture shows the creation of a topside divergent pull taking the reigns from the massive bottom-side push. The weekly RSI has regained the +50 territory as price meets mega resistance. This is not a side show, it is a gigantic power play of a trend changer.
You have waked up ! Old man. ^+++++^
You have too! You only post charts!
Hello John Li..
Are you from HK or Singapore ?
Why only two options?
🙂
Your Last name is “LI”
and your english is very good.
haha…
I live in New York now.
This from spaceweather.com today:
SOLAR SECTOR BOUNDARY CROSSING: On April 28th, probably late in the day, Earth will cross a fold in the heliospheric current sheet–a vast wavy structure in interplanetary space separating regions of opposite magnetic polarity. This is called a “solar sector boundary crossing,” and it could trigger geomagnetic activity around Earth’s poles.
Now would be a good time for JH to start a new article/post but he might be waiting for a day of zero Sun Spots.
Today’s American elections (many voting participants from the financial districts of New York) combined with a major Geomagnetic event later this week could produce a “blow off” top in American stocks that imparts power to the adage “Sell in May and go away”. Some time soon, maybe this Summer, Sun Spot counts will go to zero too.
A euphoric “blow off top” of both Crude and Stocks might not end until May 3 for a “Tuesday Turn Around” (Chicago trading pit term). The down side may get impulsive with a surprising May Non Farm Payroll report (employment report) next Friday. Days latter the Sun Spot count could fall to zero.
John Li – thanks for mentioning those dates above. We discussed these dates during early March 2015, when I said that US stocks would become massively volatile during H2 2015 with declines of 12-40%. That has now happened.
Those dates are based on the typical ISN (sunspot monthly average) breakdown periods in previous weak solar cycles. I also said that they would cause the current wave of speculation to end during the time range Q3 2015 to Q2 2017, with Q2 2016 and Q1 2017 being the most important.
So here we are April 2016 and the ISN is in fact breaking down – on Monday it will be confirmed at significantly under 50: http://sidc.oma.be/images/wolfjmms.png
When it broke down under similar solar circumstances in the past (1832, 1885, 1896, 1910, and of course September 1929) it caused major market moves, but the direction of each move depended on other influences at the time. As an example, if SP500 were to repeat the 1920s bubble it would have to reach 3963 by April 2017 – but I don’t expect it to play out exactly like that, as these historical rhymes always fail once they become obvious.
Instead, there are several other reasons why I still think there’s a 90% chance of a US stocks mania continuing into 2017:
– lunar declination,
– relative strength of long term Bradley siderograph,
– oil’s 9.3 year lead,
– decennial pattern,
– relationship between lunar standstills and land prices,
– 70 month bull + 13 month consolidation pattern versus 64 month bubble pattern,
– other sentiment and fundamental reasons.
And Saturn (the gas giant most similar to earth in chemistry) is in the Galactic Center’s path next 16 months (Sag); as it was in 28,29…58,59…86,87; every 29.5 years a mania in asset prices.
Thanks – I hadn’t noticed that 29.5 year sequence, even though I have been using a 29.5 day cycles (which was one of the indicators of a SP500 bottom on 11 February 2016).
I also note that 16 month period – very close to the 18 months it typically takes for final manic phases (and of course that manic phase might well have started two months ago). August 2017 matches well with my final big date for the gold market, July 2017, and I think we are now very likely to see gold top by 22 May 2016 then fall to either 990 or 900 (Fib sequences from 1910 and 1800) by July 2017 to coincide reasonably closely with the top of a stocks bubble (Q2/Q3 2017).
Thank you Mark.
I was hanging on 4/1920 ISN of 24.7 off the 179.5 highs being similar to 4/2016 ISN of say 36 off the 146.1 highs. I am coupling this with the 8 year US presidential cycle aligning April to April swing highs, as we seek to replace a two term US president 1920/2016. The market peak 11/1919 would also correspond to the QQQ peak 11/2015 as well.
Earlier in the month, 4/2016 ISN seemed to be in the 20s rather than 30s, which makes the fit even better. Furthermore, earlier in the month, SPY did not make new ATH, and so the 4/2016 swing high argument seemed stronger as well. However, April 8th 1920=2016 has passed, and as you said this historical rhyme is failing as markets should already be falling if like 1920.
What do you see with lunar declination and/or lunar standstills and land prices? I don’t know much if anything about them.
I hadn’t looked closely at SC15 as it was a relatively strong one, but I see what you mean about April 1920. I don’t think the solar cycle alone can reliably tell us whether stocks will go manic or crash, but it is virtually certain that one or other will start soon.
Geomagnetic disturbance is the common factor behind these natural phenomena, and as you showed yourself a year ago here that fear-inducing disturbance will start to fade away soon with the ISN (although there is often a final short term geomagnetic spike at the ISN breakdown).
We discussed the nature of lunar Standstills a few years ago. Humans have always regarded them as very important – they spent hundreds of years building places like Stonehenge in order to measure them. At each Major Standstill there is a banking crisis:
– 1820 most US banks failed (Standstill 1819)
– 1837 several UK banks failed (Standstill 1837)
– 1857 Banking Panic (Standstill 1856)
– 1873 Banking Panic (Standstill 1874)
– 1891/3 Baring failure and Worldwide Crash (Standstill 1893)
– 1910/1 Panic (Standstill 1911)
… and then of course 2007/8 Financial Crisis (Standstill 2006).
Peaks in US real estate activity during this period were 1819, 1837, 1855, 1869, 1888, 1910.
The connection between banking panics and land prices is obviously that land is the primary security on most loans. Why it is almost perfectly correlated with the maximum movement of the moon in our sky – I don’t know.
Major Standstills are always followed by:
1) strong economic activity, as banks have been sorted out and borrowing surges (just when everyone is extrapolating the recent past into the future and predicting catastophe),
2) sustained low interest rates,
3) cheap energy,
4) new technological progress.
But this time our authorities did not allow the banks to fail, by fighting this natural process. And they are still fighting it…
Hi Mark
I have to confess that I don’t understand the details of what you and John Li are discussing but just looking at the dates and adding 18 to 2006 would give us 2024 when the next major catastrophe will end.
Am I right in that assumption, please?
Thx in advance
Interesting information, thanks for sharing it.
Online sources reveal that the cycle for lunar standstills is every c.18.6 years, which fits with the dates you mention above from the late 1800s to early 1900s, and counting forward would also seem to include 1929.
I tried to find some accurate dates online (hell of a job) and still looking. Accurate dates would be useful, as I understand it has to be 18.5 or 19, not somewhere in between, due to solstices. Where can one find accurate historical/future dates though?
(This site has a table entitled ‘extreme southern moons’ which could be the dates, but maybe not:
http://www.global-vision.org/astroarchaeology/archive/research/papers/sunmoon/index.html )
I noticed this site: https://chiefio.wordpress.com/2014/01/25/a-remarkable-lunar-paper-and-numbers-on-major-standstill/
It mentions the minor standstills, one of which has just happened late last year.
‘Lunar standstill
During the June Solstice the Ecliptic reaches the highest declination in the southern hemisphere, −70′-130′ When at the same time the ascending node has a 90° angle with the Sun in the southern hemisphere, the declination of the Full Moon in the sky reaches a maximum at −23°29′ – 5°9′ or −28°36′. This is called the major standstill or Lunistice in the southern hemisphere. Nine and a half years later, when the descending node has a 90° angle with the December Solstice the declination of the Full Moon in the sky reaches a maximum at 23°29′ + 5°9′ or 28°36′. The other major standstill or Lunistice, this time in the northern hemisphere.’
As a betting man, knowing what I know about the world of banks and debts, and seeing deflation hitting property prices in many prices, and with the ECB ready now to tackle and resolve failed banks, and indeed all FSB subscribing countries are now ready, I would be amazed to NOT see a banking crisis within a year from late 2015, i.e. this year. But I have no past data on the minor standstills. Roughly 9 years before 2006 was 1997 (followed by the dotcom bubble peak/crash).
Admittedly my knowledge of lunar/solar stuff is sketchy, but I would be interested to see the accurate dates for the last century, as I’d bet the episode in 2008/09 (disallowing market forces to clear the system), has actually been happening ever since the 1920s, but I would need the dates to verify that. Certainly central banking/govt policy in the US has been to bail out every time, rather than cleanse. So…..will that change? Not likely in the US for a while, but definitely in the Eurozone.
So, I still find it hard to envisage how a huge stock market bubble could develop in the next 18 months, other than a real shitstorm in Europe/China, and trillions flooding the US treasury and stock markets in fear. But in that event, how can gold tumble back below $1,000.
We will see, but all very interesting indeed.
Interesting information Mark, thanks for sharing it.
Online sources reveal that the cycle for lunar standstills is every c.18.6 years, which fits with the dates you mention above from the late 1800s to early 1900s, and counting forward would also seem to include 1929.
I tried to find some accurate dates online (hell of a job) and still looking. Accurate dates would be useful, as I understand it has to be 18.5 or 19, not somewhere in between, due to solstices. Where can one find accurate historical/future dates though?
I noticed this site: https://chiefio.wordpress.com/2014/01/25/a-remarkable-lunar-paper-and-numbers-on-major-standstill/
It mentions the minor standstills, one of which has just happened late last year
‘Lunar standstill
During the June Solstice the Ecliptic reaches the highest declination in the southern hemisphere, −70′-130′ When at the same time the ascending node has a 90° angle with the Sun in the southern hemisphere, the declination of the Full Moon in the sky reaches a maximum at −23°29′ – 5°9′ or −28°36′. This is called the major standstill or Lunistice in the southern hemisphere. Nine and a half years later, when the descending node has a 90° angle with the December Solstice the declination of the Full Moon in the sky reaches a maximum at 23°29′ + 5°9′ or 28°36′. The other major standstill or Lunistice, this time in the northern hemisphere.’
As a betting man, knowing what I know about the world of banks and debts, and seeing deflation hitting property prices in many prices, and with the ECB ready now to tackle and resolve failed banks, and indeed all FSB subscribing countries are now ready, I would be amazed to NOT see a banking crisis within a year from late 2015, i.e. this year. But I have no past data on the minor standstills. Roughly 9 years before 2006 was 1997 (followed by the dotcom bubble peak/crash).
Admittedly my knowledge of lunar/solar stuff is sketchy, but I would be interested to see the accurate dates for the last century, as I’d bet the episode in 2008/09 (disallowing market forces to clear the system), has actually been happening ever since the 1920s, but I would need the dates to verify that. Certainly central banking/govt policy in the US has been to bail out every time, rather than cleanse. So…..will that change? Not likely in the US for a while, but definitely in the Eurozone.
So, I still find it hard to envisage how a huge stock market bubble could develop in the next 18 months, other than a real shitstorm in Europe/China, and trillions flooding the US treasury and stock markets in fear. But in that event, how can gold tumble back below $1,000.
We will see, but all very interesting indeed.
Phew, that comment was eaten by wordpress initially as it had 2 links. Paging back saved it.
Here’s the second bit:
(This site has a table entitled ‘extreme southern moons’ which could be the dates, but maybe not:
http://www.global-vision.org/astroarchaeology/archive/research/papers/sunmoon/index.html )
Thank you Mark. This is very interesting. I agree the pattern is strong for UK and US land prices in general. I compared to the Case Shiller index and found the correlation to be there for the recent few decades.
If the new technological process is true, I can imagine Merlin in front of Stone-hedge performing new chemical reactions — perhaps scientists are night-owls and draw creativity from the moon.
My current positioning is a option straddle to capture volatility both up and down, in addition to my longer term small China short.
purvez – 2024 is the correct year. Major and minor Standstills are very different – see Gann’s notes in his Financial Timetable: http://time-price-research-astrofin.blogspot.ie/2012/03/wd-ganns-financial-time-table-extended.html
The years in the red band are Major Lunar Standstills; green are Minor.
Mark, many thanks for the WD Gann link. On the table that you mention there is a vertical line break and if you look at the red horizontal line there appear to be 2 Major Stand Stills in short order : 2004 & 2006. The text doesn’t seem to provide an explanation of this. Please would you be able to provide an explanation? Thx in advance.
purvez,
‘As the charts indicate, I’ve chosen a cycle so that the end points occur when the moon is in the region of her extreme southern (and northern) positions in her 18.6 year nodal cycle. When I first started this investigation I believed that the two cycles – the Metonic and the cycle of the nodes – were completely separate. However, during the course of the investigation, I realized that, since the extreme southernmost positions of the moon happen in the spring or the fall, the length of time between two major standstills can not be 18.6 years. I could see in the data that it switches back and forth between 18.5 years and 19 years. This raises the possibility that the two cycles could have been observed simultaneously, observations of one helping with the tracking of the other..’
from my link:
http://www.global-vision.org/astroarchaeology/archive/research/papers/sunmoon/index.html
The Gann chart is highly suspect, as are Mark’s earlier *dates* in my opinion, as they count in whole years.
The gap is because Gann’s chart (I don’t know who drew it) got so out of synch it had to be reset by losing a year, like a leap year, except a whole year had to be lost. Pick a year, any year!
It’s all very much unscientific, and one just needs to look at the legend to know that it’s not working and describing conditions from history, rather than modern life. I can’t be bothered, as it’s clear that Mark hasn’t been, but one would need to know actual dates to make any conclusions on correlations, and just look at the examples Mark has provided…..the dates are all over the place, sometimes the standstill is before the crisis, sometimes after. Pointless.
But even if you accept it all at face value (as Mark appears to), what’s strange is that the Gann chart shows that 2016 and 2017 will be years of low stock prices? So what gives? The minor lunar standstill impacts predicted in the charts can be ignored?
All of the above, plus plenty more, leaves me very sceptical of Mark’s predictions.
GM, I had the same thoughts when I saw the standstill data initially. Mark’s contribution is that standstill works for land prices and hence banks, and I do agree that the fit is better than with the stock market.
GM, I’m inclined to think of this subject (which I’m just being introduced to) as ‘guidelines’ rather than exact scientific fact …..and hence I’m currently giving it more leeway than I otherwise would.
Even just being aware of periods of time in cycles when things are moving in a certain direction (albeit broad) is still useful for awareness. Of course the danger always is that you start to ‘see’ things simply because you are looking for certain events.
For the moment I’m just trying to read up more on it, like you are but keeping an open mind.
Oil is giving a clear message to the market…the low was $26 so buy buy buy for the recovery ahead. Who cares about the glut..lets start a mania in commodities too!
Crude (and stocks???) rally is long in the tooth:
http://www.investors.com/news/get-ready-for-a-texas-sized-oil-spill-on-the-market/
Oil uptick due to inventories data. Market indices were unaffected by oil collapse, so why must they dance for a rally? Oversupply of fast foods should follow Apple miss. Oh no, bears also turning into vegans.
FED holds rates…stocks explode. Standard market action. Oil also exploding higher. Need dollar to strengthen if oil is going to go down. Stopped out of my DOW short thanks to the immensity of the almighty federal reverse.
In total, the Dow hasn’t really spent much time above 18070.
In terms of oil – remember Venezuela has barely enough cash to keep the lights on. The last figures I have on them is they are producing in excess of 2 million bpd – will they be able to keep that going?
J
FWIW, I am feeling a little more hirsute today – so will wait until later but am probably going to be shorting some QQQ, AAPL or whatever the opposite of what Krish is doing haha (I kid, no offence)
I don’t think I am going to be touching oil for a while tho, that is one wild ride that doesn’t make much sense.
J
I’ve gone short DOW again. The bulls did a great job today pulling the market up but i think as we move into May the market will drop. I guess this means Jeger will be going long…
LOL good one!
You’re feeling more hairy? How does that work?
I’ve bought some QID within the past 20 minutes @$30.59.
Awaiting a pullback in gold miners that may not come for months, or ever.
Still short FTSE as well?
Yes. Down to 5,200 on futures I reckon.
I am seeing weird action between the major indices and industries. Nikkei tanked last night, others did not. On the other hand, Dow is moving down today, while Biotech is up nicely. Hampson’s graph above on IBB shows that we did move down since his last post, but today would be counter-trend despite down indices.
I guess Nikkei was an inverse move to the Yen jump.
Other markets, perhaps retail bulls are becoming confused, running out of options?
Hopefully there will soon be nowhere for bulls to hide.
Good luck with IBB.
Could it be that the Lunar Declination Cycle (18.6 years) is not only causing the usual strongest of the four El Ninos that occur in it but also the yearly high in American Stock Indexes of 2015 –and– 2016 to be one Lunar Year apart (Delta Medium Ones as highs)?
Which index? Dow peak 5/2015 or NDX peak 11/2015?
DOW and S+P 500 indexes. I am looking for the yearly high that might be new ATHs next week but after that I think that a major Bear market will be on into 2017.
Pop.
http://www.cnbc.com/2016/04/28/reuters-america-exclusive-chinas-main-commodity-exchanges-have-ordered-major-institutional-investors-lacking-commodity-industry-background.html
I took my QID position based on short-term NDQ futures resistance at 4440.
But look back at a monthly chart to 2000.
Fascinating level.
Wonder if sterling will peak here versus the USD? Decent chance to add some juice to my QID.
Did this trade with Stocktrade, only £50 for the overseas trade versus several hundred charged by the evil Hargreaves.
Good call everyone…Krish, GM and Jeger….I finally joined the fun to with IBB down.
Nice move down for you in IBB today JL.
Fascinating read here. Abe & Krugan, planning to boost demand (despite demographics) via fiscal means. A hail of arrows!
Quite scary really, the madness of it. I feel inspired to write a post about it this weekend!
Got gold my Japanese friends?
PS I have asked the ECRI who shared this link if they are sure it is genuine, no reply just yet.
Click to access Meeting-minutes-Krugman.pdf
I think that a near term (Intermediate) low is in for the DOW/S+P 500 and that they will trade up to a new yearly high and maybe a new ATH. But instead of going long them I have gone long Natural Gas.
If the Shorts need to be burned not once, or twice, but repeatedly, before the major Bear market can get underway, then it seems reasonable that new ATHs are on their way in the DOW and S+P 500 stock indexes.
Yellen is concerned about Labor so Mr. Market may be looking at May’s NFP to start burning the Shorts by trading up to new ATHs (after the report next Friday morning) before the major Bear market finally commences in earnest. Before the next major Bear market can start as many Bears as possible have to be separated from their money….. its just the nature of the markets.
Let me know when I should start shorting please, if ever. Quite serious…we have all given up.
He’s a time junkie.
Beware the ending of the era of CB omnipotence or at least a dulling of its potency as credibility evaporates and fear of the consequential vacuum gains momentum.
Some consideration of RSI behaviour on hourly, daily & weekly can save much time wasting on endless and fruitless search for rationalised logic (sense). Correlate with other TA that works for you and maybe give up the Harvey Wallbangers whilst deploying resources to better effect.
Then maybe we will see less of the wild speculation that somehow makes sense but has nothing else going for it.
Price and time. SP500 is back at its most important price (2065) exactly at one of the two most important times of this whole solar cycle (the first ISN breakdown from its solar max range into a new lower range). The other important time will be the second breakdown due early 2017. These breakdowns have always been the cue for major market moves in the past.
But sunspot numbers will not break down completely yet; instead the new lower range will persist until early next year. Geomagnetic disturbance will also wane, but gradually…
From February 2012:
“It strikes me that the alignment peaks [Jupiter-Earth-Venus] correlate very well with geomagnetism peaks (as detailed in the last table on your “Timetables” page). Then, looking at the long-term DJIA chart (on your Ultra Long Term Models page) we can see that buying stocks at geomagnetism peaks during secular bears would be an extremely successful strategy – 1942, 1974 and 1982… They [JEV alignment peaks] appear to anticipate geomagnetism peaking during 2015, which would sit reasonably well with your other analyses.” https://solarcycles.net/2012/02/23/solar-cycles-and-astro-trading/
Geomagnetism did in fact peak first at March 2015, and then more convincingly during August to December 2015 – that is what caused the nervousness during H2 2015.
So what do the forthcoming JEV alignment peaks indicate for the next year or so? The three main peaks are Q3 2012, mid 2014, and Q4 2016, so neither sunspots nor geomagnetism are going to disappear quickly – both will wane only gradually throughout 2016 until sunspot numbers drop away again close to zero early 2017.
None of us alive today have experienced this before (sunspots and geomagnetism declining together) because all solar cycles during our adult lifetimes were relatively strong – ie. where a much more distict sunspot peak was followed by 2-3 years of increasing geomagnetism, causing a risk-taking period to be suddenly overtaken by a risk-aversion one.
This is the main reason why I have been saying here for years now that looking for a repeat of 2000 in price and time is the wrong approach. But we should get something new, and big, very soon – a weak spell for US stocks, especially between 10 May and 8 June, and then the start of a manic phase.
I appreciate Mark’s continued comments.
Mark, you write that we have never experienced declining sunspots and geomagnetism together.
I’d ask you (and others) to have a look a the charts on this webpage. The bottom chart (AP index progression) is described as being a measure of geomagnetic activity.
http://www.swpc.noaa.gov/products/solar-cycle-progression
Are you looking at some other data? Because that AP index does not show that geomagnetism is declining, in fact it’s been rising since 2013, and one could perhaps make a (weak) case that it has consolidated at a middle range for the past year.
I’m curious as to how you can predict:
‘neither sunspots nor geomagnetism are going to disappear quickly – both will wane only gradually throughout 2016 until sunspot numbers drop away again close to zero early 2017.’
What is the basis for this prediction? In regard to sunspots, your prediction does not align with the forecast from the chart, which shows a steady decline into 2019/20.
Apologies if my questions seem direct, but I just don’t see what you see at all, but I am keen to understand whether it’s your bias, or me missing your point or looking at bad data. How are sunspots and geomagnetism connected, or are they entirely independent of one another?
Thanks again.
http://www.solen.info/solar/
The site above has a monthly table for sunspots and AP.
It does show a big decline in sunspot numbers (to 38) which Mark has identified as moving to a lower range and bringing market change with it. I get that.
The AP number is steady at 8.7, on the low side, but it’s been at that level a few times in the past few years, and indeed lower.
I am really curious how one can predict the next month, or the rest of the year, other than by extrapolating the trend, which doesn’t always play out, as was the case in the big bump up during 2014.
‘None of us alive today have experienced this before (sunspots and geomagnetism declining together)’
2004-2010?
Either a mini or God forbid a full ice age onset? Not sure if equatorial zone should be the better place. But the madness of the collective human psyche does not detract from such hypothesis.
Otherwise some relief at the appearance of the hidden hand.
Mini or full-blown, a global thermonuclear war will (temporarily) warm things up a bit.
Please let it be a mini, although that will probably be enough to tip us over the edge.
Any suggestions for tropics locals would be appreciated asap.
Stay close to Mark, but it will cost you plenty…
http://tinyurl.com/zfcp23z
Holiday resorts are not the answer Peter_.
I will do research on where to be during the onset of a mini ice-age (for self sustenance).
It’s the security/political side of things that’s tricky, as well as the climate-related issues.
Plus I have no clue about farming!
Jeez. Sure I’ll find a willing local for the right money.
Just thought you might appreciate the story of a 6yr old going missing in the forest and being found alive after 6 months. Maybe you could survive yourself in such, push going shove. No problem, less demand the better.
I closed out my Dow short on Friday. There is still a chance of new ATH’s before we turn down. Some may be wondering how I can be shorting now after being so bullish earlier but I still do not expect a bear market yet. For me the bear market indicator would be a central bank sugar bomb which fails to rally the market to levels before the preceding drop. I want to see lower highs and not by only a couple hundred points…I need to see a high 500 point or more lower than the previous to be convinced central bankers have really lost influence. At the moment I expect this to occur at the end of this year or early 2017 but it could happen much sooner. No one knows as we have never been in such a position previously. Looking forward to this months trading as I am expecting more volatility.
Krish
We have been here before in some form other many many times. What the **** are you talking about? What are your decisions based on? I only ask because I am very worried about you to be honest, and don’t understand how you can risk money on thin air reasoning…….(seemingly).
J
How about this year’s high day in the S+P 500/DOW being the exact same day as last year’s: May 19. Wouldn’t that be a kick-in-the-pants?
I expect the Dollar and DOW to rally to this Friday’s NFP report. If the report is favorable then the rally in US stocks may not stop until the 19th just like last year (Buying the Dips is still the correct Trend).
That is also the high in 2008
‘The focus of the government has already started shifting toward fiscal stimulus, as those around the prime minister increasingly feel that they can no long depend on monetary policy. In fact, moves are afoot within the ruling LDP to start a campaign against the BoJ’s negative interest- rate policy because LDP lawmakers have recently started receiving petitions from their constituents in regional areas who want the government to stop the “out-of-control” BoJ, whose policies are hurting local lenders and their customers. Such opposition within the ruling party could tie the BoJ’s hands.’
Trapped now. Fiscal next. Boom.
Concerning Central Bankers: The Emperors have no cloths. (It is 1721 all over again. Buy those Tulips, buy those Tulips. Buy those tech stocks, buy those tech stocks).
Today at spaceweather.com
Right now, Earth is in an “aurora-friendly” region of interplanetary space. Magnetic fields in the area have a negative polarity. Such fields can open a crack in our planet’s magnetosphere, allowing solar wind to pour in and fuel geomagnetic storms.
Might this explain some of today’s crazy trading in Stocks, Treasuries, Currencies, Metals, and the Grains?
Everything’s possible in this world of ours, Richard I….that’s all I keep telling myself as wend my weary way through it.
The 2nd chance to get out (as up top here) just left on a leading index (JSE). Take something to overcome the weariness, the time for sharpening of wits is upon those of us that utilise them.
I am not long stocks. I think that being long stocks is extremely foolish at this time. I am only looking to short stocks on rallies; i.e., Sell the Rips.
Richard, good call not to be long stocks…
The north pole of the sun finally flipped convincingly after flip-flopping several times in the teens.
http://wso.stanford.edu/Polar.html
If this is not the peak, the solar model is greatly flawed, as every other event (solar max, etc.) has passed.
Peter_, yes the story of the 6 year old was nice, thanks. I am a tad skeptical about its truth however.
Well, the bulls still are calmly wallowing up at relatively high ES levels, not realising the peak was 20th April, but as we point out at this blog, plenty of signs of weakness unfolding everywhere else. My Ftse shorts are now within 0.5% of breakeven (still in the red), but my QID positions look healthy, and sterling looks to have (maybe) peaked against the USD, which is handy.
Any bounce today, of any decent size, and I will add some more shorts, tempted by copper & oil, but might just stick to the Ftse.
Good luck all bears.
Will gold be taken down with risk, as the USD gains? I suspect not.
I hope Mark replies to my questions, it’s good to understand someone’s reasoning, as it could be very valuable to all who read here.
$US index going for its expected bounce off the high probability 92 (1st) target, So $Au retrace parrots and now a projection for both hopefully with some similar probability can be examined. Will advise further…
Just tagged the pitchfork centre line on the DAX at 9840 (it didnt sail straight through),meaning less of a dramatic drop for the rest of the day.
http://fxpro.ctrader.com/c/JYNbn
If Crude is starting back down to new lows will it take Gold and other Commodities with it? Has Deflation not yet ended in Commodities?
Even though today’s ADP job report was lack luster tomorrow’s New Claims could point to a better Government NFP on Friday which could reverse stocks and attempt another run to new yearly or All Time Highs by the 19th or so. I will look to “Sell the Rip” higher.
For short term traders I don’t recommend being short into tomorrow’s New Claims as the trend has been for historical low numbers and if low numbers are reported I would expect to see another attempt to rally US stocks into Friday and beyond.
Hedged IBB now…we shall see if you are right on the rally. I just need vol to make money.
Added some more Ftse shorts this afternoon, 2 trades, averaging in at c. 6075 on the futures.
I see that Peggy’s guy Sean has a low at May 10th. Interestingly that’s when Mark sees weakness as beginning (til early June).
As long as there’s weakness, I’ll be happy enough.
Weakness in gold/miners would be very nice too please!
This is what I’m seeing at the moment on the DJIA since the 21st April high.
http://postimg.org/image/p86dkxqwx/
Once the Leading Diagonal is completed we should have a DEEP retracement to somewhere near where 2 ended before we get the ‘C’ wave down to complete the ABC from last May’s high.
‘Stop loss’ point would be ‘b’ top.
This one has been frustrating to call the ‘bigger picture’ but I think yesterday’s and today’s action have clarified things.
GL to all.
Sorry meant to say that wave 3 is a bit of a ‘dodgy’ one because it can be counted as having legitimate 5 sub waves but the 5th one there is not ‘text book’ hence I’ve counted it as a 3 waver. i.e. a double zig-zag….if you squint hard enough. LOL.
Nice chart
I have 76.4 fib around 17400 ish, further support around 17300 ish if overshoots & 16950-17000 at the 61.8 fib level.
I also have a falling megaphone from 27 April (top line) which appears to allow for a melt down to the 17000 area though I’m no expert on megaphone rules.
Will be interesting to see to see what happens today as Shia flip flops within the 17500-50 range again.
For anyone with a pair of big brassy ones (light open interest futures don’t scare the pants off of you) I think that American Oats futures are oversold and will rally this year to catch up with many Grains (Corn and Soybeans) and Foods (Rice and Sugar) that are already strongly rallying.
Stocks are not the only game in town. Soybeans have already rallied in a “3rd” wave. Today, Corn has set up to start rallying in a 3rd wave; Wheat has set up to rally in a “3rd of a 3rd”; and Oats has set up to rally in a “3rd of a 3rd of a 3rd” wave.
Should NA suffer from the coming La Nina then those wave counts could prove correct given that recent weather problems in Asia (India and Thailand etc.) and SA have already “primed the pump” for historical rallies in the Grains and Softs/Foods.
If we break 104.9 on QQQ I may add to my short positions, especially if AAPL closes below support today as well. I suspect that even if we bounce here, we will probably go much lower over the coming weeks and months. XBI was actually a possible long earlier, but it looks like it has broken down so far. A lot of the Biotech stocks will probably lose at least 40-50% of their value this year imho. Just be patient….
all imho ofc
J
Just as a heads up, unless we have some very heavy downside across the board, I may look to start buying FXI at around 30 for a longer term swing trade. Everyone is talking as if China is dead, but I don’t think so personally.
J
Not sure if FXI is hedged into USD, but beware yuan devaluation.
If I had to bet on one big macro event this year, it’d be a big yuan devaluation.
Good point, I don’t think it is as although it says its base currency is USD it also says:
Currency Risk: The Fund invests in other currencies. Changes in
exchange rates will therefore affect the value of the investment
I also have a GBP/USD currency risk to some degree.
What sort of scale of devaluation are you talking? Over the last 10 years I can see the Yuan has appreciated by around 18-19%?
Cheers
J
20-30% wouldn’t surprise me. Maybe less.
p.s. GM, think that may well be the right thing to do even though it is against my rules (which I break on occasion ofc). It looks to me like GDX is getting ready to break support unless its some NFP shenanigans for tomorrow. If they do break down, I don’t fancy FTSE much imho.
J
The dax didnt break down below the diagonal line shown attached : http://fxpro.ctrader.com/c/fWQbn
Gap at 9,000 looks….gappy.
Seasonal Sell fired on 5/02
Hey all. Free read, login-free post! Technical, candle and volume analysis of weekly, daily, hourly levels plus volatility and internals! http://navigatethemarketstorm.com
I’ve noticed that even though the solstice is only around 6 weeks away, it’s getting dark in the UK very early this year (or it seems that way to me).
Anyone else noticed this?
I’ve noticed it as evening golf rounds are having to be curtailed at around 8.40pm.
Sunspots effects? Or just my imagination?
SUnset was at 20:36 today in London, up from 20:34 last year and same as in AD 2102.
Worst “hey, look at me I play golf” post ever….haha
J
Thanks for the data.
Maybe it’s the sunspots affecting me.
DAX power rally has been confirmed. Good chance of a return to 10450+ now which will be a great point to load shorts. I’m long from 9890 this morning 😀
How has it been “confirmed”?
J
Was looking for a bottom around 9700-9800 and then a break above 10k which happened. Dow is powering ahead today too. Big drop coming in the next few weeks but maybe 1-2% further upside left in US indices until then. A bit more with Dax I think.
40 point gap up on the futures, then flat all day. Wow!
The gaps always get filled, so enjoy them while they last.
Peggy’s guru Sean had his ‘singularity ‘ yesterday BTW.
It was THE LOW, with ES projected to hit 1589 I recall.
SO, hope you were all short to catch that one!
We’re now in Mark’s weakness window, shame he hasn’t come back with a response to my questions. Mark?
A break below 9930-9940 would damage the bullish trend for the DAX so I have stop losses at breakeven allowing for some overshoot.
DAX: 12-50 sma cross overs…noticably some of the falls after the 12-50 cross are the same: http://fxpro.ctrader.com/c/zdZbn
New FED labor model points towards a Recession:
http://www.businessinsider.com/labor-market-suggests-recession-coming-2016-5
I am looking for a May 19 high (new ATH?) in American stocks before the Bear market gets under way.
I am looking at 5/12/2016 due to Bradley. Why 5/19?
Hi Richard
I think the “labor” numbers are really pointing to that what the Fed is doing finally is showing results. By pumping up the stock indices with direct intervention, fewer Americans than ever need to work due to not needing an income when their stockbroking accounts are showing such a good profit. From reports I have read, approximately 180 million Americans no longer need to work again in their lifetimes due to the Fed’s “wealth effect” interventionism. There will be no further QE though apparently, there will be QPC instead. This is where the Fed circumvents the middle man (stock and bond markets) and just transfers funds directly into corporate coffers and guarantees 4% net profit growth for all Wilshire 5000 companies for 3 years. (Quantitative Profit Contribution).
If you have not met me before and are American, the above is “sarcasm”. Sarcasm can be making a strong statement but you really mean the opposite.
All the best
J
Another power pump on oil today. Really struggling to see how the random prediction by EIA for Brent to hit $76 in 2017. If that were the case Saudi would ramp production by 2 million barrels and enjoy massive profits at the same time. Same with all other arab countries and frackers would be at it again. If it did hit $76 again I would expect US frackers to hedge production for 5 years and pump like mad! I am close to initiating a short position on oil as i feel a repeat of last year is likely with oil prices.
The EIA has no better idea than anyone else what the future price will be. Also, if Saudi rampe dproduction by 2 million barrels, we would be looking at $30 oil again most likely. The oil market fundamentals are complex, I would stay out unless you really have a handle on what drives the oil price. Hint: oil price is itself irrelevant, it is only what you can DO with oil that gives it its value. But, of course these days with ETP’s like USO, financials can take HUGE positions that warp the fundamentals (as we see now).
J
You probably all noticed it yesterday, but WMT fell out of its wedge and indicators starting to point to a bear market for that POS unless something changes drastically by the end of the week. That stock market wealth effect I alluded to – where are people spending their part time job money? AMZN?
J
AAPL following suit
I was wondering which way the Bradley 5/10 5/11 turndates point, and it seems like a peak, as I said above.
I am not Long Stocks. I haven’t been long stocks for weeks. I am only looking to “sell the Rips” in stocks. I am long some Ag futures. I think that a historical Bear market in US stocks will soon manifest itself.
May 19 was not only last year’s high in the S+P 500/DOW but also the All-Time-High. After May 19, I will get busy shorting US stocks with some gusto.
If JH hasn’t been financially wiped out then I expect a new post soon as I think that it would very timely. Maybe he is preparing to post it on May 19. Personally, I think that would be wise and could be very timely –and prophetic.
I would imagine that if John H had been financially wiped out then this web site would not exist.
Hats off to Richard Isaacson. I don’t know how you do it, but I think you are right on 5/19/2016. I have taken my considerable profits from my IBB puts. I am not sure if we will go up much, but my option premium will bleed away by expiration next week. Yellen is out again saying negative rates are possible.
I can always change my mind and short again tomorrow, but re-analyzing my position, I am not sure if 5/12/2016 Bradley was a bottom or a top, after SPY rallied to close up on the day and above any moving average.
Here’s another one from J Snyder of Alhambra which provides some AMAZING historical context to how we arrived up this proverbial creek without a paddle.
http://www.alhambrapartners.com/2016/05/11/unfortunately-it-was-only-a-brief-moment-of-clarity/
I shall read that purvez.
I’ve got out of the habit of reading Jeff Snyder, because it’s very repetitive, I don’t know how he does it. Always worth a look though.
Something I often think, and will today write: John Hampson, I really do hope you’re OK in terms of health, give us a quick comment so we all know please. I am sure you’re navigating these markets well, life’s physical ups and downs not always as easy. Best wishes.
And as always, thanks to those that still contribute here. Especially Freddie. 😉
Huh!!!???? Who’s Freddie? Have been properly introduced?
Freddie adds value to the blog by his silence purvez.
GM you are speaking in riddles now. I’ll try and decipher that message tomorrow when the effects of the nice wine has lessened.
DAX Target: http://fxpro.ctrader.com/c/Nklbn
If it can take out early May low, that looks quite feasible.
imho
J
Visit the free http://navigatethemarketstorm.com to read about multiple time scales and internals with 9 charts total! (no login required for this post!)
Mark,
For US farmland, the major standstill years of 1988 and 2006 were great years to buy, instead of sell.
DAX: I think we are in a down channel after leaving the bigger up channel:
http://fxpro.ctrader.com/c/WKubn
NDX: http://schrts.co/GqzmF1
Looks like a rally to 5/18/2016 indeed. Let’s copy 2008.
Here is a non-Andrews pitchfork DAX chart I’ve been using: http://fxpro.ctrader.com/c/LK1bn
I have taken profits on my Grain Longs. I think that a Medium top is coming for both the Grains and Crude (possible the Metals, too, as the Dollar turns higher).
I am looking to “Sell the Rips” in American stocks.
Dollar rally is corrective only, the downside that follows will test all belief systems.
The charts are finally waving familiar things, but CB leaders cannot read sign language…
http://barestbodkins.blogspot.co.za/
If you ill – get well soon; if you well – don’t get ill any time soon
I think that Stocks are returning to the usual Lunar Cycle in that Stocks will bottom with the Full Moon this Saturday and rally back up to the New Moon in early June. I think that the USD is also going to surprise by rallying strongly with Stocks as Commodities, including Crude and Gold, take a tumble to the downside.
I think that the rally in Stocks to the next Full Moon (in early June) will be the final “second chance” before Stocks go over the cliff for a sustained Bear Market.
Note the timing of June’s New Moon to the June NFP report (American monthly Non Farm Payrolls or “jobs” report).
And this from spaceweather.com today:
“NOAA forecasters say that a co-rotating interaction region (CIR) will hit Earth’s magnetic field on May 19th. CIRs are transition zones between fast- and slow-moving solar wind streams; they contain strong magnetic fields that often spark geomagnetic storms. But that’s not all. Following closely behind the CIR, a high-speed solar wind stream will arrive on May 20th.”
I wouldn’t be surprised to see a deep spike low this week in American stocks that only does another hard reversal followed by a rally that fools those who think that “this is it” and add to their shorts at the bottom just like this past January, 2015, and Fall, 2014.
I think that that another rally to June will be the final “second chance” before the Bear Market in stocks really begins to show itself.
What happened to the 5/18/2016 sell signal?
5/19/15 was last year’s high and the ATH. I am looking to “Sell the Rips” regardless if 5/19/16 is an Intermediate/Medium swing low or a Long term high. It looks like Delta’s Intermediate 3 point is not going to be a high but a low. I calculate it as due 5/19/16 regardless whether it is a high or a low.
I now hold that this year’s high was a Delta Intermediate Inbetween Point that brought in a Medium Inbetween Point and that low Intermediate 3 point is bringing in low Medium 1 point and I now look for high Intermediate 6 point to bring in a second Medium Inbetween Point as a high (but not a new ATH) and then the Bear Market will get going in ernest this Summer.
I was long the Grains such as Corn but have taken profits. Not wanting to go long Stocks but only “sell the rips” in stocks I have reversed my Grain trade and gone short some Grains such as Corn. I will continue to wait to short stocks. Patience or “setting on ones hands” can be a virtue in the markets.
If Richard is correct, we might see Ftse and NQ100 fall down to their next fib levels before the end of the week, c.5834 on Ftse futures and c.4200 on Nas futures.
But they need to break through the fib levels that have been holding as support for the past couple of weeks.
Easy to see this happening. Easy to see a bounce there, not much of one, but a chance to close out shorts and re-load a little later.
Oil and gold falling together whilst stocks rise into a rising US dollar…not sure all of that can happen simultaneously, but we will see. Oil must be close to topping, I’d be interested in a EW count on oil.
Taking SPX500 index with three significant highs each with its own integral RSI divergence (chart just added at http://barestbodkins.blogspot.co.za/) the concept of 2 lesser peaks following the significant one stares into my eyes and whispers that Richard could well be onto something here.
I have been comparing two years of dailies of the DOW to the S+P 500. Comparing both of them to each other I think that in May, 2015, the 18 point rotation L-4 was a high that was brought in by a high M-1 and both brought in a high 6 point rotation Inbetween Point and Super Long Term point 6.
In February, 2016, an 18 point rotation low L-7 brought in the 6 point rotation L-2 as lows.
In April, 2016, an 18 point rotation L-8 was a high that was brought in by a high M-1 and both brought in a high 6 point rotation L-3.
Note that the S+P 500 low 18 point rotation L-7 in February, 2016, decisively exceeded its low L-5 of August, 2015, whereas the DOW’s barely did. Note also that the DOW’s high L-8 in April, 2016, decisively exceeded its high L-6 of November, 2015, where the S/P 500 clearly did not. Therefor, taking the two indexes together yields the truth about the 6 point rotation and when its 2 and 3 points came in –both are late with the 2 latter than the 3 compared to their respective due dates and standard deviations about each separate due date.
The ATH and high of 2015 was a M-1 and one Lunar Year latter (one calendar year minus a month or so) the high of 2016 is also another M-1. If the current low I-3 is bringing in a low Medium point then it would be an Inbetween point and that means that its M-2 must be a high and could be a new yearly high and/or a new ATH (but I doubt that). “If” low I-3 is bringing in a low Medium Inbetween point then I would expect high I-6 to bring in a high Medium 2 point that is not a new ATH nor a new 2016 high. However, after high I-6 brings in a high M-2 stocks will “crash” to the low Super Long Term point 7 not due until 2017.
I believe that this is the “correct” solution of the Delta rotations for the S+P 500/DOW which can only be arrived at by comparing two years of daily closing prices of both together. If I am correct than after the first half of June American stocks will begin their long awaited decline.
I have taken the plunge and am long DOW. First entry was at 17454 and second at 17383. Expecting a fairly good rally to 17800 region which is top of the triangle from the recent high. After that I will likely load up on shorts and take a long holiday in a place with no internet so I cant take profits on the shorts too early (ie. I think a big drop is due shortly). Lets see how it plays out from here! GLA
This is very interesting. I see 5/18/2016 as a swing high and 5/29/2016 as a swing low. However, it is possible that my model is inverted, so I am keeping an eye out. I believe that June will begin the decline as well, after all the weak hands are whipsawed.
Fed minutes offer nought for $US bulls, so I expect the resumption of $ trend (down) and thereby commodity prices up. Could be a pause til next Fed waffle show for the more serious addicts, depends on the sanity factor out there where nothing should ever be assumed.
John Li’s last post which talks about ‘highs’ and ‘lows’ on specific dates is what has sparked THIS post of mine but it is not directed only at John Li but all others who also seem able to arrive at ‘turn dates’.
Please can one of you explain ‘HOW YOU DO IT’?
I can count waves and to a rough extent project possible turn VALUES but how the heck do you guys get ‘dates’ or even ‘date ranges’? This is a bit of TA I’ve not been able to get my head around and I would very much appreciate some guidance please.
Thx in advance.
I follow a guy on twitter called ZigZag, he works on time patterns that repeat over and over.
I guess John Li and others here use solar/lunar influences, which is also time-related if you think about it.
Separately, this tweet keeps it simple for a H&S failure or success on SPY:
https://pbs.twimg.com/media/Ci1j3wVWkAAMaib.jpg:large
I don’t count waves.
I don’t usually posts dates, but I find 5/18/2016 interesting because it is after the 13F filings of hedge funds are posted for Q1. In 2008, that market had swing highs in the S&P 500 after the 13F filings at that time. This time, Soros revealed his puts and long gold.
In addition, we had the Bradley turndate 5/11/2016 and the market has so far shown that that was the peak.
I am sure others have different indicators.
Surfers got guidelines when impulsing such as #5 here… http://tinyurl.com/z2c69xk
But these simple geometrics can become like a Medusa hair day for the non-enthusiast.
Meanwhile we know cheaper and cheaper money in ever increasing volumes is never gonna be an ad-infinitum thing, something has to be produced be it the original expectation or its alternative. Time to come in is overdue, and I don’t look forward to systemic failure stuff. One thing is the possibility of making mega chingching only to find it redundant, retired, history, aarrrgh
A triangle?
http://screencast.com/t/D7G0HvwB
Just got to be patient I reckon. Then down hard.
I suspect that around the World there is a growing shortage of Animal Feed as more and more people are trying to eat better by eating more animal protein (meat). With most of the Grains at multi-year lows means that they are making Delta low Super Long Term points. Throw in a falling Dollar and any and all weather problems will cause the Grains to soar.
Delta’s S+P 500 Intermediate rotation point 3 was clearly a low as it came in yesterday which by my calculations is it’s average due date. I was looking for it to be a high that would make this May’s high about the same time as last year’s May and ATH. Last year’s May and ATH was a Delta Medium One point and, a Lunar Year latter, it did it again which is a rarity. Why do I think such? Because One’s don’t want to come in together and my experience shows that when they are near each other (this year) they come in opposite of each other. With the I-3 as a low (yesterday exactly when due) points to I-2 as a high and I-1 as a low and a late low. Why was the I-1 late? Because it is coming in opposite of high M-1 and is repelled so hard away from the high M-1 that not only is it a low but a late low. I suspect that I-1 being a late low is pointing towards low I-3 bring in a Medium Inbetween point so that high I-6 will most likely bring in M-2 but not a new yearly or ATH.
After high I-6 and M-2, in the first half of June, the long awaited Bear Market in American Stocks will be on and in a very big way. There may also be a very big Investment Rotation out of Stocks and into Commodities like the Grains etc.
You are right. I stand corrected. I am now net long IBB.
May my capitulation prove to all that this is indeed the peak.
Just opex stage-management to save da boys this week.
Watch out next week I reckon.
I hope you get back on board the bear train before it gathers too much speed.
Have a good weekend all, it’s 12 degrees and raining in SW England, bloody solar cycles!!
You could be right and I could be wrong as I frequently am. But I am not jesting. I stopped out and went slight long. I join Barry in heaven or hell. I agree with Richard — that is to say, the big crash will indeed come but a latter day (not even month).
Sorry I meant Krish, not Barry. I hope Barry is well though.
How’s it going over here?
Purvez!
DAX: Which way is it going to break? http://fxpro.ctrader.com/c/wPLbn
We should get the rally to 17800 starting this week and maybe even completing this week. There is a chance we could go even higher to 18k+ but I would use that opportunity to load up on shorts. I not then its possible the big wave down may have already started.
OPEX was pretty weak last week – nevertheless managed to regain some key levels to ensure as many people lost out as possible. JL, not sure what has changed your mind? To my eye, nothing much has changed over the past month – most markets still in a downtrend for now?
J
Not sure myself Jeger. I am probably wrong. I mirror Krish. We both realize that the top might be in, or it might not, but in any case think a rally to the holiday/EOM/Yellen speech would be par for the course.
But I am trading IBB/XBI, and it is up again today. I realize other stuff is down.
Hi John
I don’t think any of us are sure about most things – I certainly hope not – I was just wondering how you reached the conclusion. Is it price-based, moon cycle based, sun spot based or something else? The reason I ask is that as you know almost all my decisions are based on the tape, and from my view nothing much has happened in a month. I am currently short AMZN, QQQ, FB, GDX, GLD, NUGT – long a couple of UK stocks and still haven’t seen my 30 number for a starter long position in FXI 🙂
I guess I am pretty short right now although keeping it relatively light.
Good luck!
J
I am stopped out. That is probably the best reason. Yellen speech/Holiday/Turn-Of-Month are all academic reasons to wait for a better short entry point.
This is one is for dear old Nic, and anyone who believes that CBs can do anything (other than keep a stable currency):
http://www.fuw.ch/article/the-business-of-central-banks-is-like-pornography/
(spoiler: they can’t).
Fama, one smart cookie.
Thought i may have got it wrong but the bulls have roared back to life today after the open so 17800 is still on for now. Would welcome a little pumping action by the FED to boost us a little higher.
Roar = meow…….?
Roar = roar. They will be meowing soon though. Taken 50% of profits at 17625 on DOW and leaving rest for 17800 with stop at break-even.
Gone short DAX at 10012. Will build as/if it rises. Central banks are still successfully playing their manipulation games so being careful with position sizing.
DAX 12-50 sma 4hr cross over pending: http://fxpro.ctrader.com/c/SrYbn
John Li – I am fine…. Just watching the market go sideways – seemingly endlessly….
I used to check this site every day, but that was also when John was posting charts more regularly – and I always enjoyed seeing John’s new perspectives on looking at data…
But he hasn’t for a long while, and since the market isn’t moving much, I have nothing new to say and just stop by here to catch up every so often…
And even then, mostly just looking for Jeger’s comments… He and I seem to see about the same things, at about the same time, using different methods.. So appreciate the confirmation (or not) that he offers.. And Jegers is a MUCH better and disciplined trader than I am, so again, a good reason to check in once in a while here…
That said, still holding shorts via ETFs, (SPXU / ERY / TZA / TVIX) along with short gold stocks via DUST and JDST… I’m not as leveraged short as I was, and have taken plenty of lumps on those open and covered positions….
The good part of that is that I’ve built up cash levels again, so I’m ready to get heavy short again, when that trade appears timely… I think we’re close, again, (and I’ve been wrong before – haha) but just being patient for now, with nothing really new to say…
Maybe Mark is right… Less is more… 😉
I am glad you are doing well and have a cash position for the big short when it comes. I believe that is invaluable. I also hope that JH will return soon with updated analysis.
I respect Jeger a lot, and know he will make money. For all I know, FB/AMZN can tank while IBB rallies and we can both be correct. This month is my first down month in 6 months, and I respect my stop more, but come June, after Memorial day, I think more fireworks might come. Volumes are pathetic right now, so I can see why no one has much to say. The calm before the storm I hope.
I still have positions, short China forever, but hedged, and in such a small leverage that the Chinese govt cannot get me — I hope…I suppose they could halt trading for 3 years and make me pay the borrow on my short for a long long time. I hope we don’t get WWIII.
The thing that really bothers me is that I expect the waterfall to wrap up before the end of the year, like in 2008. (Sure, we got a dip after in 2009) With tax loss selling and an election, it seems like a good theory. However, we are running out of time for that view — and to mention the solar maximum and lunar minimum last year becoming distant memory.
Thanks guys – likewise.
A couple of things I just want to mention. I am not waiting for “the big short” or endless waterfall declines if they do come. This is because those events generally start with a down trend or in some cases a gap down that gets retested blah blah and therefore looks innocuous and difficult to “wait for”. If you really look at the early 2000’s and 2009 declines and most of the bear markets since then on a granular resolution of 60/120 min charts or something like that – generally if I am honest with myself did I spot anything coming from week to week? Probably not….it is very easy when looking back. As it happens I did fine, but I think I could have done a lot better and I want to to continue to do a lot better in the future. Recently as we have seen, the QQQ’s have held up pretty well whilst FANG have not. If you look at Biotechs, the moves we are seeing now are tiny compared to what they have gained in the last 7 years. In the larger picture I expect a lot of those individual companies to lose 60-70% of their value in the not too distant future, and although this seems cataclysmic, it would actually be a health correction to some, but also a return to vaguely same PE levels for some of the constituents at least. The point I am trying to make is that it is easy to spot the past waterfall when it is laid out in front of you in the charts, not so easy to navigate when you are in the boat looking for white water:)
The second thing, and vaguely interesting thing perhaps is that generally speaking there is some reason for waterfall declines, even if bear markets are generally much shorter and more vicious than the bull cycle, as they tend to snowball (in my view). With that in mind, I would really take a look at the default levels in commercial/industrial loans. Bad mortgages are easing, but the former are snowballing, I think from memory we are about 75% of the way back to the peak in 2009. Additionally, and it could be too early yet – but the very expensive end of the London property market has been puking now for almost 6 months, quietly and in the background with 10 times the amount of properties over £xmillion for sale compared to the annual numbers in the last few years. London prices in general though are up 13% YOY, which from what I hear is mainly 2nd home buying with cheap credit. The top is puking (not filtering through just yet as not sold), the middle is leveraging right up…….it looks to me like we are back to the “this time it’s different”…….but sriously look at non-performing commercial loans and how they are snowballing if you are looking for waterfall declines. a trigger is needed imho.
I want to be positioned in accordance to what I see in the charts when I see it. I am not waiting to see DOW down 600-1000 points on a day or whatever to take a position. You will never be sure whether it is real or fake. There are always opportunities long or short, and as long as you can put a stop somewhere that makes sense to your trading – who cares whether it is long or short? For the moment, it looks like QQQ is contained by the 108.3x high so I have added short exposure now with a tightish stop just btw lol.
p.s. I have been waiting for 30ish on FXI before going long, its up 2+% today – have I missed out????:)
GLA
J
Thanks…a short post to mention what is happening on the other side of the pond today:
(Bloomberg) —
Purchases of new homes in the U.S. surged in April to the highest level since the start of 2008, pointing to a robust spring selling season for builders, Commerce Department figures showed Tuesday.
According to Zerohedge, this is a 17 sigma positive surprise. I have no idea how anyone can get it so wrong…but rate rise coming? Scratching my head…Mark will be right here, real estate is a buy overall due to the moon, but I suspect coastal cities follow the sun.
I forgot to mention in my short post above that $50 oil is not going to save a lot of the tight oil players in the US – so I am also short FAS as an insurance policy…..
J
And ~THAT’S~ exactly what I was talking about earlier…. 🙂
In looking at charts last night, FAZ has reached a point where it’s looking attractive to me, and that’ll be in the mix of shorts added next…
Wasn’t really looking for a 200+ point up-move today, but regardless, it’s tempting, and made a note to myself last night that FAZ was going to be the ETF…
It doesn’t bug me a bit to know Jeger’s already spotted himself a short FAS position… 😉
‘endless waterfall declines’
Are they the opposite of ‘new all time highs’?
Where does infinity end one wonders?
Bull rallies like this need shorting, each time bull energy is expended to a lower high.
There is no need for a trigger for a decent plunge, just sellers and ex-buyers selling, for a multitude of reasons, into a price vacuum, bid-less air. Soon, very soon IMO.
Added short Dax and closed Dow longs. Time to start building short exposure!
DAX up 300 points since this morning! Completely bonkers so I had to start shorting. Is there a valid reason for the rally?. I’ve seen nothing in the news…
More dumb retail perma-bulls taking on the scrag ends of institutional selling?
make that 400 points rise in less than 24 hours! Added another short this morning at 10180 which will be my last for the moment as I’ve entered my shorts too early I feel. Made the common mistake of blindly selling based on the crazy rise than waiting for the correct signal. I am expecting a wave down to below 9000 over the coming months and expect little upside if any. S&P still has a chance to hit 2116 as mentioned by Peter Temple in worldcyclesinstitute so there could be more upside short term before a large drop commences.
forgot to say Peter does expect a full retrace of yesterday before the final wave to 2116. I was a bit skeptical of his 2116 target but it very much is on now.
The only reason we know about for sure is that there are more buyers than sellers…..chart looks bullish to me for now but there are far better opportunities out there than that at the moment imho.
Don’t add too much to your shorts from yesterday, you may get that 10400 rally you were sure was going to happen a week or two ago….
J
Haha it will be a bummer if it does get there as I completely did not trade for it. The consistent weakness in the DAX negated that scenario for me but it may be back on again…
Big congratulations to Greece for securing a big loan to repay a different loan. Secretly the greeks know their entire debt pile will be forgiven so they are very smart in milking as much money as possible from Europe while they can.
It won’t be forgiven, but they will have no option but to default.
Serve the lenders right too.
Attn: John Li
Just fwiw, I took (less) profit on my FB and AMZN shorts – mainly because IBB looks pretty bullish at the moment – decent overhead resistance though at around 290 in my view and will reconsider if and when we get there.
J
Thanks for the update. The market seems to be up-down-up-down daily, which I think is a phase transition from Feb-March (Up Up Up). It did the same thing 10/2007.
Bottomline: I will still stay safe until I see down-down, though I think the market is scheduled for down today (up yesterday) and will hedge my longs too. No prize to be “right” in a whipsaw market. I am keeping it small.
Shame i didnt hold my DOW longs until 17800 as its destroyed that level! Bulls in control again so time to hit the sidelines apart from my very badly timed small shorts on the DAX which I will just nurse over the coming week. This rally seems to have legs so S&P 2116 is now a likely target in my view. Shorts at that level should do well.
Gartman has gone long! Warning warning big market drop imminent. http://www.cnbc.com/2016/05/25/run-for-cover-if-youre-short-on-markets-gartman.html
Gone small short at 17865 based on the Gartman indicator. Hoping he doesn’t get it right this time after a series of awful market calls.
I am short AAPL here, with a tightish stop. Will probably know by the close whether this is a goer or not…
J
Pump pump pump off we go again this morning. Looks like this is one of those straight line up rallies with little or no decent retraces. DAX is possibly now on the way to 10700 so losses taken on DAX and DOW short closed at breakeven. I underestimated the significant power the bulls still hold as did many i guess. Maybe Gartman is right for the first time in over 1 year!
It has to be pumped for the rate hike? + from twitter.watch out for 616 the devils number of a month!!
http://fxpro.ctrader.com/c/139bn
Well it just shows that unfortunately the market manipulators still have significant price control. I maintain a bear market is impossible until they lose the ability to control price. Only corrections will be possible. Still hopeful that over the next year their price control ability will fade significantly but until then shorting will always remain a very dangerous trade although quite profitable if timed well. On the flip side longs will also be highly profitable if luckily entered just before a manipulation event. Its very easy to tell between a manipulated rally and a normal rally…the normal rally will have a good retrace before reaching the peak which is something this rally completely lacks.
This 2-week rally? Yawn.
Study some market history krish, you will learn much.
I have studied history. I looked for years where we had similar monetary policy to today and found none. Therefore history is not particularly useful in predicting the future market moves. The DAX has risen 5% in two days on no significant news noW. The Bears have been hung drawn and quartered so maybe we will turn down soon once the Bulls are satisfied they have destroyed enough bears.
‘I looked for years where we had similar monetary policy to today and found none’
Whilst monetary policy is irrelevant, you clearly spent a good few minutes on your studies.
Currently on the sidelines. Looking to establish shorts on the DAX and DOW when the charts provide a trade. I’m ideally looking for a 10% correction to exit my positions. Still think the S&P will finish the year above 2000
Thanks Krish.
Pride before a fall, GM…
I am losing track on your position, but today is a tight range day on the SPY and shouldn’t change anyone’s view.
El Ninos usually give rise to La Nina’s and La Ninas mean heat and drought for the USA. Going long American Natural Gas (companies) might be a wise trade for the Summer/Fall. (I went long American Natural Gas futures today.)
Delta wise, both stocks and energy futures are on their way to high Medium Two points after both making low Medium Inbetween Points. The “proof” that stocks is on its way to a high Medium Two point is in Crude and Heating Oil futures Medium points solution. Natural Gas is a laggard and just made its low Medium Inbetween point today on daily Continuation charts.
Is Copper beginning to rally in an Elliot 3rd wave? Are Heating Oil and Crude ralling up to a Delta high Medium Two point? If so, are the S+P 500/DOW ralling up to new ATHs and Delta high Medium Two points? Short Term Traders want to know……
Today, Daily continuation charts of –American– Natural Gas futures prices are just beneath its 200 day sma for the first time since November, 2014. A sharp rally may ensue should it trade thru its 200 day sma especially with the long awaited “rebalancing” at hand.
The wisest trades may be to “buy the dips” of the Canadian/Australian/New Zealand Dollars.
Aren’t currencies a function of buying power and interest rates? FOMC hiking soon, dollar stronger, other currencies will go down.
John, here’s a link to the US yield curve. Only use nominal rates. Use the compare function to see how the curve has flattened over the past 2 years+.
The Fed can’t raise rates, and if they do the odd quarter, it’ll soon be undone.
The market wants low long-term US treasury debt, it sees trouble ahead.
The only way it can buy these USTs?
With dollars.
Hence……
https://www.treasury.gov/resource-center/data-chart-center/interest-rates/Pages/Historic-Yield-Data-Visualization.aspx
As we approach the long weekend, I have gone flat on everything, and small short on China. The crash is near. QQQ/SPY might rally a little bit more to hit stops, or they might not. Keeping powder dry.
What makes you think a crash is near with the recent price action. It will take a lot of effort to drop the S&P below 2000 (i think it will happen though) and then we will get to 1900 or may be a little lower before an explosive buying spree powers stocks back up above 2000 again. I see no evidence of a crash anytime soon but a correction is a very likely scenario.
I don’t have a system that tells me if the recent price action is bullish or bearish. How do we tell a short squeeze from a new bull market? I am sure smarter people here will know, or Richard Isaacson can tell us if crash starts 6/2016 or 2025.
Volume?
Free Read, no login required!! http://navigatethemarketstorm.com
Hey storm, if you want to pay me $50, I might have a look?
Sounds a good deal yes?
Is the rallying USD reinforcing a US stocks rally? Should EUR/USD break down below its 200 day sma will that mean an accelerated rally in the S+P 500/DOW to new ATHs –and– Gold/USD collapsing down to its 200 day sma and below –possible to new lows?
Price action points most strongly to the S+P 500 Delta I-3 as a low that brought in a low Medium Inbetween Point. Question is will the S+P 500/DOW exceed their recent high M-1s while going up to their M-2s just like Heating Oil/Crude have done/doing? If so, then it seems the odds are high of new ATHs in the S+P500/DOW stocks indexes.
New Thought: The Seasonal “sell in May and go away” becomes counter-Seasonal and the S+P 500 rallies up to a new ATH. Why, you ask? Because American Ags are rallying in a rallying USD. Oh me, oh my, what a benefit of rising US Farm values in a rising US Dollar has to S+P 500 stocks. This also means to expect Gold/USD to break down to new lows as money flows reverse from stocks-to-gold and back to stocks all over again.
Delta-wise this points to six point rotation S+P 500 L-2 having already come in May, 2015, with low L-3 coming in only one month late in February, 2016, and with the expectation that L-4 will be a high in December, 2016. This also means that high M-1 brought in 18 point rotation L-8 with the real possibility that the recent low I-3 not only brought in a low Medium Inbetween Point but also an early low 18 point rotation L-9 which would grealtly explain the recent daily “take off” from those combined low points.
This may rub some die-hard Solar Cycle adherents the wrong way but it is possible that Delta’s Super Long Term Point 7 has come in one month earlier that its known 100% range with low six point rotation Long Term point 3 in February, 2016. This does agree with the observed pattern going back over 200 years of the Super Long Term wave points trending higher within the 19 year cycle of always trying to top (before the crash) with point 14 –which isn’t due until the year 2025. However, this could agree with the weakness of the current Solar Cycle and it would be in agreement with a Crash-of-Crashes into the depths of the Mini Ice Age (which is the larger Cycle of the Solar Cycles).
Seriously, the extreme focus on the current Solar Cycle may be entirely misplaced given it’s weakness and location at the very end of the larger Mini Ice Age Cycle (+200 years) which is itself comprised of Solar Cycles. Delta may be pointing the way forwards in that not only is the current Solar Cycle to weak but also that the Crash into the Mini Ice Age will be one for the history books as it will happen in Delta’s usual Super Long Term Inversion Window (or Crash Window) just like 1929, 1987, and 2006-2007 which will not start again until the year 2025.
Some are expecting a maxi rather than a mini ice-age Richard.
I know, we are due, but I don’t like to go that far. The Celestial Bodies effect weather on Earth. I consider Delta to be a double stripped down version of a much greater Celestial Body/Motion theory of market behavior on Earth. As an example, a major drought has effected Brazilian second crop Corn which is rallying US corn futures; and, major floods have hit Argentina Soybeans which has rallied US soybean futures over $10,000 per individual futures contracts. For every contract of Soybeans, which is the standard 5,000 bushels, that American Farmers sell, they will now get an additional $10,000 which is a sizable amount of money for Farmers in the Heartland from what they would have got just two months ago.
India has suffered a rare two year decline in annual Monsoon rainfall (drought). India’s Monsoon season starts in June and already this year India has recorded new all time record high temperatures. This year could see another year of reduced Monsoonal rains or even out right Drought. Eight years ago, out right Drought in India resulted in World grain prices doubling and tripling. With a large American crop harvest and very high prices would be a boon to the American Farm sector which would put very great pressure on the S+P 500 to rally and the USD to rally (while Gold/USD drops like a rock). This agrees with Delta’s S+P 500 six point rotation Long Term point 3 being a low and its 4 point to be a high which is due December, 2016. It also strongly points to its low Super Long Term point 7 coming in with L-3 which means that it came in one month earlier than its current known 100% range and with L-3 being one month late. This helps to explain the recent unusual “take off” of the S+P 500 from its low I-3 which strongly implies that it brought in not only a Medium Inbetween Point and but an 18 point rotation Long Term point 9 (early).
Counter Seasonal moves are usually outsized moves that tend to go parabolic and my particular Delta solution agrees with the fundamentals of the Celestial Bodies’ caused weather on Earth.
I was with you when you said 6/2016, but if you are now saying 2025 peak, I will have to disagree.
Ponzi blog made me aware of wmp :
‘Massive Bailout’ Needed in China, Banking Analyst Chu Says
By Paul Panckhurst
http://bloom.bg/1TzAnS4
Bloomberg
Concider Taleb’s turkey analogy..of being fed and fed and feeling increasingly safe as it is fed more and more.. until it’s neck is wrung by the hand that feeds it
Finally seeing a bit of weakness. Too early to tell if its the start of a corrective move but we will see this week whether a top has been made. I have taken a small short on S&P in case this is a top. Stoploss set at 2110.
Looking for SPX downside pattern break to add shorts. Expecting unidirectional action, tight trailers, 5hr Rsi (14) about to cross. Some must ride.
Looks like this week will be a “profit taking” week until the NFP this Friday. Both Ag futures and US stocks are turning lower.
Rambus turns bearish on gold, bullish USD.
https://rambus1.com/2016/05/29/weekend-report-100/
Fascinating overlay chart of the EUR index v gold in his post, makes you want to check the meaning of the Welsh name ‘Euros’ on google…do it.
Peter_, will your RSI faith bear fruit? We will soon see. I reckon USD squeeze higher, gold (in USD) lower.
I hear China had a flash-crash today. Only 10%, recovered quickly. Nothing to worry about. 😉
Yup, its one of those Bilderberg moments again. Month end, long weekend, but sure this thing is stretched. Can it be stretched further on ultra low volumes – indeed it can. Not much exchange of power in that, so the trip wires are waiting for the first move. May the smartest megalomaniac turn into a Norwegian Blue parrot.
$USindex has daily Rsi divergence indicating more upside to nearby 99, but I doubt enough for a double top. Gold has a short term Rsi indicating a turn, probably be a twitch to sideways, should give way in $US, but resilience has already surprised. Twitching season.
Weekly $USindex Rsi disagrees, i.e. happy to resume downtrend here. I always go with weekly until swept aside.
I never did get my entry at 30 for FXI…….maybe just as well lol
J
yeah today hurt
This year the Bilderberg group meet is at the Taschenbergpalais Kempinski Hotel, Dresden, Germany from the 9th June – 12th June. On the secret agenda there is popular favour for what to do about Trump and progress with rigging the Brexit vote.
The press and public will be kept away by redirecting all public security resources, and at their own cost as usual.
The level of control is normal and helps everyone to reflect on what control is and what western world illuminati power is for.
Apparently quite a few people are still needed, so mass extermination is not yet popular on this years agenda.
There willbe no reporting and no one will say anything. You will now delete this website and erase your memory or the Illuminati Gestapo will find you & kaput.
The powerful will always control the masses. Twas ever thus, they are better and brighter, the fittest of our species.
One is likely to be duped though if one considers Bilderberg as the true font of power in this world.
That resides hidden in the shadows, whilst being obviously apparent, if one has eyes.
http://www.theguardian.com/us-news/2016/may/20/donald-trump-sheldon-adelson-israel-trip-campaign-donation
With an agenda of moving toward a single world order and related system of control, where democracy and transparency cannot help to do it we need something secret, something selfish, something unethical… https://www.youtube.com/watch?v=HBypAFQ3ZCk
Taschenbergpalais Kempinski Hotel
DAX 4hr: http://fxpro.ctrader.com/c/FQMbn
Thanks Peter, I note they still have rooms available at £95 or so per night. Bargain.
I started an AMZN short position at 725.2 – some negative divergences, rising wedge etc etc. And NFLX longer term short, looking for gap close around 50.
J
I think that we are at the start of a Super Spike in Cocoa.
December, 2016, corn futures did a remarkable rally today to new highs of the move. So what, short term traders say. Oh and look, the S+P 500 turns around to positive while the DOW lags. New Crop Corn futures is the most important American Farm product that brings in the most money to the Heartland of America (and the S+P 500).
Clearly, SC 24 is NOT, NOT, NOT, going to Crash the American S+P 500 even though it did crash Crude and some Emerging Markets like Brazil etc. –Time to move on and admit the obvious.–
Doubled up those shorts, just got to when things come together like this. Expect crash less 1%
Indians believe and are relying on a La Nina to end and reverse their two year drought. Today, the usual first day of the Indian Monsoon season, saw US grain futures know better by their rallying onward.
The El Nino was not as strong as the Artic Oscillation. The negative AO persists and will overwhelm any La Nina just like it did the El Nino. This means the Drought in India will continue and worsen.
High Grain prices with large yields will see a great deal of money flow to the Heartland of America which will rally the S+P500. “Sell in May and go away” is based more on falling US Farm values and less on Geomagnetism than is generally understood. This year will be a “buy in May and hold on for dear life” as the US Farm economy rallies strongly with large amounts of Grain and ever higher prices as a third year of Drought (and disaster) takes over India.
SC 24 is not going to crash the S+P 500 like it has already done to Crude and some emerging markets.
Instead of Planetary Weather lets look at the revival of the American Farm Sector (and S+P 500 stock index) differently. The latest Cattle on Feed report showed an unexpected large increase of Cattle taken off of the range and put into Feed Lots. Yesterday, the NOPA report showed an unexpected large increase in Soybean crushing. Hmmm, that is interesting.
Argentina is the largest Soybean Meal exporter. Argentina has suffered a radical decrease in Soybean production which has curtailed their exports of Soybean Meal. Brazilian Corn production has declined so much that Brazil is expected to start importing USA corn. In fact, the shortage of Corn in Brazil is so great the Chicken Farms can’t get chicken feed –at any price– and tens of thousands of birds are dying of starvation. Truly amazing. With worldwide demand for animal protein growing ever larger, Soybean Meal futures have been the “leader of the pack” in the on going AG market rally.
Usually, this time of year, American Farmers drive Ag prices lower by over production. But not this year. This year Ag futures are going counter seasonal and are rallying. This means a revival of the American Farm Sector and, thus, the stock index known as the S+P 500.
Nice to see a mention of solar cycle 24 on solarcycles.net, that doesn’t happen very often nowadays. There is indeed very little chance (<10%) of SC24 causing a US stocks crash during 2016, but that's not because the usual "solar peak = speculation peak" has broken down – its because we have a weak solar cycle for the first time in living memory. In fact the interaction of sun and moon has not been like this since mid 1885 (weak solar max and Minor Standstill).
It has been increasingly obvious for at least four years that SC24 would be weak, and different to what we have been used to (see comments during April 2012). It is possible that SC24 could merge into SC25 without a normal deep minimum in-between – the first signs of a new cycle beginning are high-latitude reverse-polarity sunspots. See S5158 on 04 March 2016 – that was an active region which did not subsequently develop into a full sunspot group, but it shows that a new solar cycle could be simmering under the surface: http://www.solen.info/solar/images/AR_CH_20160304_hres.png
This interaction (sun and moon) and several other factors (eg. movement of the sun around the barycentre due to the outer planets) indicate further speculation into the 2025/2027 timeframe, but in won't be a simple straight line upwards – there will be a huge stocks crash in the meantime, but that will be after we've seen a huge bubble first (SP500 450-1106-1509-1837-2166-2566-3225 by Q2/Q3 2017, then a steep decline of around 40% to below 2000 again).
Two short and medium term cycles (set up by the gradual difference between solar and lunar timing) show a mixed period for US stocks this summer, until they both turn positive together during early August 2016…
Mark,
This is very interesting as usual.
Can you explain what this series of numbers are? 450-1106-1509-1837-2166-2566-3225
Thanks,
John.
Thanks, Mark. Informative –
Mark,
Reading this,
http://wso.stanford.edu/Polar.html#latest
My layman reading is that 92Sf means that the south pole is reaching solar minimum levels, while the north pole is still in progress. Therefore, we might not get a true minimum, as you said, if the north/south poles remain out-of-phase.
I can’t reconcile with S5158 which is in the north pole. If we are at a new SC25, it should start with S5158 at the south pole, which is ahead of schedule. Do I have the poles switched?
Thanks.
Richard I,
Thanks for that, Brazil has had a load of problems with 10% reduction in chicken production so far and probably more to come. I must admit that I don’t follow it closely as I don’t trade ags very often.
I would like to make some comments regarding your statement that the “American Farm Sector” will revive the S&P 500. What sort of timeframe are you talking about? It was only in January this year that there was a glut of Corn and Soyabean, now the picture looks a little different with prices seemingly basing over the last 6 months after a 8 year bear market and rallying perhaps 20% off the lows. I haven’t really looked at this in much detail but what sort of exposure is there in the SP500 for this “revivial effect”? ADM, Deere, Monsanto some other industrials? Will these be able to stave off a wider sell-off if it occurs? I have some doubts on this, but as you have not been very specific in terms of timeline and so on it would be interesting to hear from you.
Thanks
J
The S+P 500 is trading sideways to its Delta low I-5. That means that it will most likely shoot higher to its high I-6 and possible up to a new ATH this very month of June.
The Monsoonal flows over India are not from the Bay of Bengal but from the Arabian Sea and flow from the SW to the NE. This isn’t happening and the Monsoon season starts on June 1. By June 15 if the Mosoonal flow doesn’t start then the Ags will most likely explode higher like in 2008. Currently, it is so bad in India that the equivalent of the entire US population (300 million) are finding it difficult to acquire mere drinking water let alone water to bath in etc. In the past 100 hundred years, two years of back-to-back drought have only happened three times.
Ironically, many Large Specs in the Ags are going to be right for the wrong reasons just like Yellen and the FED. Many Large Specs are unwavering long Ag futures based on an expected La Nina causing Drought in the USA. But that is not likely to happen. What will happen is a third year of Drought in India and prices doubling or tripling like with the 2008 India Drought. Ironically, both class of the Large Specs heavily long because of La Nina and other Large Specs heavily long because of another expected India Drought are both Targeting June 15 for consideration before even thinking of taking profits, or not, for greater profits to come. That will greatly help the S+P 500 to surge up to a new ATH to Delta’s high I-2 (and M-2?).
“(SP500 450-1106-1509-1837-2166-2566-3225 by Q2/Q3 2017, then a steep decline of around 40% to below 2000 again).”
Mark, thanks for that. I don’t understand the above (amongst other things if I am honest). What are you saying here? We will see all these prices by Q3 2017 or some of them? If so, which ones?
For what it’s worth, I also think we will see between 450 and 3225 by the end of 2017…..;)
J
We were last at 450 in 1994…but the low is 435, so 450 by itself doesn’t seem significant in terms of an extreme low.
July 2016, Soybean futures have exploded higher this morning. Soybeans were already in “backwardation” which is rare. They were in slight backwardation with yesterday’s close. Today, that backwardation is radically increasing and that means that the market place is seeing a shortage in near term (World) supplies. Commercial capitulation hasn’t happened in may years but if it does Prices go to the Moon as Commercials panic and try to buy their way out of loses and product that they can not deliver on.
Note that I have already posted that I think that there is a growing worldwide shortage of Animal Feed.
Another rare event is happening this morning. World Sugar futures are trading up such that they look like they will soon be in total backwardation just like Soybean and Cocoa futures already are. This points towards today’s early morning rally in Soybeans is also happening because of rising expectations of another Indian Drought and Ag prices going into major bull markets for a year or more just like what happened in 2008 onwards and not solely because of expectations of an American late summer drought caused by La Nina. Every day that the Indian Monsoon delays is another day that Ags will rally and rally most strongly.
In my humble opinion it is very unwise to be short the American S+P 500 but to expect it to rally for the remainder of the year, and beyond, as its Delta low Super Long Term point 7 came in early in February with its low L-3.
It’s always interesting to read your hypotheses Richard.
Unfortunately they have mostly been proven wrong by time passing (e.g. your new US economy driven by low energy prices).
Was it 2 weeks ago you were suggesting ‘selling the rips’, yet now you are suggesting rallies for the remainder of 2016.
You are, quite literally, all over the place.
But do please keep posting.
Mark was expecting a weak phase between 10th May and 8th June, so take some salt with his predictions also:
https://solarcycles.net/portfolio/targets/#comment-72271
Maybe we crash into 8th June, that’d be cool.
GBPUSD, failed at 23.6 fib level:
http://screencast.com/t/rwUqunugJq
Brexit dead ahead? Parity?
I literally do not understand whether there was a reply to my questions there or not…haha. It is like a robot writing posts through a Monte Carlo device, using words at random…….?
I hope Mark comes back though, even though we are disgracing John’s blog by keeping it alive….
GLA
J
Re Monte Carlo, who are you talking about?
Brexit – The Movie – most informative, worth viewing: http://tinyurl.com/zpc48o8
I observe such factual information is absent from the stay case as presented by the mainstream media and puppet politicians, which is not surprising when people have never heard about Bilderberg or that some of those guys own and control the mainstream media between just a few of them.
Meanwhile, yet again, the markets respond to the foretelling of my charts. If I look at my charts through a crystal ball will the crystal ball become more valuable?
Peter_ sadly not. There will only be one of 2 outcomes. Either your crystal ball will crack or get confiscated.
Hey, all!! I’ve been gallivanting between Bratislava and Vienna, soaking up some culture to curb my otherwise very philistine ways. The former is in an ex-communist country trying very hard to rid itself of those shackles…..and succeeding. Delightful place and people with a manageable history and culture.
The latter on the other hand is a severe Over Dose on all things cultural (particularly Music but not limited to that solely) to the point where you get concerned to turn a corner lest you are confronted by yet another museum of ‘something’. Despite the HUGE amount of culture here the main highlight for me was a show at the Spanish Riding school. Those Lipizaner stallions are the most gorgeous I’ve seen.
Good to see the blog is still active. I need to get back into peering at charts through a microscope but a broad look suggests that I missed out on a number of nice moves during the last week and a bit. However since the market hasn’t gone very far in any one direction the potential for more such moves remains. Yummy!!!
Just to help re-orientate myself as to the big picture….this is what I see on the DJIA :
http://postimg.org/image/ghjpins4b/
Oops don’t know why it went all squiggy. Here’s a better one:
http://postimg.org/image/mtwbzw42j/
Welcome back p.
Nice looking chart.
Cool trip. Chart too. If you agree that the ath was end of primary impulse wave 3 then your count shows still in primary corrective wave 4 being a flat (a=3,b=3,c=5) looking for end of the b which itself is 3,3,5. When deciding between the alternative counts out there I see alternation would expect primary 4 to be sharp, Also indices of the family with clearer patterns have seen the primary 5th as ending diagonal that failed to make new ath. But as an alternate view it is worthy for analysis confirmation that it is not the preferred count. Even looking through my crystal ball it is the same conclusion for me.
Why does the once respected BDI indicator of global trade no longer indicate anything? viz: http://postimg.org/image/8okbi3ygr/
Could it still be worthy of its previous reputation or did it somehow disgrace itself?
Thanks for the welcome back GM, Peter_. To answer your question about alternation Peter_, the way I’m counting from the Mar’09 bottom is that :
W-A = Mar’09 to Apr’10
W-B = Apr’10 to Jul’10
W-C is what’s been going on since then. W-2 of C is from May’11 to Aug’11 which looks like a zig zag hence W-4 of C can be a flat.
However the fly in the ointment is the increasing size of each successive wave within C. It’s almost like it’s being ‘blown up’. W-3 was enormous and so is W-4.
But I’m happy to consider other counts.
Regarding the BDI I don’t follow it all that much but I suspect it is also suffering from the heavy handed battering of the CBs. It’s trying to tell the world but the world AIN’T listening.
FTSE making a powerful rally today. My bearish scenario for that is slowly falling apart. DAX and DOW should hopefully start dropping this week before a final push higher into mid June for the final top.
For over 10 years they worked together and reaped the mountainous rewards destined for the 1% whilst generating a wealth effect for the middle order and misery for the rest.
Then newnorm momentum slowed and made further nonsense of no value
But as a humbugod you can only take & take from the masses or from the other humbugods
Brexit = EU collapse = humbugod loss. The New World Order belongs to the humbugods
They not goona lose boy, not without a nuclear winter and even then they will win
Over the past several weeks I have gone from “selling the Rips” to “buying the Dips” especially in deep deferred AG futures. Why? Because planetary weather trends over the past several weeks strongly support a revival of the American Farm Sector; otherwise, I would still be looking to short American stocks for a crash that I no longer expecting to happen. Instead, over the past several weeks, I have changed my view that the “sell in May and go away” will be wrong as a Counter Seasonal Rally is underway that will catch Short Sellers by surprise.
(Zero Sun Spots for several days).
Has anyone besides me noticed that Copper looks like it is starting up in an Elliot major 3rd wave? What say you stock short sellers?
+PM’s yup. It may interest that my current hinge point on markets is the Nasdaq composite index Rsi (14) of 1st April where (for me) a higher reading will confirm your take. However,I am inclined to the opposing view of an ongoing rollover unless that hinge point flips otherwise.
Not only have ALGO (momentum) funds dived into the AG futures markets, recently, but it was reported, today, that Brazilian Farmers have begun to Hoard their Crops. Last week, Chinese Hog futures went to new ATHs as did Brazilian Corn and Soybean futures (priced in their own currencies).
In 2008 India suffered a major Drought. Because of that Drought, Merchants and Farmers the-world-over started hoarding grains/crops. That resulted in a two year Bull Market in AGs that saw many double or triple in price. As more Farmers around the World start hoarding their crops prices are going to soar especially with Momentum Funds buying ever more as prices rally higher and higher.
To better understand the coming price behavior of AG futures study: The Adam Theory of Markets.
American Farmers will benefit the most as will the American Farm sector along with the American S+P 500. All of this has changed from just several weeks ago (Planetary Weather changes caused by the motion of Celestial Bodies etc. of a much larger theory of Solar Cycles and Delta that is not yet understood.) (So there).
Given that the AGs, Copper, and Crude are going higher then hasn’t the time come to “buy the dips” in the Australian and Canadian Dollars/USD (in addition to the S+P 500)?
You mean the same copper that’s down 2.75% today as I type?
Yeah, well, buy that dip then.Good luck.
I just took profits on many of my Ag futures longs. Many are historically over bought by Large Specs. I think that US Treasuries are turning back down so the USD will turn back up and a wash-out of Ag futures could ensue especially with historical net longs by Large Specs in many Ags. With so many Ags at historical net longs all it takes is one “correcting” and they will all “correct. It simply isn’t worth it at this time to give up such large profits. I will look to reenter after the corrections.
I am not long Copper but I am considering it. Some think that new lows will ensue in order to complete larger downwards Elliot counts. I am keeping my eye on it for the potential of a major rally as the US Farm economy rebounds this year taking the US economy with it.
Here is an interesting analysis of the solar cycle and sun spotless dates. We just had the first spotless date since 2014 and more significantly it is only the second spotless date since 2011.
http://www.vencoreweather.com/blog/2016/6/4/300-pm-the-sun-has-gone-completely-blank
DAX chart update: http://fxpro.ctrader.com/c/vDhbn
The dax sma 12-50 downward cross has been cancelled.
My bear scenario is now firmly off the table. I still favour the downside but I am now open to a significant rally across all indices. No position for me until the direction is clearer.
BAAAAAAAANGGGGGGG goes the DAX. All confirms my theory no sustainable crash is remotely possible in the current monetary climate. Corrections are the best the bears can dream of. Timing the swings is proving to be very difficult.
It would be fascinating to be inside your brain, a place where a one day +1.5% gain in the Dax confirms your mad monetary theory. Must be quite exciting in there.
Seriously? Krish? I rather get into the minds of those that predict all-time-highs and all-time-lows in rapid succession.
Yes, be even more fun in there for sure.
haha
Maybe you should focus on what is exciting in the stock market. For example the Dow breaking 18k could result in a big breakout which would be lovely to see. My trade plan is to go short until 1825-1850 S&P and then go long until year end for a target finish of 2100. 500+ S&P points up for grabs me thinks. I will be truly amazed if we spend any significant time below 1800 S&P this year. Only problem is identifying when the bulls are done with this leg up.
I have taken profits on all my Ag longs. I am no longer Long any Ag futures. I am expecting a steep and sharp “correction” in most/all of them and it simply isn’t worth it leaving such nice profits on the table as it becomes “every Large Spec for himself”.
WTI Crude is in a Rising Wedge. A sharp correction lower looks imminent. Should the Ags and Crude correct lower it would greatly raise the odds that the S+P 500 high I-6 is in with its high M-2 and will be going lower to its low M-3. It should be noted that the S+P 500 low L-9 might not have come in with its low I-3 and a Medium Inbetween point and is coming in with its low M-3, instead, which means a much large “correction” to the downside this Summer before the Bull Market to new ATHs and on to high L-4 this December gets going in ernest.
Agrees with my views. What is your downside target for the S&P on this CORRECTION? Will be fully loading long into year end at the bottom i hope with the blessings of Yellen and Kuroda.
Correctly solving Delta’s “rotations” is difficult. After that, their is the further solving when the points come in with each other. I am solid about the Rotation solutions which is rare to have and it is rarer that except for the Short Term Rotation that all of the evens are highs. Now the problem is when those high even numbered points are coming in.
It is possible, but not statistically probable, that the low Super Long Term point 7 came in this past February. This means it most likely has not come in, yet, and that means then when it does it will be at prices lower than this past February.
Six point Long Term Rotation point 3 being a late low this past February is not a problem with that larger trend still being down to Super Long Term point 7 due next year. This would tend to mean that six point Long Term Rotation point 4 coming in early instead of this December. Of course, the early it comes in then the bigger is the expected down move to low L-5 which might be coming in with SL-7.
So here is what is starting to make the most sense given that all the rotation even numbered points, except the Short Term, are highs. There had to be a Medium low Inbetween point to “buy the time” to bring in such an early high six point rotation Long Term point 4. Thus, the high M-2 is averaging in a late high eighteen point rotation Long Term point 8 with an early high six point rotation Long Term point 4. This means that once highs I-6, M-2, L-8, and L-4 come in (but not at new ATHs) the major Bear Market in the S+P 500 will be on in a very big way.
Given “market conditions” and my experience in using Delta this is what I think is the best solutions for both Delta’s many rotations and when those points are coming in together. Now you see why so many who blindly commit generations of inherited wealth at Delta lose
Looks like today was it for the FTSE. And probably the Nasdaq too. May see a little higher in the S&P.
Next up….after all this patience at the top, when will we know the drop has reached it’s lows?
In a trending scenario when the wave count (and fibs often) is looking for a turn then divergence of the Rsi will usually both predict and confirm it,especially when differing tick periods give agreement.
when everyone gets super bearish again. That will be when to heavily buy all indexes for the full recovery into year end.
Krish
How do you know when “everyone gets super bearish again”? How do you trade like this?
Thanks
J
Stagflation (stagnation/inflation) is rearing its ugly head.
Near term, I expect the DOW to exceed its April 20 highs just like the S+P 500 has done. However, I have gone to 100% Cash. Now, I am looking to short Treasuries as I think that Inflation is starting and stocks will soon top and start a steady long decline in a Bear Market.
The FED may be trying to “get ahead of the curve” in what they know but won’t admit to and that is Inflation has returned. This would explain their seemingly mindless desire to raise Interest Rates.
The FED has declared Victory in maximizing Employment. The FED’s focus is no long on Employment. The FED’s focus has turned toward Inflation. The FED can not be seen as having lost control of Interest Rates. This is why the FED is raising Interest Rates: Inflation has returned.
So much confusion.
Firstly, the market sets rates not the Fed.
Secondly, please just look at the yield curve, it is flattening.
Inflation (currently) is non-existent.
How can you short equities and USTs? The money has to go somewhere?
I think that Elliot and Delta wave counters need to turn their attentions off of stocks and on to US Treasuries. Over the coming months I think that Treasuries are going to “lead” stocks lower.
Even though Inflation will benefit some stocks the decline in Treasuries which means a rise in Interest Rates will end up hurting more stocks than Inflation helps so that the broad stock market indexes will decline with rising Inflation –and– rising Interest Rates (falling treasuries).
Note that the “volatile” “Foods and Energies” (FED speak) futures are rallying, and, rallying strongly for the Grains of late.
Dow 18k broken! I hope everyone is thinking the bull market is back and ready to roar because it would mark the top and I have just opened my first dow short at 18005.
Delta-wise, it is possible for a new ATH in the S+P 500/DOW. Why? Because the S+P 500 trends towards Delta’s even numbered points. Notice that since the year 1779 (the year of a low SL-1) (the Delta book starts in 1805) all Delta Super Long Term even numbered points have been highs and stocks have been steadily going up the entire time. High I-6 bringing in a high M-2, L-8, L-4, easily has the trending power to bring in a late high SL-6. But none-the-less, the most important Delta rotations, in my opinion, is the six point rotation Long Term point 4 coming in six months early after L-3 came in one month late. This means the time is opening up for an extended decline but it doesn’t mean a “crash” as there are no meaningful Inversion Windows (crash windows) until the Medium Inversion Window next April/May.
Another Delta perspective is for stocks to decline from a high Medium 2 point to the next Lunar Year Medium Inversion Window of April/May, 2017.
So, this year, while a high M-2 brings in L-4 and SL-6, next year a low M-2 brings in low L-5 and SL-7 for a Lunar Year decline.
Purvez — I count the Dow same as its brothers since the megalomania crash of 2008, see it here…http://postimg.org/image/by62at2p7/
The turn is upon us because when anyone dares to say it they get shouted at – simple.
Thanks, interesting; near your “B” I got out of stocks and never looked back. I have posted about stocks since then but I haven’t traded stocks or stock index futures from then until now. I do expect new ATHs for the S+P 500/DOW but I am not trading for it. Yesterday, I took profit on my AG futures longs and went to 100% cash. This allowed me to drop all emotions and take a broad view of the markets this morning. Having done so, today, I started shorting Treasury Futures which is the only position I currently have.
Delta’s T-bonds SL-25 is due the month and I think that it is a high that is corresponding to Delta’s S+P 500 SL-6 that will also come in this month of June even though it be will over a year late. I think that a sharp sell off in Treasuries will be seen as a “rotation” out of treasuries and into stocks that will cause a new ATH in stocks that finally brings in SL-6 (late) when in reality treasuries are started in a major Bear Market after making their high SL-25. Then, treasuries will “lead” stocks lower, for months to come, as the reality very slowly sets in that the Stagflation of the 1970s has begun all over again.
New Concept: Is the “Seneca Cliff” for US Treasuries about to begin?
I think that Crude is on its way to new ATHs. I think that, soon, Middle Eastern Sovereign Wealth funds will have no need nor desire to reinvest petro dollars in US Treasuries. I think that recent American politics has removed the “desire” while rallying Crude is removing the “need”.
JH, I hope you have recovered and are well rested, and ready to enlighten us for the 2nd half of 2016.
–This is the most important post that I have ever done in the little less than two years I have posted on this blog.–
I believe that US Treasuries are going to fall in a Delta triple Inversion Window besides a Super Long Term point decline. That means a triple wave Crash in addition to the greatest wave point decline.
I think that Delta’s T Bond high I-11 is bringing in a high Medium Inbetween Point along with a high Long Term 1 point and the Super Long Term point 25. This means the initial decline will be an Intermediate/Medium/Long terms overlapping Inversion Window. This is extremely rare. The last time I saw something like this was when I correctly predicted a Stocks Super Long Term low Inbetween Point in the summer of 2006 (for the first time in history).
Physically, in reality, the reason for such a triple crash is that American Politics will cause just about anyone and everyone to dump their US government debt holdings (US treasuries). Initially, I think that the decline will be misunderstood as a “sector rotation” out of treasuries and into stocks. This will result in the S+P 500 high I-6 bringing in M-2, L-8, L-4, and SL-6 as a new ATH. But as treasuries continue to crash stocks will reverse and follow treasuries lower.
Thanks for the headsup. Are you talking about shorting TLT? Should I buy puts on them? Which strike and expiration?
I don’t give “advice” because I am an American without the governmental privilege (license) to do so. If I did I would be at risk of destruction by imprisonment.
The last time that Americans were this Politically Polarized was the American Civil War. But without referring to Politics there are other fundamental reasons for rising interest rates thus falling treasury prices. In the fourth quarter American Labor productivity fell while Labor cost rose 5.4%. In the first quarter American Labor productivity fell again and Labor cost rose again by 4.5%. Looking solely at rising Labor cost of 4.5% means inflation of no less than 4.5%. With inflation at no less than 4.5% means that interest rates need to be above 4.5%. Looking solely at Labor this is the very definition of Stagflation.
Americans have mislead about their Crude production increases of the past five years. It wasn’t because of horizontal drilling and fracking. It was because of the (intense) standard vertical drilling in the “sweet spots” of new oil fields. This means that the radical increases in American Crude production are over. With ever rising world demand, Crude prices have begun to rally to new ATHs which is very inflationary.
It is possible that the FED already knows all this and is trying to be perceived as the leader by no longer being concerned with American full employment but has already turned its focus to Inflation. This could lie at the heart as to why they have begun a cycle of increasing Interest Rates.
Ironically, the ECB’s new corporate bond buying program may backfire by turning the flames of Inflation into a raging inferno.
And by-the-way, the Reserve Bank of New Zealand just refused to lower Interest Rates. The result was that the New Zealand Dollar versus the USD just exploded skyward to new highs for the year. Why? Because the market had priced in another interest rate cut and was caught by surprise when it didn’t happen.
The Reserve Bank of New Zealand is not stupid. Not only do they have housing prices on the way to the Moon but a tidal wave of Inflation is about to hit their shores with rising food and energy prices.
This is another clue that an international trend is underway of no longer lowering interest rates but of raising interest rates to counter rising energy and AG prices. As reserve bank after reserve bank takes the clues from the FED there will be no more lowering of rates but the raising of rates and that means falling US Treasury prices.
John LI, don’t listen to him.
Money is/will flow into USTs, as we see today.
Bill Gross (2011/120 and Richard Isaacson are both premature on this.
Richard,
Interesting post. Thanks for sharing your thoughts.
What’s your time frame? That is, when do you expect the bond market to begin its decline? And after bonds start declining, how long do you expect stocks to continue going up before they too join the bond market and head lower?
Do you have a price target for SPX new all time high?
And finally, how long do you expect the decline in bonds and stocks to continue? Are you talking weeks, months, or years?
Thanks in advance!
Personally, I think that the imbalance in the bond market is as greater or greater than decades ago when George Soros became an overnight billionaire shorting the British Pound.
Currently, non-US pension funds can not met their obligations to their beneficiaries. Because of the current policies of the ECB and BOJ they are stampeding into the long end of US treasuries. They are doing this without doing their “due diligence” of American societal trends. They are about to be handed their heads on a silver platter. Why? Because multiple American Societal Trends are causing American Labor to reduce production while increasing costs: Labor Stagflation. Soon, there will be an increase in the “inflation expectations” component of the pricing model for US treasuries that will cause a corresponding decline in “bid”.
On a side note, WTI July Crude rocketed above $50 and has set back today to test support at $50. As I already posted, I think that America can no longer radically increase Crude production; therefor, I expect support at $50 to hold and for WTI Crude to resume its rally to new ATHs. This is another powerful inflationary indicator that the “inflation expectations” component of the pricing models for US treasuries is going to be adjusted upwards.
‘Soon, there will be an increase in the “inflation expectations” component of the pricing model for US treasuries that will cause a corresponding decline in “bid”.
Not so soon. Another couple of years yet.
A lot of different theories here from one person in a very short time frame. I do think the bond markets are a basket case but tbh I think most of them are including SM. It won’t stop me going long when I think it appropriate, but at the current time the market is not really going anywhere and hasn’t for a while, I think I have done 2 trades in a week. Hopefully I won’t be asleep by the time things start to go somewhere.
J
I am not sure if it is a TRADABLE basket case though. For Japan for example, I am convinced that the JCB will just buy 100% of the market and then forgive all debt. Will they lose? Yes. But will bears win? No.
Agreed, it is quite tough out there at the moment – am not seeing a lot of opportunities long or short – so might as well wait…..
Hope you are well JL.
J
p.s. I believe next week is “triple witching” so possibly new all time highs in certain markets and then we will see?
J
One thing you come to realise is that there is so much chatter on Twitter that is worthless information as a trader. (first of all ignoring all the Kardashian stuff and cat videos)
http://fxpro.ctrader.com/c/4ftbn
Pulp
Just ignore Krish and you will filter out most of the knee-jerk hindsight driven commentary out there…;)
J
Apologies if my comments on my trades which have made me a lot of money are not considered welcome. But I will continue to post for others that are interested. I’d prefer if you just buggered off from this site Jeger.
Newest and most important post of all: New Thought: The S+P 500 goes to a new ATH but the DOW does not!
That would blow most Deltoids minds. But it might not be far fetched. The April 20 high was the M-1 high for both the S+P 500 and the DOW. Since then, the S+P 500 has exceeded its M-1 high but the DOW has not. They both have the same Delta rotations/solution. That the DOW hasn’t exceeded its M-1 is a rarity. But it may also be a profound warning of greater things to come……
With if I am wrong about how T-bond’s high SL-25 is going to come in. With if instead of a triple Inversion Window crash downwards there is going to be a triple Inversion Window crash upwards or even worse a hyper crash upwards to a very rare double 1 points? What if a high I-1 brings in M-2, L-1 and SL-25 in T-bonds? There has never been known for more than two Delta 1s to come in together and when they do the moves are extreme.
Today’s WASDE report could reignite the Grain rally. If it does, and T-bonds are on their way up to high I-1, M-2, L-1, and SL-5 then the conditions would be in play for the S+P 500 to go to a new ATH while the DOW does not. This means that Delta SL-6 will come in this month for the S+P 500 while for the DOW in came in May, 2015.
Glad you are keeping an open mind in terms of correcting your previous view.
“There has never been known for more than two Delta 1s to come in together and when they do the moves are extreme.”
So let me get this straight. The above has never happened before, but despite this the effect is known? LOOOOOOOOOOOOOOOOOL
Where is that mute button?
Good weekend all.
J
Long post today. Free Read, no login required! http://navigatethemarketstorm.com
NDX weekly bearish key reversal
http://schrts.co/rUCj3f
I posted a cool chart, is it a coincidence, you be the judge! No login required. Free! http://navigatethemarketstorm.com/
You are found to be guilty of spamming.
Sentence: 40 years solitary confinement.
Go away.
This year is turning into a ‘travellling’ year. This is my 4th trip within 6 months, 3 back to Pakistan. This time my mum wasn’t well but is now recovering…..slowly.
I was delighted to see Richard back in full action again. It certainly keeps me wondering about my rather one track mind.
Friday’s break down followed by the overnight and today’s action still looks like a zig-zag correction to me. Which of course means some more up….but I’m still not expecting a new ATH.
Peter_ I’ve seen your ‘alternative version’ of the count. The ‘5th truncation’ you show is just too much of a truncation for my liking. Usually truncations miss by a very tiny amount, although there are no guidelines about what amounts to ‘tiny’. I do however have a question please:
What’s your reasoning for the C wave being 2 x A? The way I understand flats vs expanded flats is that the former have B waves which end near the starting point of A waves and C waves that end near the ending point of A waves. Expanded flats however require the B wave to go higher than the start of the A wave (which would mean a new ATH) and then the C wave which goes beyond the end point of the A wave. Of course this current up wave COULD go to a new ATH and in many respects that would confirm that there was no truncation but just part of the larger 4th wave.
Good to have this discussion in any case.
Yes, good.. First I see that SPX has just put in a rather hefty negative divergence. This alone is usually enough to activate a decidedly bearish stance. Your question assumes a 4th, but requires acceptance of that assumption. My ABC is post 5th i.e. the actual bear action where the long expected waterfall is about to land on our heads at the speed of gravity. As for the failed 5th, yes that was a while ago and has been put through the bovine digestive cycle, such abnormals require confirmation of which I found several other indices similar with the NDX showing a purer form of the ending diagonal. The B in this leg of the bear has also been unusual. We can say that the CB behaviour is so uniquely unusual that it would be unusual for the indices not to behave unusually. And now we are slipping over a precipice from the highly unusual place of apparent safety into the totally unknown scenario that causes my imagination to conjure strange images that are probably from some J.K. Rowling novel. I am not at all sure that I want to be going there at all, but ready or not ….
Whilst I share your fear of the place we are heading into and assuming the 5th is over then surely we are starting a new down trend and it is no longer appropriate to have A, B, C type waves but new 1, 2, 3, 4, 5 waves.
If that is indeed your stance then I would have to agree to disagree until the market shows us the way forward.
Always worth having the ‘alternate count’ to hand. Thx
Only with the C wave did I do any sub wave marking and you see they are numbered 1 & 2 in expectation of the eventual 5 wave impulsive form. Otherwise only the primary waves are with my markings, but yes these are A,B,C, as they must be. viz:http://tinyurl.com/jh9yxj2
I think that the Grains Delta late high M-7s is coming in today with early high I-9s and will set back to their low M-8s. This points to the S+P 500/DOW declining to their low M-3s and (18 point) L-9s. All the big swings in the S+P 500/DOW from May, 2015, (the ATHs) to now have been unusually accurate Delta (18 point) Long Term points. That is a strong example what Celestial Bodies (Earth, Sun, Moon limited to a two dimensional plane) can do.
The only reason that the S+P 500 M-2 exceeded its M-1 while the DOW did not is because of the rally in the Grains/Farm sector otherwise its M-1 would have brought in its L-8 just like the DOW did which is closer to L-8’s average due date.
I went short at today’s mid-day rally. This has nothing to do with the mass shooting in Florida. It has everything to do with the American Farm sector which means American Grain futures. Not only has Chicago and Kansas Wheat futures been dropping like rocks, for the past several days, but most importantly of all Chicago September, 2016, Corn futures have make a collection of daily candlestick tails even though today was the high daily close for the move. A person has to be either deft or ignorant not to know what a collection of Candle Stick tails means for a market. In my opinion (I don’t give advice) it is the American Grains/Farm sector that has been rallying or holding up the S+P 500/DOW from declining with the adage (sell in May and go away). But it doesn’t take a knowledge of Delta to see a collection of daily candlestick tails in the most important of all Grain markets (Corn), to the American Farm sector, to understand that the Grain futures rallies of late are over and look to be correcting lower AND, AND, AND, what that means to American stocks THIS TIME OF YEAR.
I am short stocks as well. GL.
Important market note: While Crude has been rallying in a “rising wedge” (Elliot: Diagonal Triangle) RBOB Gasoline has been rallying in a Channel. None-the-less, both have broken to the –downside– out of their multi-month rally patterns.
JL
Are you using ETF’s or something else?
I am looking at XLU chart and think that is a potentially beautiful short setup – I will be taking a closer look later on today…..
J
I am looking at ETFs linked to EM such as EEM. They have strong correlation to DAX, for whatever reason. The only reason I can think of is that DB has high EM exposure.
Ah, that is a new one to me – maybe I will take a look. I don’t normally trade indirectly like that, although I sometimes (attempt to) hedge like that…..:)
GL
J
4 hr DAX 12-50 sma cross over – blue boxes show cross point and max high/low from it (I’m not saying its at the bottom of the current cycle).
http://fxpro.ctrader.com/c/YjRbn
In my humble opinion two Commodities to “buy on dips” are Cotton and Rough Rice futures.
I have taken profits on my shorts and I am focusing on “buying the dips” of the Ags. Monsoonal rains usually start on June 1st in India and MUST start by June 15 (tomorrow). Every day from June 15 on that there are no Monsoonal Rains results in significant declines in India’s Ag sector.
A rallying Ag sector will pressure US stocks higher or lesson the declines. I don’t expect a “collapse” of US stocks when the US Farm sector is rallying. This doesn’t mean a Bear Market in US stocks can’t happen but if it does it would be less than if the Farm Sector was also in a Bear Market which it currently is not.
Get with the panic, wear a blindfold. If it isn’t gold sell it. If it can crumble sell the crumbs… http://dollarcollapse.com/stock-prices/big-names-bailing/
Governmental policies often cause massive dislocations in economies/markets. And so it is today. I am of the opinion that a truly massive dislocation is occurring in India and SE Asian economies/markets.
The India government is youngish and immature. The Indian government is walking around with its head in the clouds. The Indian government religiously believes that a La Nina will happen and that it will relieve their Drought. The Indian government refuses to consider that a third year of Drought will occur that will be devastating. The Indian government’s weather predictions are being adopted all over SE Asia.
Today, it was reported that Indian Rice planting is 10% below normal for this time of year and that coarse grain planting such as Soybeans is 40% below normal. Every day beyond June 15 that the Monsoonal Rains don’t develop will be another day closer to panic and hoarding that will sent Ag prices to the moon like what happened from 2008 onwards. This will benefit America’s Farm Sector in a very big way which will make it ever unlikely of a “crash” in the American broad market stock indexes like the S+P 500.
Are American Rough Rice futures going skyward in an Elliot “3rd of a 3rd”?
May it rain, and by all that has holes in it may the markets crash into the grand canyon where they belong. Ugha ugha – now its no longer uncertain. Look down. Eat up.
Closed my dow short which i opened at 18005 at 17700. Expect a rally back to 18k over the next week but too risky to go long i think with the brexit vote.
Well done on the profits.
May not see that bounce though.
EW guys, was the ‘up’ today wave 2 of 5, so 2 more down waves and 1 more up wave before we’re done? Maybe down to c.1900 ES?
The daily candles look very nicely bearish don’t they?
I don’t read anyone else expecting much more downside. Buying the dip still all the rage in snoozing bullgravia. 😉
Re Brexit, my polling of friends and clients indicates ‘out’ is gaining strength. Excellent news.
Any other views from UK-based people?
It be wave 3 which has been described by some as the omg wave. Yes this is a bear (well for little ol me it is anyway). I have spread the Brexit word and thereby tipped the result in my favour… https://et2bru.blogspot.co.za/ who can resist such presentation!
A footnote to history in c.500 years will read ‘Democracy: yet another system of governance that failed miserably. The masses voted for their own benefit, with short-term gravy always at the expense of longer-term stability. Lowest common denominator influence guaranteed its failure’
Perhaps once we ditch the EU government, we can ditch the UK government too, a nice bit of free market anarchy is what we need, survival of the fittest. Leftists would just starve, like the freed slaves in the US, with no idea how to look after themselves.
So we not one of the handful or essential to their lifestyle and the boats are full so we have to swim for it, but if you try to save me I will pull you under. But we all gonna drown one day so lets have a game of anarchy. Change is wanting to move on and it does not care about good, bad or terminal.
Nothing like reading about rendition at Diego Garcia on a Thursday morning to brighten the day (thanks for enlightening me on that Peter_).
I feel this 9450 level is important: DAX 4hr: http://fxpro.ctrader.com/c/f38bn
Richard Isaacson, as per your most important post of all, I am covering my shorts and going long for SPX new ATH.
Traders without razors would give 2 megatons of their bullsheet for another one of those Fed thingies, but the full moon approaches and sweet nothings have turned sour. Those milk churns could do with a wash so long…. http://barestbodkins.blogspot.co.za/
I have been trading for 20 years, and I think I know all the different models out there, even if it is basic knowledge, but this thread is getting more and more incomprehensible. It is as though every bear gave up, and only crazies are left. What is razors, bullsheet, Fed thingies, sweet nothing, and milk?
Mistake with reply thingie – totally nondepersonal sprinklied with accrued bumbled apostasies. Toodlepip
After 2 months of patience (and ETF price decay), I am now flat for a measly profit, but at least not a loss. Swing trades seem not to be working out so well, so will ponder whether to quit trading, and just buy more gold.
The market will of course collapse in a heap now.
Maybe GM, or perhaps it is a good decision with Brexit looming.
Glad I’m not short today.
Odds of Bremaining peaked at 1.68.. (£10 -> 6.80 returned) on Wednesday last week. After the politicians killing, the odd of exit have receded to 1.44 (meaning more likely to bremain).
I don’t take any newspapers, haven’t done so for years. But I visit friends regularly and read their Daily Mail (with buckets of salt).
I was amazed, shocked, and intrigued today. They have always been vehemently behind the ‘leave’ campaign. But now they openly pushing the other side, with no explanation for the switch at all. Lots of fluffy-bunny stuff about the oddly-timed MP murder too.
Seems they have been got at to me. The establishment will do anything to maintain order. Hence, the vote will be rigged.
Explosive move higher in futures for a modest increase in bremain likelyhood. The final move up has begun. I expect 2025 to be reached on the S&P most likely after a Bremain victory. That will form a good shorting opportunity.
I meant 2125 of course
This was exactly what the bulls needed to destroy the bearish momentum. Congrats to the bulls. The rally should continue with force this week as the vote leave campaign falls apart at the last hurdle. My FTSE target is around 6500 as the bears capitulate and investors flood back into the UK. I will be trading it as soon as the result is known on friday.
I can see FTSE futures possibly reaching 6,300 at a push.
So many will know the results of the vote before you Krish!
Will this Full Moon to New Moon rally result in new ATHs for the S+P 500 and DOW?
Has the Full Moon to New Moon rallies returned? For how long this time? Six months, a year, two years?
Important to remember that events don’t change the ultimate direction of the market…they can only alter the path or trajectory.
Break through 2100 on S&P. Bulls showing the bears who is boss today! Another 1% rise to go in my opinion.
Here’s what our enigmatic infrequent poster Mark wrote back on May 1st:
‘Price and time. SP500 is back at its most important price (2065) exactly at one of the two most important times of this whole solar cycle (the first ISN breakdown from its solar max range into a new lower range). The other important time will be the second breakdown due early 2017. These breakdowns have always been the cue for major market moves in the past.
But sunspot numbers will not break down completely yet; instead the new lower range will persist until early next year. Geomagnetic disturbance will also wane, but gradually…
From February 2012:
“It strikes me that the alignment peaks [Jupiter-Earth-Venus] correlate very well with geomagnetism peaks (as detailed in the last table on your “Timetables” page). Then, looking at the long-term DJIA chart (on your Ultra Long Term Models page) we can see that buying stocks at geomagnetism peaks during secular bears would be an extremely successful strategy – 1942, 1974 and 1982… They [JEV alignment peaks] appear to anticipate geomagnetism peaking during 2015, which would sit reasonably well with your other analyses.” https://solarcycles.net/2012/02/23/solar-cycles-and-astro-trading/
Geomagnetism did in fact peak first at March 2015, and then more convincingly during August to December 2015 – that is what caused the nervousness during H2 2015.
So what do the forthcoming JEV alignment peaks indicate for the next year or so? The three main peaks are Q3 2012, mid 2014, and Q4 2016, so neither sunspots nor geomagnetism are going to disappear quickly – both will wane only gradually throughout 2016 until sunspot numbers drop away again close to zero early 2017.
None of us alive today have experienced this before (sunspots and geomagnetism declining together) because all solar cycles during our adult lifetimes were relatively strong – ie. where a much more distict sunspot peak was followed by 2-3 years of increasing geomagnetism, causing a risk-taking period to be suddenly overtaken by a risk-aversion one.
This is the main reason why I have been saying here for years now that looking for a repeat of 2000 in price and time is the wrong approach. But we should get something new, and big, very soon – a weak spell for US stocks, especially between 10 May and 8 June, and then the start of a manic phase.’
I wonder whether the manic phase is about to begin?
GM, are these all quotes, or do you believe the manic phase is about to begin?
Within ‘and’ is all Mark’s thoughts.
I think there’s a weak 18 months ahead, no major bubble, then the bond bubble bursts and stocks take off for c.18 years.
In short, I don’t subscribe to his thinking in the short-term. S&P to 2,300 at some point this year, maybe, whooppeee dooo!
Mark also subscribed to the 19.6Yr lunar cycle, which says 2015 was panic and 2016 was a low — and hence he was recommending to buy, since it is “low” and not “crash”.
http://www.safehaven.com/article/35052/ganns-financial-table-still-working
Just got off the forecasting couch and whilst strolling in the dark I met a bear having breakfast. This must mean that lunch will be later, down by the river on the other side of the sluice gate with Edward Lear and some goons. Like in my last daydream. That was when they told me that the exponential increase of therapists was due to the outbreak of conspiracy theories which were all part of a plot to create jobs. I think these cigarettes have been got at too.
I think my own approach this and past week will be to just wait until after the Brexit distraction is out of the way before taking on a lot of (or any) new positions. Lots of algo and sentiment volatility the last several days and for my style of trading is mainly noise to be ignored. If you trade FX however, just be careful haha.
imho and GLA
J
Ags are selling off; this brings back on the “sell in May and go away”.
Rains are occurring in USA, India, and China. The highs of the year may be in for the major Ags like Corn, Wheat, and Soybeans. If so then a major support for the S+P 500 has turned down due to the Farm Sector turning lower as it usually does thru the Summer and into the Fall harvest. I am looking to short stocks again.
The FTSE will rocket to 6500 on a remain vote and may trade as high as 6700-6800 before it comes flying back down again. I’d love the opportunity to short at those elevated levels so I am hoping it does get there if the vote is remain. If its a brexit I will try and go short at the open before the stock market is halted for crash prevention reasons.
When are the poll results? Will they halt the stock market if it is still open?
Will be around 5am GMT on Friday morning. Futures will have priced in the initial result. If there is a Brexit I’m not sure the market will even open for trading…lets see what happens. For the record I expect a remain victory with 53% of the vote.
Likewise, I expect a ‘remain’ result, but with only 45% of votes for remain.
53% may however be the officially announced figure.
Even if remain wins the referendum clearly shows the eventual dismantling the EU is heading towards. Luckily the best footballers in the world do not play in the premier league but are elected to lead countries and central banks. The evidence is clear with the amount of can kicking over the last few years.
Thanks for the info. I don’t plan to have any positions around the vote. I expect Remain to win, but I don’t really know. I have a conspiracy theory that $50k can move the bookie market, and yet everyone takes the cue from it — imagine if you were Soros with a huge pound/cable bet. Surely you would throw $50k if the butterfly flapping causes more profits in currencies. I am not saying that Leave would win — just that the numbers right now might be a little random vs reality.
Very nice power pump at the end of the day in europe though. DAX is breaking out of its bearish formation now which looks like bad news for the bears.
Hi Krish
A chart to understand what you are seeing would be helpful. Looks to me like DAX may retest the descending trendline through previous highs over the past few months……but not sure what you are going on about?
Thanks
J
Yes its the descending trendline im looking at. My target would be 10500 on it and then should bounce back to the downside. If it breaks through then the upside could be huge but i don’t expect that to happen as it will send US indices to new ATH’s which i don’t expect at the moment. If we fall back below the 9900 area then something else is probably happening. Of course a brexit will mean the DAX probably reached 8000 in a week or so which would be very volatile. Looking at the odds and recent market action a Brexit is has been virtually ruled out. Cant wait to see if the markets faith and conviction will be correct come friday morning.
Dax 12-50 4hr cross over: http://fxpro.ctrader.com/c/37Hbn
You know that something big is going to happen, when the trading account rules change big time -mine has gone negative margin suddenly. I’m not trading any currencies pre-brexit-result.
Its pretty much all downside protection in case markets fall heavily. Severe capitulation going in the markets now as the bears are throwing in the towel before all of their limbs are ripped from their tortured bodies. Could just be last gasp spike high though before markets drop tomorrow on profit taking ahead of the vote.
Yep, margin reqs on fx has almost tripled in some of my accounts, and doubled at least on index positions as of this afternoon. I don’t have any open positions that are affected by these personally…..
Next week should be more interesting once this noise has passed and the algos can go back to reading other news items that are not as unnecessarily dramatic. Remember, they are also plugged into social media etc.
J
Brexit means commence years of renegotiating trade deals and commence years of re-establishing trade deals. Brexit means hold on did anything actually happen here? Brexit is the biggest con event of the century. Ruling mob gets a message to do something, so what? Its not binding; would you like a statute or a statue? If you don’t know we will record that in stone.
Markets have either priced in 100% chance of a remain victory or there is significant upside ahead if the vote is to remain. Either way for me its the worst time to be short right now and actually i think only a fool would be short through the referendum with the odds so heavily favouring the remain side.
Only a fool would actually trade the referendum result full stop imho.
J
Just look at the markets rip higher. Someone knows the result of the referendum before the people have voted! Unless there is a snapback drop post-result momentum is heavily in the favour or the bulls so I expect large rises across all indices through the middle of July. I am rather bearish at these price levels but I don’t dare fight the bulls just yet.
Your view is very simplistic Krish.
I think smart investors are selling into this latest rally, further distribution to retail chumps.
I took a half account short at 10.45 on the FTSE via a 3x short ETF.
Rest will go on shortly.
Let it begin.
hope it works out soon for you as you must be getting skinned alive at the moment.
I hope you weren’t too long, if early poll results are indicative of the final result, many novice bulls will blow up their accounts today.
Krish
The last poll before the results showed 52% remain vote just now. Bear in mind that he FTSE has risen 16+% since low in February despite the referendum being on the road map at the time. Does that mean the fears of Brexit has kept the rise to “only” an eyewatering 16% rip and that there is much much more to come or….? I would be happier if the FTSE etc had sold off since February as it would be justifiable to ride a long position. As things stand now, I am not adding any positions until after the results are known and the market has had time to digest. Trading is difficult enough as it is without adding unnecessary complexity.
You seem to be unaware that the latest poll was just published, what else do you not bother looking at when making your judgement calls? I am honestly not trying to be nasty here, I just don’t understand how your “approach” works for you…..
GLA
J
As I recall there was only the Fed to think about. This Eu tapdance did not factor. Why now does it factor? Does have something new that was not there before? If not it is the same = zilch. Now what is the Fed thought of the day? Eu still on same track to LaLaLand. Best thing there is the build up of NATO and the new cold war, great consumer with ever-increasing money to spend. Ask your favourite bankster about it. Meanwhile we got some nasty looking negative divergences and a host of downside gaps to ignore if we gonna stay bullish about NATO.
What a monster rally after hours. I had no clue a remain vote would provide an instanteously boost to global GDP hence the rise in markets. US markets almost at new ATH’s. Where is the bear market? No chance in hell we are getting one soon.
I did forget to mention that my informal polling amongst clients, friends and across the country indicated a 55-60% leave verdict.
Who knows, I’m confident this bull market is dead already.
If 50.08% (current count) voting Bremain stick, you will be bullish?
I am asking because I am confused if the market is trading based on the outcome, or based on the fact that the country is polarized.
In or out, these markets were ripe for a plunge yes?
Keep it simple.
Congrats GM. I stayed safe and made only 1% as I was short the wrong stuff. (China)
At Last! But I fear that the incredibly overdue nature will bring a very heavy toll.
The application of quite basic charting to the indices of the main markets has once again proven to be the most accurate way to weigh the probability of direction. Pinpoint accuracy with timing was this time thrown in our faces with the manic bullish hype around the referendum vote.
Its not rocket science and is far better than thumb sucking debates. When there is no clear indication then you leave things alone,simple. So now $gold is launched into wave 3 with quite a strong probability following the recent pull back. Its got quite a way to go.
Good points Peter_.
Just waiting for my broker to start working again…I had a small short (pre-vote) on the SP500.
Where the DAX bounced – is amazing how it creates a channel – http://fxpro.ctrader.com/c/sXsbn
If you have an insurance policy along the lines of FAZ/FAS, I imagine it should look OK today. A very high risk gamble (imho) has paid off for GM – congratulations.
I have taken profits on 35% of my AMZN and AAPL shorts this morning, I guess sitting tight until this afternoon to see what the US makes of this is on the cards.
GLA
J
Amused at jeger inserting an (h) into his IMHO. As if.
Where’s Krish?
It wasn’t a gamble at all, I just (correctly) ignored the Brexit vote issue and traded what I saw.
If the vote had been ‘remain’, I would have added the other half of my account at higher levels and patiently waited for the decline. Now I will add the other half on a rally.
NB…gold yesterday was £840, as I type is £946. Mmmm.
h=honest – but no slight intended GM, I hope you are happy this morning!
So you have dishonest opinions then?
How weird.
weird=your reaction to what was meant as a congratulatory post…….but ok…..
J
I should clarify possibly that when I stated “very high risk gamble” it was purely coming from my opinion that I never trade anywhere near half my account on one position, and I do not tend to trade around these highly emotive events personally. Again, no offence intended – risk management is key to surviving in the longer term.
Enjoy.
J
Added my remaining shorts on this bounce.
I smell blood.
Where’s Allan. Gold hit new all time highs last night in Aussie terms. Aussie Aussie Aussie! Oi oi oi! Newcrest also ripping higher. Gold aussie chart i suspect is the pattern to come in other currencies. Look at gold pound chart, gold cad, etc
Yeah, I hope Allan is well over there, sure he is.
He will be proved right and wrong in due course: gold and the miners will soar, but so will the USD (for a year or two).
Some still unaware, but we are now over the cliff, free-falling slowly to earth.
It is all downhill for now, for the rest of your days.
Rabbit or wolf:
http://www.anonymousconservative.com/blog/brexit-feeds-the-drive-to-k/
Be a wolf.
Although the pre-existing FTSE negative divergences still remain it appears that some pressure has been relieved. The EU indices have now got even more pressure on them suggesting that the FTSE should take less pain than it would have done as the bankster’s global systemic crisis drifts further and further out of control. US elections destined to make matters worse as usual. Never mind about the price of gold and silver, just buy it and hold it in your own hand.
Hello,
My latest thoughts at my free blog:
http://navigatethemarketstorm.com
After intense study I find your thingy to be somewhere amongst comparative roughage and pernicious (abbreviated as crap). Anyone who could not see the Brexit money and make money from it is as yet unworthy of a blog about these things. You can have any other sort of blog its OK + I would suggest your talents point to 2nd hand motor vehicles of the GM kind.
I don’t do 2nd hand motors though. 🙂
Overall I felt that I should have been more short than I was on the eve of the Brexit, as the markets had rallied hard. I was put off having too much on the table, due to the increased margin requirements and concern of a major up move. I guess, there was always more downside risk than upside. It was I guess safer to be out. My broker even stopped me from trading on the morning after – I guess they were scared of over exposure to loses – to themselves after that failure/collapse of Alpari following the swiss peg thingy.
Likely to be plenty of opportunities to sell rallies pulp.
Those gold miners eh…mmm.
I just went long…..oh meee, oh myyyy. (Buy when there is blood in the streets.)
I have doubled up on my longs. Not only is there going to be an Asian stimulus package but there is also going to be dryness in Asia for at least the next two weeks that will send Ags higher. So far, there has been no actual Monsoon rains but only pre-Monsoonal rains. Note that July 1st is the latest on record of there being the first numbered tropical system in the West Pacific and July 8 is the latest, ever, for a named Tropical Storm or Typhoon. There have been none so far this year. I am expecting drought for the third year in a row for India and possibly drought in all of Asia this summer. If I am correct then the American Farm sector and the S+P 500 will rally, soon, from Delta low M-3 and L-9 up to a high L-4 (six point rotation) which is due December.
I agree. I am long the S&P now and expect it to recover almost all of the Brexit drop. The FTSE 100 has also recovered very well.
With rumors of an Asian stimulus package making the rounds it is time to consider going long Crude and Canadian Dollar (buy the dips).
About to cross down on the dax 4hr 12-50 sma. The last cross up maxed at about 400pips. http://fxpro.ctrader.com/c/SWfbn
Hi all
I just closed another 30% of my short positions across the board, some indices at support and others seemingly unable to regain support so a mixed bag im(no H)o. I closed out 10% of my FAS positions, I do have them as insurance policies but there was simply too much profit there not to book some.
I have added some shorts on a few US equities for a longer term swing trade with wider stops today but as I have been travelling had not had the proper amount of time to have a thorough go-through – but I am going to look to short Euro/USD but will probably wait to try to catch it on a bounce.
GM, if you haven’t already make sure you book some profits mate – we all like big blue/green numbers but if it ain’t in the bank…..hope you and everyone else are having a good week in any case.
GLA
J
The American Consumer Confidence number just came out at 98.0 which is much above last month’s. Tomorrow, I am expecting the American Personal Income and Consumer Spending to both be higher with the income higher than the spending which means that the American Worker is saving more beside making more and spending more. If so, then this greatly raises the odds that yesterday brought in a Delta low I-7 with M-3 and L-9 meaning stocks will rally up to new ATHs on their way to high L-4 due in December. (No further crash this year.)
MORE, MORE, MORE scream the American Consumers. –More spending–; much –More income– than spending; thereby, –More savings–. And all of this MORE with gasoline prices lower than last year at this time! Given that the American economy is 70% consumer spending then tomorrow’s Personal Income and Consumer Spending reports could show that there will not be any more crashes this year but the start of a major (summertime) Bull Market wherein “buy the dips” will be the winning strategy.
But what about the most important post in 2 years? TLT continue to make new highs.
Be careful what you wish for. When factoring in that its been well over 6 years of buy the rumour then the provision of the fact promises to be quite interesting. Inflation target likely to fly off the wall, rates increases will be bigger than most have seen in their short lives.
Time to say farewell to the very few commenters soldiering on here.
I will be writing my own regular blog at my business site. I may open comments there, we will see, but it won’t be solely market-related.
My clients are up by c. 55% YTD, so I’m going to do a bit of marketing of my little consultancy business with hedge funds, pension funds etc, and have decided to cease sharing my key insights for the future, both financial and societal. You all know where to find me if you need me.
Thanks for the past couple of years, some good banter here, some canny traders, and of course JH himself, I hope he returns fit and well.
Best of luck to you all.
Best of luck
GM, sorry to see you go, but do understand. Wish you well for the future.
As a reminder please just note your website address again please.
Thanks.
Thanks p.
Just click on GM, it links to the site.
Elliot Wave basic Psychology 101: When the Human Herd is Optimistic then Credit Expands.
American Personal Income up 0.2% with Consumer Spending up 0.4%. (The very beginnings of a new credit bubble has only just begun.)
Rally on stocks, rally on….
I didn’t realise that you were running a buy-side consultancy business – good luck to you!
I am a bit confused as to whether your clients are up 55% YTD because you shared your key insights here and this cannibalises your own business (because they visit this site) and that is why you are stopping, or whether you mean you don’t have time to participate here? I think the confusion arises from the point that if it is the latter, then the reason for mentioning your clients’ performance is puzzling – does that mean that you don’t want us to benefit from your advice because we do not pay for it and hence the time you spend here is a waste of time? How much does your service cost?
Well, whatever the reason – I have to remind you that I *did* tell you to take profits on those 2 positions before they vanish – it seems your clients did at least in order to achieve that 55% YTD gain….
IMO
J
Divergence SPX et al and leading indicators already showing the way. Honey for any surviving bears. The is no new high to come – much more chance of total permanent systemic meltdown. Just think of a planet devoid of financial services where money has no value or purpose. Heaven and hell and everyone gets a part in the movie.
GM: Just a note of thanks for sharing your thinking and perspectives on macro economics. It
has been most supportive, during this age of central bank omnipotence. A while back I sent John a note giving him some background info on myself and the sentimental attachment I for reminiscing
back to the good ole days when I worked in London. Wishing you and yours all the best. Meanwhile, I’ll visit your website.
Sorry for my lack of proofreading.
“…..have for reminiscing…
Please accept this in the spirit of the message I intended to convey. (:-)
I am taking profits on my longs and looking to go short with this weekend’s New Moon.
New moon 5th July 7am EST so turn by Friday if not before but probability goes to following week being mired amidst the consequential (category dire – also due to lack of government by people warming). Note: In a democracy the replacement of government by the people is referred to as a Shamocracy. Typically the replacement system serves a few at the expense of the many.
In epitaph to GM and kinfolk please note that I have no desire to glean and blog. However, anyone who has such need can pilfer and reproduce from me until they exhaust blue smoke. Fortunately, I have no need to care and so I don’t. Could it be that JH has seen the same light?
If so – tis truly a leading example for anyone so unaffiliated by life’s constraints to follow. A better one is to sensibly distribute all and join the brotherhood of the unselfish ordinary whilst countering the propaganda systems of the shamelessly selfish Shamocracy beneficiaries.
I am still wondering about your most important post on TLT. I am looking to short XLU as it makes new highs — it is related to interest rates.
I hope he took the profit available this time though JL!
Like peter_ shamocracy…
You do blog dont you??
The world of finance seems to ramp up its craziness level to beyond mental.
“People” in the uk believe everything is hunkydory because the ftse is back at prebrexit levels.
Today posted gold overview chart – I am not interested in what anyone may think about these basic chartings. Its just my little cloud shelf with no gate or door.
https://barestbodkins.blogspot.co.za/
I posted detailed technical analysis, 12 charts in all. Its all free, here: http://navigatethemarketstorm.com
More like a cry for confirming help – so many out there have such needs – maybe they will also pay to help you. You maybe lucky who knows, but first time you make a faux pas then I think you must start again with a new bio.
When all goes belly up it is now known locally as a GM
GM did quite well
Hey survivors isnt this a diamond formation on the dax: http://fxpro.ctrader.com/c/x3y0n?
and its not a bottom diamond.
pulp, don’t know enough about diamond formations unfortunately. Sure looks like one. What would you expect the next move to be? Up or down?
DAX monthly displays a near term negative divergence despite a near 25% decline since peaking some 15 months ago and that peak posts a negative divergence running for over 20 years now. The DAX casts a mega shadow of ongoing gloom and doom right over the globe, but we seem to get used to the colour of the sky and simply ignore it whilst scratching the ground for chicken food.
Hey, chickens gotta eat too. I think the gold price action is sending a message but not sure if it is morse code or without a code.
Sold out of all longs of on the NFP blast-off. Fantastic run by the bulls but I think this recent rally is about to come to an end next week so I have immediately gone short S&P and DOW. I’m targeting a 3-4% move to the downside before the rally resumes.
Great trade!
Cheers! Tom Lee must be dancing on his table and ready to throw a massive party with his clients!
Something that makes Brexit a mini dip gonna hit probably before next US market opening…
https://barestbodkins.blogspot.co.za/
I’ve provided a comprehensive post free too all with no login requirements. http://navigatethemarketstorm.com
Looks like i jumped the gun on these recent shorts. Will hold them for a bit longer but it looks like a significant breakout to the upside is underway. We must thank the British citizens who voted for Brexit for this rally as more CB stimulus is on the way and it remains as potent (with regards to the stock market) as ever.
DAX just about to cross 12-50sma 4hr. fxpro.ctrader.com/c/sBb0n
Well, as I predicted May/June of 2015, the SPX made a rapid sell off for primary wave [4] and has now made a new all time high. Here’s my post with my wave counts from June 2015 https://alphahorn.wordpress.com/2015/06/28/public-post-big-picture-elliott-wave-counts-spx-dow-nasdaq-and-rut/. Don’t expect a top any time soon either.
Nice charts alpahorn.
Ponziblogworld has this one: https://2.bp.blogspot.com/-CVc04ed6PHM/V4OjL6yLkoI/AAAAAAAA8Qo/ynvtu10k10U8Uv7Vfs5kKvDTUMgxdAO1gCLcB/s1600/XVG.png
Closed out of my shorts. No point being short during this irrational move higher. Best to wait till it tops which i think will be this week.
This is also evidence as to why we are nowhere near a bear market. The bear market will start when globally central banks begin the process of raising interest rates to more normal levels. Until then bears will get the occasional large correction which will be met with a vicious rally back to the top. I feel confident one of these large corrections will happen soon and then we should see an explosive rally probably on the back of central bank comments.
Daily Dax Diamond update: http://fxpro.ctrader.com/c/QL00n
Is the diamond a topping patternn or could we see a breakout to the upside which according to that will lead us to new ATH’s for the DAX.
RIP John Hampson.
RIP all noises here that amount to a vilification of the creator of this site.
Will someone of greater good please put a stop to the seemingly omnipotent vampires that lust for the blood of the objective minds and thereby humanity as we used to know it.
Huh?! Peter_ do you know something that we don’t?
To avoid ambiguity….what is this ‘RIP’ stuff that you are spouting?
Here’s an attempt at counting waves since 6th July low on the DJIA.
https://postimg.org/image/pw41pnq3r/
Here’s a blown up chart of the 5 minute DJIA since 11:00 BST 14 July’16 . It’s looking like a triangle to me…..which is the second last wave in EW terms.
https://postimg.org/image/fslrcdrtj/
Fair warning you all KNOW of my triangle calls morph into something else….but I keep plowing on in hope.
I have gone back to the Bear Crash camp. Most of the major bourses show that Delta’s Super Long Term high 6 came in last year and are no where near making late highs. The entire world has bought the mantra that the American Consumer can revive the world’s economy. I now think that the S+P 500/DOW is making an historically late high SL-6.
American auto sales in June were the least in 4.5 years; however, light truck sales held up and are masking how weak the American Consumer really is. As per any other American Consumer reports/news I think that this is an historical moment to “buy the rumor and sell the fact” meaning that the Smart Money is selling any further good American Consumer news knowing that the consumer, only, lead economic rally is over.
Do you care anymore about shorting Treasuries?
No, I am now looking for a T-Bond Long Term Inbetween point so that L-2 ends up as a high instead of a low.
I was looking for a very high L-1 to bring in SL-25 so that SL-1 would not be the patterned high and trend reversal as is shown in the Delta book but it looks like SL-1 will be the trend high meaning the dual Super Long Term trend of two 19 year cycles is still in play (38 year trends).
DOW 3day: http://fxpro.ctrader.com/c/urg0n
pulp….that is a GREAT chart. I hadn’t thought of going back that far to draw a ‘line’ but that is VERY VERY interesting.
pulp I would like to share this DOW 3day chart at the World cycles institute site if you don’t mind.
Please let me know if you are OK with that. Thx.
Of course it would be better if you dd it yourself, rather than get the credit via me.
I don’t mind you sharing this chart.
OMG where are my manners. Many THANKS pulp.
With no fiscal (government) stimulus in sight and with monetary (central bank) stimulus having spent its wad, I am looking for “water fall declines” in stocks as American consumers have over bought on credit and start imploding.
Kiss it (the underside of the trend line) goodbye….
I have changed my Delta S+P 500/DOW Intermediate Rotation. I now hold that the Evens are Lows instead of highs. There was two high Intermediate Inbetween points that caused I-2 to slip out to I-3’s due date which had fooled me. This means that high I-9 is bringing in an early high M-4, late L-8, very early L-4, and historically late SL-6. If this rotation solution is correct then American stocks are starting into a (major) Bear Market.
The time has come for a new report from JH: the S+500/DOW has topped; the FTSE is making a “second chance top”; the DAX is making a diamond top; and the CAC has already started trending lower in a channel.
Hey Mr Li – I’m sure you’ve noticed this resistance in SP500 around 2166; adding more validation to the 450-1106-1509-1837-2166-2566-3225 sequence.
You can look at these sequences yourself with an ordinary Fibo retracement. For example, take a gold chart and draw a Fibo retracement from $250 (September 1999) to around $1525. You will see how these “retracement” levels are defined in the initial move, long before the market tops and starts to retrace back to the same levels.
Now change that gold retracement to $250 up to $2300 (or thereabouts) and you’ll see one projecting into the future – this one must still be valid because gold hung around the 50% level for most of H1 2016.
I agree with your point above that the solar southern hemisphere is more likely to be the one to develop high-latitude reverse-polarity spots first. I am not saying that these will necessarily develop anytime soon; more that they are something very important to look out for.
And I see you’ve recently mentioned shorting treasuries – for what its worth, I have been buying TMV during the past two weeks.
I see what you mean now. This is my Fibb Projection graph for SPX, which is 1.618 at 2185. Bloomberg stops at 223.6% and so I can’t get to 3225. Incidentally, I do not know why it is 223.6% instead of say 238.2%
Yes, I am quite interested in shorting Treasuries, especially in light of the upcoming elections which should tie the Fed’s hands for a bit.
The wisest policy at this time may be buying the dips of US Treasuries. Why? Because the world economy is weak and there are no plans for any increased spending by the US government. In addition: should US stocks falter there would be a mad rush into the safety of treasuries. US Treasuries might be rallying until the elections in November which fits with a Delta L-2 as a high.
It seems “eveyone” has gone bullish. I have two conflicting chart set-ups:
I guess the SP500 is a “widening falling wedge” where we expect 79% rise.
http://fxpro.ctrader.com/c/pMp0n
Whereas the DOW is a “narrowing rising wedge” where we expect to see a fall?
DOW : hhttp://fxpro.ctrader.com/c/PMp0n
Perhaps if the DOW rises above 18800..then we really are going up up up??
Hey Pulp
FWIW, and just my own view – I don’t see much apart from a choppy topping process UNTIL the break out a week to 10 days ago tying in with the near parabolic rise out of the Brexit hole. That rise is in a rising wedge pattern itself, which I will probably try to trade once the mania phase stops.By just looking at your graph (I haven’t been trading SPY for a good while) the wedge could easily keep going to 2210ish or whatever, but I need to look at my own chart with some other indicators on there, as I suspect if you had MACD and RSI on there, those are probably not following the rise, but rather showing growing divergences.
Just a note that as it is earnings season coming up and 90% of companies will be reporting in a fairly concentrated period just watch out for all those big gaps that are probably going to happen as well as high volatility.
J
Very good advice. Thank you.
check NFLX for example…..
This is a 5 min chart of the DJIA since the 18th July high and I’ve drawn a ‘parallel lines’ channel which it seems to be currently adhering to. So….once the channel breaks we’ll have a better idea of where things are headed.
https://postimg.org/image/wv6nvvb01/
Beware that just before the actual break out there may well be a false one at the ‘opposite’ end.
The drop I was expecting has not yet materialized and if it doesn’t start properly this week I think the market can push on higher. Tom Lee’s 2350 S&P target is a very realistic probablity and with yields creeping even closer to zero I won’t be surprised to see the S&P dividend yield at 1.5% or lower over the next year or two. This implies a massive move to the upside obviously expanding the largest asset bubble in history.
My thoughts are that VIX hit new lows at 11.97, and it would be quite unusual if the market topped right at a VIX low. Of course, a pullback is possible, but I haven’t seen a lasting top that gives bears puts at the lowest prices.
Krish
Why were you expecting a drop? Why does it have to happen this week? Why is 2350 a realistic target?
Thanks
J
Education through interrogation. I like it.
Late Spring/Early Summer it looked like the American Farm Sector would have a great year. But now, it looks like a total financial disaster awaits American Farmers come harvest this Fall. Note that Wheat and Corn futures have broken down to new multi-year lows and Soybean futures are trending lower.
Given the decline in American farm futures (meats and grains) and the JOLT report points toward a declining US economy going forward.
Isn’t the US economy bigger than just agriculture?
Yes, but the Farm Sector is the “heartland” of the American economy. My arguments early this year in that the adage “sell in May and go away” was based on the Farm Sector have proved correct in so far as stocks have rallied to new ATHs. But now, with Corn and Wheat futures breaking to new multi-year lows makes the argument to sell stocks instead of buying them.
Note that Delta “1” points are the most powerful Delta “crash points” and that Corn, Soybean, Wheat, and Oat futures are crashing down to low I-1s. In other words, from the Delta wave counting method they really are -crashing- and will take the Farm Sector and Heartland of America with them (and the general economy?).
BTW: It isn’t solely an American Farm Sector disaster/crash; it is a World Wide Farm Sector disaster/crash.
Here is what would make me the HAPPIEST MAN ON EARTH. (The bit in the top right hand rectangle occurring on the DJIA.
https://postimg.org/image/47f1ujjsx/
I KNOW, I KNOW…..I’m the saddest man on earth….but it would be WONDERFUL!!
Did someone ask why? Oh because the up wave from 27th June low will then be a clear 5 waver and complete a bigger 5 waver from Feb low. Beyond that you’ll have to look for my earlier posts to understand.
SP500 chart from 1998, showing the same “primary distribution-shakeout-second chance” pattern shown by John above (used to be called Three Peaks and a Domed House): https://www.mql5.com/en/charts/5490806/spx500-d1-ig
And sentiment was similar to late 2015/early 2016 too – some quotes from July/August 1998 via CNN:
“…U.S. stock markets continued their sharp decline… amid growing concerns over Asian economic pressures and political uncertainty… There has been tremendous complacency… frantic merger activity… rampant speculation in Internet stocks… a lull in corporate earnings reports… helped shatter the three-year buying streak that fed the raging bull market”.
The expected waterfall declines and bear market did eventually happen, but a bubble got in the way – same as now…
The “bubble” is the back loading of corporate earnings for the year 2016. How is that happening? The first half of the year was an earnings disaster. But the pundits and economists still cling to a yearly increase like it was the foundation principle of a religious belief. To still have the yearly (2016) increase the third quarter must be very good and the fourth quarter must be super in order to average with the negative first half of the year to make a yearly increase. And this is exactly what is going on. This is why expected earnings growth for the fourth quarter is going to the stars. There is absolutely no reason for the fourth quarter of 2016 to have stellar earnings growth but the pundits must keep calling for such in order for the year to be positive other wise……
The American economy is like the Emperor with no cloths: no corporate earnings. Yet, the American economic “emperor” is being led to believe that as he walks into the second half of 2016 kingly cloths (fantastic earnings) will appear that will cover his nakedness back to the first half of 2016.
Mark, please may I ask where on your 1998 chart, do you believe, we are NOW? Thanks
purvez – that chart covers March 1997 to October 1998 as shown by the two vertical dotted blue lines on this expanded chart: https://www.mql5.com/en/charts/5494518/spx500-d1-ig
SP500 is already at the red dotted line (corresponding to late 1998/ early 1999). I don’t expect this historical rhyme to continue so precisely though – they never do once they become obvious.
Bearing in mind that the right hand half of this chart shows the manic stage of the 2000 US stocks bubble, it is striking how mundane it looks on a day-to-day basis. In fact only around 55% of trading days are positive during the manic phase.
I’ve included the RSI as a reminder of how irrelevant these standard indicators become when a market decides to bubble up.
Ouch Mark, you seem to be saying that we have a VERY LOOOOONG way up to go still. Am I reading you correctly?
I’ll have to pay very close attention to the day to day gyrations if that’s the case.
Thanks for the ‘heads up’.
If you are right as to where on this chart of yours we are now (big if?) – this would be very interesting both in terms of trading such a period again under very different circumstances but also with the extreme levels of risk/stress in the banking system we have now, I suspect the next year or two will end up being very painful for many.
Thanks
J
The following is my attempt at breaking up a post I made earlier which was ‘awaiting moderation’:
I’m basically going to break it up into 3 parts to avoid having more than ONE link in the post. I know John may not be able to moderate at the moment:
————–
I came across this site for the first time today:
https://www.socialeurope.eu/
————–
Part 1 of 3
—————-
There are a number of articles there that have ‘interesting’ headings. I’ve read the following 2 and would recommend them if you are interested in the EU.
https://www.socialeurope.eu/2016/07/ecb-dangerous-crossroad-berlin-endangers-qe/
——————
Part 2 of 3
Here’s the second link:
————————–
https://www.socialeurope.eu/2016/05/the-case-for-germany-leaving-the-euro-gexit/
————————-
UGH!! I was supposed to end with Part 3 of 3 in the last post above….BUT then you guys knew that, right?
I have a free posting going into detail about my new model for the S&P500. Check it out! http://navigatethemarketstorm.com
Quite a few people on social media are calling higher, and less are calling lower.
US30: Diagonal line trading: http://fxpro.ctrader.com/c/fwd0n
This market is perplexing. No trading for me until the direction becomes clearer. I don’t really believe we are just going to continue heading higher based on nothing more than the promise of central bank sugar money.
Sometimes having no positions is the best thing.
Is the USD about to “drop like a rock” and Gold soar?
DAX is probably going to explode higher once it overcomes this resistance. No stopping the ECB sugar rally for now. The US markets simply refuse to start a move lower but i want to see a breakout upwards to confirm the start of another big rally. Still feel a correction of 5-6% is due but we’ll have to see if the central banks will permit that to happen.
JHs new report should show that the Demographic Argument did not apply to the USA even though it does apply to Europe and Japan.
SC-24 did not crash US stocks even though it did crash Crude and that crash in Crude might not be done yet.
US30 having a bit of a pull back: http://fxpro.ctrader.com/c/zYx0n
Good read : http://www.hussmanfunds.com/wmc/wmc160725.htm
Still pretty clear to me there is virtually zero chance of a bear market in the next year or so. DAX has recovered all of the Brexit drop so clearly the Brexit is presumed to have zero impact on europe. I forsee zero economic events that could change this scenario apart from rising central bank interest rates and Deutsche bank going bankrupt without a bailout from Germany.
Are you reversing your shorts and going long then? I wish JH would send an update soon.
In the meantime, there is a lot of still relevant information in John’s posts from September 2012 when he predicted a new secular stocks bull market: https://solarcycles.files.wordpress.com/2012/09/17sep691.png
That is exactly what has in fact happened since. The main difference between his view then compared to now is his own work on demographics, but in this current post he did point out this:
“Hope for a more positive outcome [than waterfall decline/long bear market] could be seeded in (1) major paradigm shifts from technological evolution (2) a shift to pro-active immigration policies in the major nations to alter demographics or (3) countries with positive demographics such as India and Brazil become much more dominant in the global economy to offset the others”
(1) major technological evolution (along with cheap energy and rising land prices) is the typical scenario from Minor to Major Lunar Standstill (2015 to 2024),
(2) has already started,
(3) is virtually guaranteed.
US30 – Just about to hit a median line bounce or drop through: http://fxpro.ctrader.com/c/JBD0n
I went long the DOW today. I have changed my S+P 500/DOW Medium Delta rotation so that the evens are lows instead of highs. I have already changed the Intermediate rotation so that the evens are lows but I am holding both Long Term rotations and the Super Long Term rotations even numbered points as highs. The Brexit vote caused a high Medium Inbetween point so that M-2 was the Brexit low and high I-9 brought in M-3 and low I-10 just brought in M-4.
I am now looking for the coming high Intermediate One point (a “crash” point) to be an extreme high that brings in L-10 and L-4 before the major downturn to L-5 and, maybe, just maybe, SL-7.
I have taken a small profit and reversed to short the DOW expecting a disappointing GDP report to trigger a sell-off with over half the S+P 500 companies already reported Q2 results (no more upside surprises).
Just an observation — if you are working on a long term view, and change your positions in one day, it means one of the two wave counts you had on 28th or 29th is incorrect. If you keep flipping fast enough, you are correct 50% and incorrect 50%.
I am going long Crude. The USD is “dropping like a rock” just as I expected.
Stagflation: The most important thing happening in the markets is not the collapse of US stocks but, rather, the collapse of the USD. Evolve or economically die off.
I’m offering a free month trial, if anyone is interested email me, mailto:alphahorn@hotmail.com and I’ll send you the password that will last thru Aug 31. Control F alphahorn on this page and check out my calls. We’ve nailed this.
The future of QE helicopter money, straight from the horse’s mouth: http://www.bankofengland.co.uk/research/Documents/workingpapers/2016/swp605.pdf
CBDC – Central Bank Digital Currency
“We emphasise, though, that any issuance of CBDC need not be predicated on the
withdrawal of banknotes from circulation. It would be perfectly plausible for the two to operate
in tandem alongside commercial bank deposits. Furthermore, as our simulations will show, there
are reasons to believe that, when searching for expansionary monetary policy options at the ZLB,
the injection of additional CBDC would represent a promising alternative to negative policy rates,
thereby removing part of the rationale for the withdrawal of bank notes”
So we’d be able to keep our cash in bank accounts after all (under increasing risk of bail-in). And the problems of negative interest rates avoided by inflating the new digital currency instead.
No wonder people have already started moving their wealth out of “money”.
Truly unprecedented helicopter money. I don’t know where it will all end.
If you find out where it will all end, please let me know..!
Money has to have some intrinsic value (if it is to be used as a medium of exchange and store of value), and it can only have value if it is relatively rare by being difficult to obtain. Easily reproduced electronic money must rapidly become worthless, and if it “operates in tandem” with banknotes then those banknotes would rapidly become worthless too.
But the use of banknotes has already been declining, and could fall rapidly further when CBDC is introduced (I don’t think Central Banks intend to actually print significantly more paper banknotes). What if ordinary people start a black market using the remaining banknotes? Their value could rocket as official currencies hyperinflate…
Electronic-only “People’s QE” is the new thinking – gifts from the government of painless infastructure spending, universal incomes, pre-paid shopping cards etc (on the condition that you’ve handed in all your banknotes, and promise to spend your new gift quickly).
Talking of the effects of hilicopter money etc., I’ve seen some people recently referring to this book (I haven’t read it so can’t recommend it): https://www.goodreads.com/book/show/32082.The_Great_Wave
…”Records of prices are more abundant than any other quantifiable data, and span the entire range of history, from tables of medieval grain prices to the overabundance of modern statistics. Fischer studies this wealth of data, creating a narrative that encompasses all of Western culture. He describes four waves of price revolutions, each beginning in a period of equilibrium: the High Middle Ages, the Renaissance, the Enlightenment, and finally the Victorian Age. Each revolution is marked by continuing inflation, a widening gap between rich and poor, increasing instability, and finally a crisis at the crest of the wave that is characterized by demographic contraction, social and political upheaval, and economic collapse…Fischer suggests that we are living now in the last stages of a price revolution that has been building since the turn of the century. The destabilizing price surges and declines and the diminished expectations the United States has suffered in recent years–and the famines and wars of other areas of the globe–are typical of the crest of a price revolution”
Sounds familiar, but the question is whether we’ve passed the crest of the wave or have it immediately in front of us.
Mark, have you seen this?
http://www.image-share.com/ijpg-3293-46.html
Thought you might appreciate the long history to check if it fits with your lunar/solar theories.
That’s fantastic actually – thanks.
Not only does it put stocks values in long term context, but it also puts the timing in context too. I mean – look at that long list of crises, defaults, wars and bankruptcies etc. Its like continually stumbling from one crisis to another, but looking closely there’s often 10-30 years between them, and I bet people back then were thinking the same as most do nowadays – that we’ve learned from the past and now have things under control.
Check out the listed land price bubbles and bank crises (most loans are secured on real estate) against the Major Lunar Standstill years (eg. 1797, 1819, 1837, 1856, 1874, 1893, 1911, 1930…2006). Bear in mind that a standstill is a three-year process. The difference this time (2006/8) is that the regular banking crisis wasn’t allowed to complete…
Have a look at the Bradley 1852-2040 siderograph here: http://www.amanita.at/en/interesting/articles/bradley-siderograph-archive-since-2007
Most noticeable are the biggest Bradley spikes down in 1931, 2010 and 1876 coinciding with major stocks lows and also Major Lunar Standstills. But its not that simple – for example the lowest Bradley reading of all was 1648, which marked a major stocks high (and there are other apparent “inversions” too). The Bradley highs are significant too (eg. around 1997/Minor LS), and 1942-6 and 1949-1959). Most interesting, I think, is the unprecedented surge in speculation indicated from 2009 until 2027 (Major LS will be 2025), but there is a large countertrend from 2017 until 2020.
Quite a good fit especially for the 1800s. I can’t imagine life back then. I am amazed that there are so many railroad bubbles and bursts — which means we could get several cycles of Internet bubbles and burts in 2000s too.
I am still trying to understand why LS works. For example, my asthma disappears in June and December, because annual temperatures are at their turning points. I do believe that a full moon affects circadian rhythms. But the analogy doesn’t work for LS, because it is a change of a change, which might be so subtle for the human body. You can measure speed with two snapshots, but require three for acceleration. Perhaps you answered the question, with the 3 year window for human detection.
June and December? maybe you’re very sensitive to the changes in the geomagnetic field at the solstices? The moon partially shields us from solar wind (electric charge/ smaller particles/ magnetic flux etc) at new moons, and reflects 1-1.5% back onto us at full moons, depending on the moon’s declination. That declination changes as the lunar orbit precesses, which forms the standstills when combined with the earth’s changing spin axis during the year.
All of this influences the extent and timing of geomagnetic disturbances, and those disturbances reduce the strength and resonant frequency of the geomagnetic field (normally 7.83Hz Schumann resonance). The magnetic activity in our brains is 5-12Hz.
But there’s another way it affects us: many animals with large territories (whales, birds, wolves and dogs etc) can see the geomagnetic field in colour via cryptochromes in their eyes. Humans have cryptochromes too, but we’ve long lost the ability to use them. However, when human ones are transferred into genetically-modified blinded fruit flies, the flies regain their magnetosensitivity – in other words, human cryptochromes still work even though we don’t use them.
http://www.popsci.com/science/article/2011-06/humans-might-be-able-see-earths-magnetic-field-without-realizing-it
Ever studied a dog having a dump? What? NO???
They align themselves North-South during this vulnerable moment while outside the protection of the pack. But they can only do that when the geomagnetic field is in its normal “quiet” state; when it is disturbed during a geomagnetic storm they crap in any ol’ direction: http://frontiersinzoology.biomedcentral.com/articles/10.1186/1742-9994-10-80
Maybe human nervousness during geomagnetic disturbances originated from the same thing.
It isn’t “natural” to set on a stool to take a dump. It is natural to squat or bend over and “blow it out your a–“.
I have re-shorted the DOW with the S+P 500 at a new ATH.
Regarding my adult asthma, it begun in 2011. I don’t know the significance of that year. I kept detailed journals of having to spray every day or every other day. The food I ate, etc. I tried everything to cure it, and I thought I did several times, but it came back. I blamed a Christmas tree in January for spreading mold, and did allergy tests and everything. Looking back now on 5 years of logs, I find that the months I am “cured” were all the Decembers and Junes. This meant I can go through the entire month without medication. That was followed by a depressing January/July where it came back even stronger. I thought it was to do with temperature — but January/July is the coolest/hottest month, so the best times were one month before the inflection.
I thought about Perihelion and Aphelion too. Roughly start of Jan and July for our lifetimes.
http://earthsky.org/todays-image/july-4-2016-sun-at-aphelion-photo
I just noticed that you are right. The Solstice falls 21st December, and could explain it as well. Is the effect the same regardless on where on earth I am physically located?
Testing dog dump on my friend’s dog. So far it seems north-south, but because our city street is a grid, it is not a good study.
Although the solstices (and equinoxes) are worldwide events affecting the geomagnetic field as a whole, there are significant differences in the level of disturbance in different locations – Ap, aa and Dst are measured at several observatories and averaged.
Looking at the strongest ever 25 Dst storms and the strongest 25 aa storms, I see that none of them occured in June or December (all other months were represented). Nobody really knows why geomagnetic disturbance is strongest at the equinoxes and weakest at the solstices.
I don’t know if anyone has ever discovered a link between these disturbances and asthma specifically, but there is a definate link with general health: http://holographicarchetypes.weebly.com/schumann-resonance.html
US30: Bounced off the top of a couple of diagonals and pitchfork median: http://fxpro.ctrader.com/c/qHv0n
It cost blood to get this short at the top point on the US30. was it worth the effort? and is it better to layer in the shorts. http://fxpro.ctrader.com/c/4N20n
Today I have doubled upped on my shorts. The S+P P/E ratio is over 18 which is historically high and warns of a sell-off. This Bull market must be constantly feed with more positive news. There are no major American economic news reports until Friday.
Note that the Bloomberg positive surprise news is likely topping out and can’t keep going up for ever. (Besides, it would be great bragging rights to have shorted on the day of the ATH of the S+P should it be a major/historical top.)
Or the S&P could keep on powering higher. I think the top will be 2300+ but like you I expect a sizable correction very soon (starting in the next few days)
Where is your downside target Richard? I’m thinking 17000 area for DOW before we rally back to 19000+
This is the most important post I have ever made on this site: The Delta Super Long Term odd numbered points are highs not lows. Also, the data for the Super Long Term points is skewed for the odds to be earlier than what their true stats are and the even numbered points are skewed late. Thus, high SL-5 came in on May, 2015, even though it is outside its “100%” range that was calculated for low wave points in a two hundred year bull market meaning that those points were early on average. But now that SL-5 is a high, in a bull market, its “true” 100% range is showing itself. What this means is that the data for the Super Long Term points isn’t worthless but it might be close to it. Tsk, tsk.
Richard I, please may I request a synopsis of your esteemed thesis that my 2 brain cells can understand. Something along the lines of this therefore means…..the markets will go up/down/sideways for X period of time OR till they reach Y point.
Many thanks
Reading this with interest, but is the conclusion that Delta is close to worthless, to paraphrase you final sentence. So time for a new model?
Look at the DAX explode higher. Mario ‘whatever it takes’ Draghi is in full control probably with a glass of $400 wine in his hand smiling as stocks soar on his fabulous monetary policy…while the economy continues its slow decline. Hope no-one took the recent advice of Goldman Sachs to sell the market as they maintain an almost 100% track record of being wrong!
Woohoo 10600 on DAX. My long at 10475 on the break of the descending trendline is looking fantastic now. Taken 50% of profits at 10600 and stop on rest at 10600. Target is 10650 to close all. I was expecting to grab 50 points only but Draghi has been very generous today. The DAX bull market is back and roaring. New ATH’s are my base case scenario now after some sort of decent correction. Big bull market on DAX has just begun.
10700 on DAX. Its like 100 points an hour this rally. Hopefully has demolished all the bears today.
The American Bull Market passed away today at the rip old age of 237 years old. It was born in 1779 with a Delta low SL-1 and died in 2016, at the half-way point of a Delta 19 year (counter)cycle, with high SL-7.
R.I.P.
At the death of the American Bull Market an American Bear Market was born. It will trend lower with lower lows and lower highs to 2025 to its SL-14 as the lowest of its even point lows before it crashes in its Super Long Term Inversion Window as the next Mini-Ice Age comes on with a vengeance.
Cool. So any further ATH’s invalidate your big call right?
The American Bull Market lasted for 12 and 1/2 Delta 19 year cycles from 1779 to 2016. The 1722 height in European stocks was the end of a Delta 19 year cycle with its typical wave point number 14. From 1722 to the American stock price low of 1779 (the British stock price low was 1784) was exactly three Delta 19 year cycles (57 years). I suspect that the last two Delta 19 year cycle’s waves had the evens as lows in that 57 year time period –and– that point 7 was the high with two Super Long Term Inbetween points that changed the second rotation and changed the rotation again before the 1 point low of 1779 so that the evens were highs again until 2006.
If it turns out that point 7 was the high of about 1750 then there is a pattern pointing to a Guideline that Delta Super Long Term wave rotation changes don’t turn the trends at the Inversion Windows but at the mid-point of the 19 year cycles which is point 7. This would point to “why” point 7 had to exceed point 5 (May, 2015) even though point 6 is a very late low and point 7 is an early high which means the trend is strongly down and, thus, point 7 should not have exceeded point 5’s (May, 2015) price height. Of course, if this is a new Guideline then it also explains “why” point 7 has only barely exceeded point 5’s price height when the trend is actually strongly down.
If I am correct then there have been at least three Delta Stocks Super Long Term Inbetween Points with two of the trend changes occurring at point 7s (1750 or so, and 2016) and one trend change at point 1 (1779).
Opps, my error, the South Sea bubble highs were in 1720 and the crash low was 1722. 1720 to 1929 is exactly eleven 19 year Delta cycles which means that the South Sea bubble top was wave point 14 of the 19 year cycle just like it was in 1929 and 1987. The crash low of 1722 was the 1 point just like in 1779 for US stocks and in 1931. 1722 to 1779 is exactly three 19 year Delta cycles of point 1 to point 1 and eleven 19 year Delta cycles from the point 1 low of 1722 to the point 1 low of 1931.
I just had a new thought: What if crashes into Mini-Ice Ages are always from a high Delta Super Long Term point 7 to a low point 1 that is 29 years later? What if the crash into Mini-Ice Ages is always preceded by two Delta Super Long Term Rotations with the even numbered points as lows? If so, then if the current Super Long Term point 7 is a high than the Bear Market in Stocks won’t bottom until 2046 which is deep into the next Mini-Ice Age.
Start looking for “waterfall declines” as the Baby Boomers turn “fearful” about their futures and start “panic selling” in the here-and-now. (Concerning employment in the USA, age and background discrimination is rampant and most Baby Boomers already know it which means that fear will begat fear and selling will begat selling.)
Cheers. I do hope the waterfall declines start as you say. And if they do you can give yourself a pat on the back as you will be the only person in the last 2 years to predict waterfall declines and be correct! Just to be clear how big a drop are you expecting in the first main wave and what is the timeline for it?
The recent surge in sunspot numbers is the start of the final phase of Solar Cycle 24, where sunspots (ISN) die away completely after Q4 2016 from their final low range (see comments from 01 May above). There was a surge in speculation after the anticipated Q2 2016 breakdown below 50 (ISN), and there should be another even bigger surge starting early in 2017.
A bubble phase led by SP500 started either mid-February 2016 with the final surge up through 1888 (SSN Smoothed Sunspot Number peak April 2014) – dark blue bold lines on this chart: https://www.mql5.com/en/charts/5602200/spx500-w1-ig-group-limited
… or the final surge above 2065 late June 2016 (turquoise bold lines).
The interim dotted lines and final bold lines (parabolic highs either July 2017 or November 2017) are typical timings from previous bubble phases in Dow 1929, oil, gold, NASDAQ, Toll (US house prices), EURGBP and Nikkei.
Since April 2014, SP500 has only managed one week below that SSN level.
Manic speculation like this was common during the late stages of previous weak solar cycles, when it continued well beyond the SSN max.
Corresponding times for manic highs according to previous weak cycles are:
SC16: Sep 2015
SC7: Feb 2016
SC1: late 2016/early 2017
SC10: June 2017
SC17: July 2017
SC13: Nov 2017
See also some comments from 01 March 2015: https://solarcycles.net/2015/03/01/saturation-again/#comments
I agree on SC16, but I either have different dates for the market peak or I am using wrong dates for the ISN peaks. Definitely agree it is hard to find the comparisons before 1900s. For SC13, what are your dates for the ISN and market peaks?
They’re not ISN peaks, they’re ISN breakdowns (from their previous range) measured in months from the start of each solar cycle. I’ve been making the point for the last four years that these are much more important than sunspot peaks (and in particular the smoothed SSN peak) in weak solar cycles.
In SC13, ISN started to break down below 80 towards 50 during February 1896, bouncing off 50 four times until November 1896. It then broke below 50 towards 20 during May 1897, and finally below 20 during August 1899.
US stocks more than doubled between September 1896 and April 1899, forming a “second chance” slightly lower high during September 1899.
My November 2017 estimate is based on a combination of both ISN and market activity, but looking purely at ISN own its own indicates April 2018.
So far, the timing of SC24 and speculation under it have been typical of those previous weak cycles, but I wouldn’t get too attached to any particular one of these exact dates though, because those previous cycles were not all exactly the same and SC24 won’t be either.
Yes, I do recall we were talking about breakdown from range highs. Sorry about that. I have to update my spreadsheet which is automated — perhaps a Kalman filter.
It is strange that the panic of 1896 gets the press but not 1899.
https://www.armstrongeconomics.com/panic-of-1896/
http://history1800s.about.com/od/thegildedage/a/financialpanics.htm
“In early May 1893 the New York stock market dropped sharply, and in late June panic selling caused the stock market to crash.”
I have off-set my shorts with a small loss. I am satisfied with my Super Long Term rotation solution. I am now taking a hard look at the six point Long Term rotation. I makes more sense that an early six point rotation L-2 came in with an historically late SL-5 in May, 2015, than an Inbetween Point did. With L-3 coming in one month late in Feb, 2016, with SL-6 just one month short of its 100% range is not usually and speaks of a powerful down trend as both are late lows. This points to both L-4 and SL-7 coming in early too. Problem is, SL-7 is due in Feb, 2017, and L-5 is due this December. That allows plenty of time to go higher in price for both to still come in early, together, any time before December. As of today, I am thinking that the coming Intermediate 1 point will be a high that brings them in. Of course, a 1 point is a “crash” point and that means that in the process stocks could “crash” upwards with all the points coming together. Therefor, I have offset my shorts and I am standing aside, for now, to reshort at higher prices. (I might take a long position too for the spike high to come.)
How do you calibrate a model from years in 1700 to 2016, and yet find the accuracy for month-to-month? I ask this because I don’t know for example when (i.e. which month/day) the 1873 peak is — newspapers only talk about the waterfall.
I’ve taken shorts on the DOW today expecting a turn down tomorrow. If not I will close out before the weekend.
DOW shorts were closed out. To me it is crystal clear we are not in a bear market so I expect shorting will lead to a lot of frustration unless timed well.
At the risk of repeating myself…..this is my big picture count:
https://postimg.org/image/pgurijw6x/
I believe that we are reaching the ‘VERY TIPPY TOPPY, PENCIL SHARPENER’ point of this wave and then we can start our multi thousand point DJIA descent.
As most of you know my trading style is to try and achieve 50 points on the DJIA per day. In the summer months I have to ‘get by’ on 20 per day.
However I have now got a position put on which I intend to hold ALL the way down till the end of the ‘C-Wave’ as shown on the above chart. Of course I still intend to carry on trading for my daily quota of 20/50 points per day.
I DO HOPE it happens the way I see it.
Whats your timeframe for the drop if the impossible happens and markets drop heavily?
Krish, I don’t have a ‘time frame’. However I WILL be counting the waves to get 5 waves down. Once that happens I’ll be out of the position. I’m hoping it will be below the last August lows for the DJIA by the time the 5 waves occur. I’ll keep posting my count here as it progresses.
I am however expecting the actual ‘drop’ part to be quite short in time. Waves ‘C’ & ‘3’ are usually the strongest and therefore achieve large distances in short time periods.
I have been listening to Schumann’s Resonance, inspired by Mark’s comment above. So far, it makes me very sleepy.
https://www.amazon.com/Schumanns-Resonance-Your-Mind-Bbetteru/dp/B00OHE0730/ref=sr_1_1?s=dmusic&ie=UTF8&qid=1471491063&sr=1-1-mp3-albums-bar-strip-0&keywords=schumann+resonance
Here is an idea : https://realinvestmentadvice.com/liquidity-trapped-the-feds-policy-nightmare/
There’s a lot of talk at the moment that US stocks must crash, because the last time SP500, Dow and Nasdaq simultaneously made new all-time highs was late 1999.
But the leading index now (SP500) is completely unlike the leading index then (Nasdaq).
SP500 over the last 3.5 years: https://www.mql5.com/en/charts/5644984/spx500-w1-ig-group-limited
Nasdaq during the 3.5 years up to early 2000: https://www.mql5.com/en/charts/5644991/nas100-w1-ig-group-limited
I see what you are saying. On the other hand we have the ever negative ponziblog with this chart:https://4.bp.blogspot.com/-QdT7xotMugk/V7YVqWBkcNI/AAAAAAAA9cs/EB5NdFC8Q2kiN-ZFq_XprvOzvYpPqCgAACLcB/s1600/wedge.png
My graph of S&P from 1871-1899
Interesting to see different perspectives like this. Are you using a log scale? It makes it look like the nothing much was happening then, wheras in fact those were some of the most volatile years ever in the stock markets.
Stock prices tripled between 1877 and 1881. They dropped 38% between March and August 1893; dropped 34% between September 1895 and September 1896; dropped 32% betweenlate 1899 and 1900; dropped 46% 1901-1903; and the rallies between were even bigger.
And that rally shown in your chart from October 1896 into 1899 more than doubled the Dow from 29 to 78, under similar solar circumstances to today as ISN broke down (weak SC13) into new lower ranges: http://www.solen.info/solar/cycle13.png
There has always been increased volatility during ISN breakdowns in weak solar cycles – sometimes stocks are driven dramatically up, sometimes down, depending on the other circumstances at the time.
Sorry for the delayed response. I have been enjoying the beach in Cape Cod. I had time to visit the NOAA research center at Woodshole.
Yes, it is a log scale.
I see your point on 1896-1899. The low in 1896 is 3.81 and 1899 peak = 6.48. It would drop to 5.4 or -17% by 9/1900. Then it would continue to 8.83 at the EOM of 8/1902. It then drops to 6.26 lows in 1903.This is the sitched together version of SP500.
Here is a better graph.

My Bloomberg shows the drop in 1900 to be -32% for the Dow Jones (vs -17% as stated above). The 1903 drop is -38% on Bloomberg. Go figure. Bloomberg does not have data before 1898. Given the smoothed ISN min mid-1901, it would seem that the solar min, rather than solar max “caused” the 1903 crash.
I am fascinated that so much is written about the 1873 crash, but it was relatively small in the US stock market. Businesses may have failed and Austria hit badly in 1873, but the bigger drop for the US market was in 1876. Given the solar max in 1870, if we consider 1876 as the true crash year, it is yet another example of a delayed crash closer to solar min than solar max. Shanghai 2015-2016 drop was -49%. I wonder if that is our Austria 1873, with little impact on the US markets.
The solar environment during the 1800s, and especially the late 1800s, was closer to what we are experiencing now so is definately a good period to look for guidance.
That “delayed crash closer to solar min than max” you refer to – we briefly discussed this on 4/5 January 2015, when I mentioned that “we could see stocks increasing for another 2 to 5 years [from the SSN max April 2014]”. pimaCanyon posted this link: http://www.amateur-investor.net/AII_Weekend_AnalysisJan_3_15.htm
The “Real Dollars” charts in that link show that there is nothing unusual about recent stock market action when inflation is taken into account – investors 200 years ago had to deal with percentage swings as big (or even bigger) that we’ve seen since 2000. SP500 around 3225 during late 2017 would fit well with a 1835-1999 trendline in the first Real Dollars chart.
You mention 1873 and 1876 – the Major Lunar Standstill was 1873/4/5 (we discussed before how these are three-year processes). Have a look at the other huge stocks peaks shown in the above link (1835, 1853, 1906, 1929, 1999) – these all closely preceeded Major Lunar Standstills by less than five years. The next Major LS will be 2023/4/5, making 2018 a year to watch, and that is one of the reasons why I have been saying that stocks will bubble up into H2 2017.
Currently have a very large long on the DAX from 10530 with a stop at breakeven. I am expecting an imminent explosive more towards 11k for the DAX which should provide a great deal of pain to the bears. A break below the recent lows will negate this view and form a more bearish outlook to just below the 10k area.
This is the first time I have looked at this site since my last post. I just went short. The market did not make a spike high to high Delta I-1 like I was expecting. This points to weakness. Volume is collapsing and that points to a potential crash to low I-2 which is also a crash point.
It looks like Hearting Oil/Crude have made a high Intermediate Inbetween point and are going to crash to their low I-2s right along with stocks. Should Crude and Stocks decline together the declines could be substantial (and unexpected).
Copper futures are dropping like a rock as volume dries up on American stock exchanges. Earlier this year American Ag futures rallied nicely but of late they have reversed and Wheat has falling to new multi-year lows. This means the American Farm Sector has gone from boom to bust over the Summer Season. This is very bad for American stocks and the economy…..
I covered my shorts with a minor profit. Go figure….
DAX: Since the break upwards, there was a backtest, so currently upwards.
http://fxpro.ctrader.com/c/52L0n.
On the mystic side of things, I had read “https://astrologyforganntraders.wordpress.com/2016/08/20/133-years-ago/”….and so i was primed for the end of the world on 26th August….I woke up, with no power in the house. I turned my phone on…and it read on the headline news “Apocalyptic Earthquake”…it was the end as i new it….just thankful not to be buried alive.
Do you ever wish you could retract a post… should have waited until after the jhole thing.
Hehehe Pulp….if you’ve read my posts for any length of time then you’ll know that I’ve had the same feeling about retracting my posts….MANY MANY times. Welcome to the ‘real world’ my friend.
Here’s something that I’ve posted elsewhere on the blogosphere:
———
Let’s say that today’s ‘down draft’ is a ‘tail fake’. In that case this is the next count that I like on the DJIA:
https://postimg.org/image/w0tw152ih/
Yep up we are going! Looking for 2200 S&P hopefully in the next couple days to short it. DAX has dropped but looks like the pullback is complete and we can accelerate upwards this week.
DAX 4hr: http://fxpro.ctrader.com/c/j4K0n.. just testing a diagonal at the moment…and might pop upwards..
BANNNNNG! Look at the FTSE go today. What a beautiful sight for the bulls.
Clear to me that TA is history. A New World Order for markets has been wrenched by the power of insane greed which has harnessed the power of fear of systemic collapse which it induced into CB’s via obtuse and dangerous freedoms to self-regulate for personal gain. This New World Order has already created megalomaniacs that are nothing more than despicable and despotic chimpanzees. There is inevitable intent amongst these New World Order megalomaniacs to purposely destroy the arch enemy known as democracy, and it will do this by whatever means works. There is no longer any resistance. The human swarm either serves the purpose of sustaining the megalomaniacs or they will increasingly serve no positive purpose whatsoever.
There is no escape. Time and its toll has a quantity. Reduce one and the other increases.
Here is an example of a “slater9” .886 algorithm set-up: http://fxpro.ctrader.com/c/ylW0n.. (spotted after the event)
The moderately strong geomagnetic disturbances during early September have faded, but will most likely return either side of the equinox: http://wdc.kugi.kyoto-u.ac.jp/dst_realtime/presentmonth/index.html
This and solar/lunar timing (also decennial pattern and presidential cycle) indicate continued market nervousness into the first week of October 2016 (specifically 4-6 October).
puetz crash window today through next week
6 days prior to and 3 days after full moon within 6 weeks of solar eclipse
Nice timing.
The “Ap-index” chart here shows just how weak geomagnetic disturbances have been during SC24 compared to all of the other solar cycles since the Great Depression (in fact less than half of typical levels): http://users.telenet.be/j.janssens/SC24web/SC24.html#RSC24
Weaker geomagnetic disturbance means less nervousness and less risk aversion. Also, geomagnetic disturbance peaked during Q3 2015 for this cycle and will continue to gradually fade away.
The “Cosmic Rays” chart confirms that SC24 definately peaked during H1 2015. But it also shows that solar activity is already half-way towards the mext minimum, so SC25 will probably emerge quicker than we have witnessed in living memory.
The “Sunspot Area” chart proves how similar SC24 has been to the weak cycles from 1880 to 1930; and how different it has been to the strong cycles from 1940 to 2000.
The “Absolute and smoothed sunspotnumber SC23-SC24” chart shows the distinct ISN breakdown (grey line) which always trigger major market moves during weak solar cycles. The next one is due Q1 2017.
From the astrologer: today is 9 9 2 0 1 6 which in numerology is 9 9 9. Can this be used to explain the reason for today’s North Korean Nuclear Test?
Numerology makes no sense to me at all…Why is modulo 9 so important?
I’ve googled it and come up with this “http://foreverconscious.com/numerology-spiritual-significance-992016” ..(which sounds like classic astrologer speak).
I was reading “https://astrologyforganntraders.wordpress.com/” and that is what made me aware of this date. The next disaster date is 16th Sept (doesn’t necessarily mean stocks – it could be an earthquake or eruption).
On 21 August 2017 the USA will be divided by total darkness: http://www.timeanddate.com/eclipse/solar/2017-august-21
Directly under the path of total solar eclipse:- Jackson Hole Wyoming, where the Feds meet “late August” each year (not sure what their exact dates are for 2017).
Mark, Thanks for that date 🙂 DAX: http://fxpro.ctrader.com/c/bwt0n
A Japanese research team found that large earthquakes are more likely to occur at times of a full or new Moon. Tides arise from the effects of the gravitational interaction of the Moon and Sun on a rotating Earth. This could put extra strain on geological faults that are already close to slipping, the team reports. The researchers led by Satoshi Ide, from the University of Tokyo, have published their findings in the journal Nature Geoscience.
Interesting to see market nervousness around this equinox is relatively subdued compared to the same periods during 2015 and 2014. That was to be expected as the geomagnetic disturbance peak associated with SC24 was 2015, as I have been pointing out here since early 2012.
So we have geomagnetism declining from its peak at the same time as sunspot numbers decline from their peak – it has been 86 years since they peaked and declined together (beyond human memory).
And we are in that period between minor and major lunar standstill, which typically sees interest rates slowly rising; credit steadily expanding; cheap energy; land values increasing etc. These periods of expansion follow the banking/ financial crisis associated with each previous major standstill (eg. 1820, 1837, 1857, 1873,1891, 1907, 1930… 2008). These crises are caused by real estate values peaking and declining, thereby undermining the security on which major loans are secured.
But this time is different because the widespread bank failures and debt write-offs required to solve each crisis have not been allowed to happen. So instead of being now in a debt-free environment with streamlined banks, we have record debt burdens and still-insolvent banks. And we have authorities who are determined to continue fighting against bank failures and debt write-offs. Is iatrogenic (I had to look that one up): where the cure of saving the banks is actually the cause of current and impending financial industry problems.
Normally these crisis-inducing major lunar standstills coincide with extreme negative (disharmonic) readings in the Bradley siderograph (the solar system all being in dynamic balance). But there have been a few occasions where this relationship inverted and the Bradley calculation gave extreme positive readings during a major standstill (1856 and 1948). Both of these years were excellent times to invest in US stocks.
Interestingly, this “inversion” will happen again during 2025 – and this accords with John Hampson’s view that equities should form a deep major low around 2025.
For these (and other reasons I have previously mentioned here) I maintain a 90% probability that US stocks will bubble up until either July 2017 or November 2017. Then (with less confidence) a historic crash into late 2018 (possibly to 1450 on SP500); then a huge bear market rally into 2020 (back to around todays levels); sideways volatility to around 2023 before another historic crash into 2025 (to test the 2009 low).
The narrative for such a bubble over the next year has already started: ie. the illusion that central banks have control of the stock markets, and can keep pushing prices up indefinately.
Very good post, Mark. Excellent commentary on how the solar cycle failed JH this time around, as well as, how the lunar cycle is bullish but will be chaotic earlier than the 2025 “typical” peak. Deutsche Bank is certainly showing that this time is already different!
Thanks Mark,
But can we still expect some beartime now till end of the year or do you think we will continue the bull market.
Thanks in advance.
Based on previous bubble patterns (Nasdaq, Nikkei, 1929, gold, oil, Toll Brothers, EURGBP), solar V lunar timing, presidential/ seasonal/ decennial cycles, we should see continued choppy sideways action with an unconvincing upward bias until around early December 2016.
The first and third weeks in October are the likliest for bigger moves, but these will probably fail and largely retrace.
I would expect to see more sustained positivity develop during December, and then strong gains from the start of January. But everything under this weak solar cycle has been at a snail’s pace compared to what we’ve all been used to, and the biggest moves in a bubble are mostly confined to the last 10 weeks (sometimes 20 weeks), so staying on board a potential bubble could test patience to the extreme.
Yellen has sparked another bull rally. The end is not in sight!
I do believe that Mark is full of confidence in his predictions.
It will be most amusing if/when events prove him quite wrong.
Some examples of why he’s deluded:
‘And we have authorities who are determined to continue fighting against bank failures and debt write-offs.’ Is he ignorant of developments in the Euro-zone? It would appear so, watch that space.
‘The narrative for such a bubble over the next year has already started: ie. the illusion that central banks have control of the stock markets, and can keep pushing prices up indefinately.’
That narrative has not ‘already started’, rather it has nearly ended. The BOJ were just forced to taper their asset purchases, as they are running out of bonds. Three dissenters at the Fed, as they realise they are painted into a corner. Too late.
In February 2015 the S&P reached 2118, here we are 18 months later, and it’s added a huge 50 points. Wow, what a huge bubble, 50 points in 18 months. Heh. All the while, S&P earnings are heading south. The re-connection will be brutal.
So many out there are convinced its different this time. The usual fools who are uber-bullish at major peaks. Mark is one of them. Tread carefully.
I miss JH. What happened to him?
I found this from 2011.
http://seekingalpha.com/article/269525-11-reasons-why-the-cyclical-stocks-bull-market-will-continue
Many of the reasons for a bull market — low rates, low inflation, positive momentum still seem to be true.
So nice to see Melchie still hanging on my every word.
Its a pity you didn’t put my words into action though, for example during November 2015 when I said that a stocks bubble would really get going between 16 and 19 January 2016.
If you had, you could have bought BRZU and extremely cheap SP500 long-term call options (as I did). Then you would not need to be so worried about anyone who bought at “peak” prices.
And you’d feel better about yourself too, as you’d would have felt the satisfaction of success rather than begrudge others theirs’.
I wonder why Mark reacts so aggressively to different points of view?
I wonder Mark felt the need to fake up his ISA value and share it with anonymous strangers?
I wonder why he posts his nonsense on a dead blog?
I wonder why he mentions ‘feeling better about oneself’?
Clearly he judges ‘success’ as reporting trades retrospectively.
Well, he’s welcome to that success, and the comfort he derives from it and the retrospective broadcasting, he must be very proud indeed.
Meanwhile, I note he did not address a single one of my salient points, nor can he spell indefinitely.
Time will prove everything, indeed, it already has.
In regards to GM’s post – a fool and his money are soon parted
Mark,
Thanks for your reply,I think we will see a corrective move till end Okt or first week Nov.
There’s a whole lot of “wonder”ing going on.
In some cases, an unhealthy amount of obsessive vindictive “wonder”ing at the circumstances of a stranger.
In most cases, a bewilderment at how the stock markets could possibly have been going higher. In November 2015, Jegersmart told me that the idea of higher prices in 2016 would “crash and burn”. Not “fail”; or be “wrong”or “incorrect”; or “unlikely” or anything like that. No, CRASH AND BURN!
You can also see such passionate intensity in the comments of others – these are the fabled “dumb money” “retail investors” who persist in frittering away their wages day after day, week after week, month after month in the markets or in the bookies. What drives a perpetual loser to keep arguing with others, and fighting against the markets indefinately?
I believe its because they’re actually “right” – ie. in the sense that they point out that stock prices are at all time highs; that many of the indicators and metrics are overbought; that economic fundamentals are not good and getting worse; that demographics point downwards etc…
What they can’t understand is that these are all widely known, and already priced-in, so the markets will mostly do the opposite of what they widely expect. So what are these perpetual losers to do? – they would have to start betting on the opposite of what they passionately know to be right, and they just can’t bring themselves to do that. So their small losses gradually accumulate into a total wipe-out and often emotional illness as the markets dare to defy their analysis.
Humans generally do not like these nature-driven times of real change:
“Turning and turning in the widening gyre
The falcon cannot hear the falconner;
Things fall apart; the centre cannot hold;
Mere anarchy is loosed upon the world,
The blood-dimmed tide is loosed, and everywhere
The ceremony of innocence is drowned;
The best lack all conviction, while the worst
Are full of passionate intensity”
Yeats (1919)
Yep,
you are right keep an open mind learn to switch when wrong.
Or know thyself..
At the moment I m short till Okt 6 after that long again… even if Deutsche bank crashes…
Good luck to all.
Mark has been quite right all along. Others here, not so much:
I wonder why Mark reacts so aggressively to different points of view?
I wonder Mark felt the need to fake up his ISA value and share it with anonymous strangers?
I wonder why he posts his nonsense on a dead blog?
I wonder why he mentions ‘feeling better about oneself’?
Mark,
What is your outlook on the market do you see big changes with the elections?
Thanks..
‘What they can’t understand is that these are all widely known, and already priced-in, so the markets will mostly do the opposite of what they widely expect.’
I wonder if he actually believes the nonsense he spouts?
Probably.
Markets, never been know to mis-price anything ever? No wild swings of 50%+? Laughable.
Asset managers and financial advisers, always aware of the peaks and troughs? Right.
It’s different this time, because Mark says so? OK.
Time will prove everything.
Senseless, GM, just senseless.
How do you trade this gold chart – do you have to wait for it to break up or down before entering?: http://fxpro.ctrader.com/c/KTnTn
Pulp, I see it as a small pop down towards the 1250 area before it goes higher towards 1450ish to complete the upward correction. Then a sharp ‘down’ to take out the recent lows.
On the pop down you need to be nimble IMO.
For me the inevitable correction is nigh, but ya’ll know that since forever.
Add in the -ve divergence on daily and a new high gonna be hard to find.
XXX
https://barestbodkins.blogspot.co.za/
“those biggest manias of all time share a similar topping pattern that may be playing out again”
I remember being trained about what to do when the nuclear attack sirens go off. Back then the military leaders did not do it for the lucrative power over contractors, they had intelligence in their intelligentsia and statesmanship in their political leaders. So we never had cause to use the training in any real situation which is why we are all still here making a total mockery of it all. Anyway, not long now…
https://barestbodkins.blogspot.co.za/
Has anyone heard from John lately? Here’s wishing all the best to him and his family!
http://thenewsdoctors.com/a-bear-market-in-stocks-began-in-may-2015-dave-kranzler/
Thought about you John upon reading this article. My best to you and yours.
1inbluemoon says:
July 18, 2012 at 2:04 pm
Thank you John for this take on gold. Do you have similar general opinion about silver as well?
Compared to gold it did have a blow off top in 2011 and crashed almost 50% since then. Gold silver ratio is in major bullish alignment with all big moving averages (50/200DMA) pointing towards higher values (~84?) (lower silver prices), this seems to suggest cloudy weather for silver at least and deflationary scenario in general. Do you think silver will disconnect from gold?
John Hampson says:
July 18, 2012 at 2:12 pm
Gold made a big move up in 2011 whilst silver did its parabolic move. I expect the same ahead – silver to be a leveraged gold. In the shorter term though we might see gold start the outperformance, to give way to silver outperformance at the finale. Silver has extreme pessimism readings currently, so I don’t think it’s likely it will go lower.
I am definitaly (haha) enjoying Mark’s inadvertent but clearly accurate smack down of GM. Be a bigger man GM, display your “wisdom” and humbly admit you were wrong.
Seasons Greetings to All here and to our host John and his family. Wishing everyone Good Health and Cheer.
We are now fast approaching the final and most important phase of SC24 as it relates to the markets (January/February 2017), when the monthly ISN should completely fall out of its recent low range – and just when everyone has lost interest in it!
23 September 2016: “I would expect to see more sustained positivity develop during December, and then strong gains from the start of January”. So far December’s gains have been more than “sustained positivity”, and is possibly inverting my Solar V Lunar timing pattern – so either US stocks will have to correct until 1 January 2017, or we are seeing the start of a real mania. Significant weakness from now until the end of the year will mean that the most likely time for a manic top will be November 2017. But further sustained gains from here will bring that top forward to July 2017.
https://www.mql5.com/en/charts/6285482/spx500-d1-ig-group-limited?bind=1
Dotted verticals are short term SolarVLunar; solid are medium term; bold solid is longer term – all three timescales must be taken into account.
The horizontal dark green 38.2 and 23.6 Fibonacci lines are part of a sequence which has been developing since January 1995, started to become obvious Q2 2000, and was confirmed Q3 2007. It indicates a natural top for SP500 at 2650 (22930 for Dow).
Mark, doesn’t the market discount ahead of time.? If the market is to top in July then shouldn’t the smart money begin piling into gold 6 months ahead of time?
That wouldn’t surprise me, but I think its more likely that a stocks top and gold bottom will occur simultaneously – with July 2017 looking increasingly likely. We should have a clearer picture by late January 2017.
I summarised my solar cycle dates (when major moves would start) here during early March 2015 as follows:
SC1: late 2016/ early 2017
SC16: September 2015
SC12: July 2017
SC13: November 2017
SC7: February 2016
SC10: June 2017
On the run-up to September 2015 we discussed how it was unlikely to come to anything, because many other people anticipated a market crash then (for a variety of different reasons). February 2016 was significant, and now the three remaining dates are January, July and November 2017. These dates simply indicate that a major move will start; they don’t indicate the direction of the move – that is decided by other factors…
Mark continues to be quite the oracle as ISN makes a new sub-20 low for this cycle. Looking forward to hearing more as the year progresses. Happy 2017 everyone!
Thanks Mark, always nice to read your updates,maybe Mercury retograde starting on Monday will produce lower prices till year end.
For all the readers have a nice Christmas.
Gold – a very simple Solar-V-Lunar timing cycle (based on the difference between one lunar orbit and one-twelfth of a solar year) started to invert Q1 2013, but the large decline during Q2 2013 got it back in phase.
It did in fact fully invert Q4 2015, forming the major low at $1045.
Now it is attempting to invert again – if it does so, it will form another major low around late January 2017. If it doesn’t invert, then it should lead to a steep decline (similar to Q2 2013) from late January until July 2017:
https://www.mql5.com/en/charts/6297814/xauusd-w1-ig-group-limited
In either case, the decline should lead to…
… $820 by late January 2017 (less likely), or July 2017 (more likely).
https://www.mql5.com/en/charts/6297854/xauusd-w1-ig-group-limited
Where to after $820?
I think the price of gold will depend on whether the natural positivity between Minor and Major Lunar Standstill (2015 to 2024) can assert itself, or whether it will continue to be surpressed by the artificial things that are supposed to encourage it (QE and NIRP).
In other words, can the current high debt be rolled-up until the next banking crisis (1797, 1820, 1837, 1857, 1873, 1891, 1907, 1929…2007…2024)? Or will it have to be eradicated soon, as it should have been during 2008?
If the former, then gold could struggle to make significant gains until around 2024. If the latter, then a large spike could coincide with a large drop in stocks.
Nearly five years ago I mentioned a natural projection of gold going to $2275, but it could go much higher if there is a debt implosion and that implosion is tackled with ever more imaginary “money”.
And a longer cycle for gold averaging 21 months between major turning points – eg. May 2001, Feb 2003, Nov 2004, May 2006, Mar 2008, Dec 2009, Aug 2011, Jun 2013, Apr 2015… next up: Jan 2017.
I appreciate your contribution. Thanks for sharing.
This insight is very useful, Mark. Thanks and look forward to your take on where matters stand later this month.
Mark,
Gold is still going up in Jauari,do you see a large drop in stocks possible this month?
Thanks.
John.
Relative weakness in SP500 until 30 January yes, but I don’t think there’ll be a large drop John.
The big surge during early December and relative sideways motion since, have inverted my short-term solar-V-lunar cycle (assuming there’ll be no large gain between now and the end of January). So that indicates both short and medium-term cycles being positive during February.
January 2017 is one of the three most important of SC24, but I still think the other two will come into play – with US stocks now at the start of a final manic phase, with the top around July and a possible “second chance” scenario during November 2017.
Conference Board LEI turned flat in November with a new reading out during the next few days, so it will be interesting to see if that has turned downwards (although stocks could still continue upwards like 2006/7).
Bond spreads are showing no sign of trouble: https://fred.stlouisfed.org/series/BAMLH0A0HYM2
Jigs (who used to comment here) showed how breaches of some bond spread levels reliably anticipate major stock market moves.
Thanks Mark.
I have got the feeling that we are close near a top and we will see a signaficant correction in Februari.
But I could wrong..
Good luck
Mark,
While very few have mentioned this, I think it likely stocks top (assuming your manic phase call is correct) as a result of a significant and unexpected rise in interest rates, just as has happened in cycles past. In other words, a “normal” outcome now that it looks like we’re done with QE / NIRP policies.
Do you have any projection for rates using your methodology?
I haven’t looked closely at short-term turning points for interest rates Gary. I mentioned buying TMV during early July 2016 (expecting the yield on 30-year US bonds to rise), but I think there will be renewed bond buying when US stocks eventually sell off, so I’m not convinced that we’ve seen the final top of the bond bubble just yet.
I agree with the link you posted below about interest rates staying lower than expected for longer than expected – that is typically what they do after each lunar standstill financial/banking crisis. But this time the financial/banking crisis didn’t get rid of debt; in fact the opposite has happened, so rising interest rates are going to be more critical than previously.
Longer term cycles also suggest that rates should stay low:https://realinvestmentadvice.com/wp-content/uploads/2016/06/Interest-Rates-Long-Term-061816.png
So a significant rise in interest rates now or during the next several years would have an especially strong effect for those two reasons; ie. 1) it would be “unexpected” as you mention yourself, and 2) it would be acting on huge debts which should have been dealt with nearly ten years ago.
http://biiwii.com/wp/2017/01/20/high-amo-says-rates-should-stay-low/
A need to allow many more scripts than before appears. Some relate functionality most are for harvesting user persona data ( without asking of course). The development encroaches broadly and remains on a foundation of malignant secrecy that also serves to create risks for users. Remove regularly actioned legal liability and no business entity cares for basic honesty, professionalism or the best interests of the customer any more. But that be for generations of degeneration already. Will this pass muster or end up etherized as before?
Via private browsing in Firefox plus updates up to date then the Kapersky protection flags 15 attempts to collect private data and 3 attempts to fly a banner just so that this location can be accessed. I saw my original post when posting the above sob which was flagged as needing to be approved, but now it no longer appears so must have been sent off to a fleet of servers for disassembly and dissemination. Farewell young Yorick that I kept no original of.
Should I try again? Can my frust take the rating?
In case it be the links that cause the etherizing they will go in the next attempt.
Nope its a no go due to the links which cause the need for the moderation which blocks the entire futile effort. Tot siens yulle.
Mark, sure feels like we’re due for a respite here, no?
Defintutally feels like a respite is due, but it’s nearly always going to feel like that during a manic phase. This surge starting last week is exactly on schedule for a top late June/early July 2017 (one example is late October 1999 for the NASDAQ bubble).
Here’s a Daily chart of NASDAQ going nearly vertical 1998-2000; but it would have looked very unconvincing on a daily basis at the time (38% of those days were in the red): https://www.mql5.com/en/charts/6582627/nas100-d1-ig-group-limited
In the later stages, several of those red daily candles saw a range of around 5% of the total index value – corresponding to daily ranges of around 1000 points on the Dow now. So we’re likely to see volatility markedly picking up. And, as I’ve been saying for years, volatility is the one thing we can be sure of when the ISN finally drops close to zero – it didn’t happen in January, so we now can look forward to July and November 2017…
There is a huge barrier for the Dow coming up at 20620, so I’ll be interested to see if volatility increases soon as we approach it.
Thanks Mark,
Good prediction.
You are still on track so you are now suggesting we started the mania fase at the beginning of Februari and we can compare this with the Nasdaq end of Oktober 1999.
That Pary was all most 5 months (March 2000),So that would bring us to the end of June 2017?.
Yes NASDAQ is one of several examples of manic phases with similar timing (eg. gold, oil EURGBP, house prices, Nikkei etc).
I think the mania started with the double bottom of mid-January and mid-February 2016 (rather than 2017). That was when SP500 finally retested and broke free from the ISN peak (March/April 2014) of 1888. On 17 November 2015 I said:
“Recently I’ve pointed out – in simple black and white – that my probability for a stocks bubble is 90%, and that it could be 13-19 January 2016 before it really gets underway in earnest, and that there are two most likely times for it to peak (Q2 2016 and more likely Q1 2017).”
https://solarcycles.net/2015/11/15/approaching-resolution/
That was when the guard dogs here were barking at their loudest, and the fact that that dumb money is no longer fighting means that US stocks are starting to run out of steam. With the Dow reaching 20620 yesterday, I have sold out of some US stocks and indices bets – I’m now holding onto just three companies (Dow could reach 22900 by late June but its becoming increasingly risky).
Oke Mark thanks for the information.I also follow Mahendra Sharma he was calling for a top yesterday and now we will sell off for a few days after that we we will try to test the highs again in march but this will fail…..
So I m very curious … we are still in the moonwobble period till March 7.
I believe.. so correction is possible…
Yes, March should be important – it will also be interesting to see if geomagnetic disturbance levels can challenge the October 2016 high for SC24.
if US stocks indices can roughly hold their gains through next week, then my short term SolarVLunar timing will definately have inverted (dashed verticals on this chart) – so 01 to 30 March should be very bearish: https://www.mql5.com/en/charts/6603301/spx500-d1-ig-group-limited?bind=1
After that it will become critical; either an epic last bubble phase, or an epic fail.
I’ve only sold out of some US bets by the way – there are better places to invest. There’s far too much nationalistic rhetoric around at the moment, namely A) “you don’t bet against the USA”; and B) that silicon valley-led exponential technological growth will somehow save us all from everything.
Also, from a personal point of view, there is too much confusion there – eg. with people protesting against a temporary travel ban on seven muslim-majority countries while saying nothing about the 27161 bombs dropped during 2016 on seven muslim-majority countries. That’s a perverse sense of priority, so I’ll take my risks elsewhere!
Thanks, Mark. Do you post anywhere else or communicate in another fashion other than this site?
No I’ve never commented anywhere else Gary; but have been in email contact with a couple of other commenters here – not lately though.
Ok, how do I send you a PM? And well done.
That was when the guard dogs here were barking at their loudest – absolutely, And I’m thinking of one in particular…
I hope Mahendra is right and we will see a sell off till Feb 23,March could be the recovery.
And I agree there is to much brewing under the surface.
I think the big danger is Trump,a person with a grandiose narcissistic personality disorder …all he can is brag…. How can you tweet about the market before he was elected :”we are looking a a fat ugly Bubble in the stockmarket”.
And now he tweets:Stock” market hits new high with longest winning streak in decades. Great level of confidence and optimism – even before tax plan rollout!”
Nice weekend…
The cycle is an inversion,
I now predict a 19/23 Feb High and a March 7 low..
Mark, can you give me your thoughts do you still think there is room for higher prices till the end of this month or are we topping right here?
Mark, per your earlier comments, I’m guessing you believe March will be quite negative for the stock market?
https://www.washingtonpost.com/entertainment/books/where-did-steve-bannon-get-his-worldview-from-my-book/2017/02/24/16937f38-f84a-11e6-9845-576c69081518_story.html?utm_term=.15ec76b2c080
This is a good article that spells out why the market may not be all that expensive IF tax rates are lowered significantly.
http://seekingalpha.com/article/4031838-effects-tax-cuts-s-and-p-500-earnings?page=2
Mark,
Where will this end the moon first
can you give your view?
thanks John.
Gary/John – I don’t know what will happen of course, but with my short and medium term cycles both negative for US stocks from 01 to 29/30 March I would normally bet (spreadbets on option prices) that US indices will be lower at the end of the short cycle than at the start. I have done that again this time, but at a very modest bet size because they are still closely following my schedule for a top late June/early July (my targets for then are SP500=2650, Dow=22900, FTSE100=8000).
That schedule indicates modest gains and weakening momentum until mid-April, then a very volatile shake-off for a few weeks before a final vertical phase. But there’s still a significant chance of more serious and sustained weakness until mid-May, which would put the final top back to November 2017.
Still on track Mark for March,do you have a number where SP might bottom this month?
I saw this energy chart that is also right on track..bottom arround March 15/16…The Yellen put?
Good luck..
John.
I agree that this 15/16 March period will be very important.
If the US indices bounce then, we’re still on line for a bubble top during July 2017 (judging by the timing of previous bubbles). In that case SP500 could bounce near 2330, or possibly 2283.
But if they continue lower until 30 March that will increase the chances of a mid-May low. Also, the proportions of the rally from February 2016 (SP500=1806) to 01 March 2017 (SP500=2401) have the look of a naturally completed move: https://www.mql5.com/en/charts/6710263/spx500-d1-ig-group-limited?bind=1
So it will take a lot to sustain a move above 2401 anytime soon (like a mania or a Yellen put?). Otherwise we face a couple of months shaking off the Dow 30000-ers (a lot of them have appeared recently).
Mark,
I don’t know if you follow Mahendra,I do for many years and I like his longterm predictions..
here is his latest link:
Click to access 6-10_march_2017,_weekly_financial_letter,.pdf
Thanks for the link – very interesting. I’ve never subscribed to any of his services, but have heard of him before. He thinks the US indices have just topped, wheras I think Dow can each 22900 by July and top there.
I’ve been looking at longer term predictions lately too, especially in relation to SC12 – the closest one to SC24 by sunspot number, duration, pattern (two ISN peaks, second one higher), and both are the first weak cycle after a period of strong ones. That puts us now at the equivalent of Q3 1886. Also, that is now where we are in the lunar declination cycle, it being very rare that the two ever line up exactly.
I’ve mentioned before about a Bradley calculation and lunar declination both indicating a very positive period until c2026, but with a volatile negative spell between 2017 and 2020. But I don’t think the Bradley calculation is strong enough to be completely relied on on its own; and although stocks followed the lunar declination/ Gann timetable after 1886, the highs were not significant new highs. In fact, there were several drops of around 20% eventually leading to an overall decline of 50%.
So the market high for SC12 coincided with ISN reaching zero (October 1886), which I have been saying equates to July 2017. After that, by this comparison, we should expect several 20% bear phases until stocks lose 50% by 2024 (July 1893); then a retest of that low by 2028 (September 1896).
Interestingly, those 1893 and 1896 stocks bottoms coincided with the SC13 max and ISN breakdown respectively – that’s why I have maintained that the forthcoming SC24 ISN breakdown will not necessarily mark a high or a low – just a complete change in sentiment.
Thanks Mark,
I also believe that we will see an important top this summer.
For this month,I have a bottom March 7 (Mercury conjunct the Sun)after that up againn till Opex and down again before Opex.
Good luck.
Much obliged, Mark.
Thanks Mark, I think shortterm 15/16 march will likely be a top.That could be inline With M… max target SP500 /2406
The next Mercury retograde periode should be negative…
http://www.astrologyhoroscopereadings.com/2017-mercury-retrograde-calendar.html
Will see.
Mark, in terms of a possible crash, this is what I think causes it. From the FT/Goldman Sachs:
There are other snags, as far as the market is concerned. Mr. Trump has also proposed to do away with tax deductibility of net interest expenses, in return for allowing companies to expense all their capital expenditures up front, for tax purposes. If this happens, a critical question is whether current debt would be “grandfathered”. Assuming it would be, Goldman Sachs suggests that the reform would over time, “in addition to hampering earnings”, have the potential to alter “management preference from debt to equity”. That would in the long term reduce the corporate debt available to investors, and also stop the use of buybacks to boost earnings per share. In other words, these would directly hurt Wall Street to help Main Street.
So today an important top?
We should turn from here,Mahendra is getting pissed off.
His book price will double and he is certain that the markets are gonna crash this summer.
http://www.mahendraprophecy.com/latest-news.php?id=1120
What are your thoughts now Mark?
Until now my prediction was right,we should decline now til March 23/24
JH, I hope you are doing well on this first day of spring 2017. I enjoy your analysis and hope for a update soon.
14 February 2017: “There is a huge barrier for the Dow coming up at 20620”.
With a positive short term solar-V-lunar cycle until 29 April, but a negative medium term one in the meantime, we should see Dow (and other indices) continue to range around this level – but with sharp, failed moves in both directions.
There is a reasonably reliable relationship where oil leads stocks by half a lunar declination cycle. Oil, nine years ago: https://www.mql5.com/en/charts/6843437/usoil-d1-ig-group-limited?bind=1
Stocks are now at the $122 oil level from May/June 2008, as shown here…
https://www.mql5.com/en/charts/6843469/spx500-d1-ig-group-limited
Another leg up for SP500 to 2560 by July 2017. This target has moved downwards during the past year as SC24 activity continues to drag on until ISN eventually reaches zero…
So, Mark, if I understand you correctly, use any weakness to accumulate over the next 30-60 days for a final push into July?
Yes I’ll be betting on the sort of price levels I’ve been mentioning Gary, but not by buying shares – that will be too risky if a final surge doesn’t happen (perhaps a 10% chance of that).
I’ll be looking to add more spreadbets on call option prices – over the past year these have been more-or-less free to buy when the indices dip.
Has the unemployment rate amongst US married men been forming a bottom since February 2016?: https://fred.stlouisfed.org/series/LNS14000150
It gives a several-month leading indication of the general unemployment rate, which so far has bottomed November 2016.
During SC23, 22, 21 and 20 the general US unemployment rate bottomed 2-9 months before the real solar max (SSN). In a weak cycle like SC24 the real solar max is the ISN breakdown – arguably December 2016 or March 2017, or more likely I think July 2017.
That implies that general US unemployment has recently bottomed; and so if the married men rate has bottomed then we should see the US in recession by Q1 2018 at the latest.
Thanks Mark,
According our famous astroman we are now entering a bad period for stocks into May before the final bubble up.
This weekend we also have mercury retograde the surprise planet..
Do you think a decline is possible into May?
Thanks
John.
Possible yes. I previously mentioned that my timing from 1 to 30 March was negative, but that I reduced my bet size on that because mid-March was also a typical time for a surge upwards (based on previous manias). The next such typical time will be early May. Then my timing cycles both turn positive mid-May.
I used to assume that trading a manic phase would be a simple matter of watching ever higher prices each day – its only during the last few years I noticed that around 38% of days are in the red, with the huge price increases confined to occasional and apparently unexpected short term periods.
A couple of months ago I noticed an increasing number of references to “Dow 30000”, but it has only taken one month of modest declines to largely silence them – another reason to think that higher prices will be needed to draw in all the remaining buyers.
You mention Mercury; Venus has also been passing between us and the sun, with close Venus-Earth-Jupiter alignment causing the recent surge in sunspot numbers. You’ve probably seen the following chart referred to many times over the years on John Hampson’s site: https://solarcycles.net/portfolio/10-solar-charts/#jp-carousel-9635
Those three spikes in VEJ alignment on the right hand side correspond to Q3 2012, mid-2014 and Q4 2016 so sunspot numbers will defintutilly continue to fade away now.
Mark continues to be the most accurate forecaster. Hats off!
https://www.seeitmarket.com/margin-debt-all-time-highs-watch-signal-instead-16756/#.WOvW-ivAjU8.twitter
“…the world is forecast to be moving into another grand solar minimum, which also historically resulted in low/negative growth and war…” (John Hampson, above).
“…sustained and significant global cooling starting sometime in the period 2017 to 2022.”
https://tallbloke.wordpress.com/2017/04/10/a-swelling-volume-of-scientific-papers-now-forecasting-global-cooling-in-the-coming-decades/#more-31683
Big week coming up – French elections and rollout of the tax reform plan in the U.S.
From a colleague: My indicators continue to suggest that the current consolidation period in the equity and high-yield bond markets will resolve in a positive outcome, resulting in another leg up in the ongoing much-maligned bull market. Despite the bull market’s 8-year life span, and notwithstanding temporary bursts of bullish enthusiasm, investor sentiment has been unable to embrace the sustainability of this bull market. The negative bias in the mainstream media continues to feed the “Wall of Worry” mentality that has helped to fuel this market upward. Indicators that reflect the underlying technical health of the market based on Advance/Decline and New Highs/Lows data do not exhibit the kind of early warning signs of broad market weakness that typically precede the topping of the popular cap-weighted indices, such as the Dow Industrials and S&P 500.
Also coming up this week: more geomagnetic storming caused by this big coronal hole (previously geoeffective late March): http://www.solen.info/solar/images/AR_CH_20170422_hres.png
Mark, I thought if the earth heats up it increases the incidence of war among nations, but apparently it’s just the opposite?
I’ve never looked in detail at war cycles myself, but the prevailing wisdom seems to be that “… nations crumble on the shift from warm to cold. International wars occur mostly during warm periods, civil wars during cold ones…democracy is revived during cold times”:
http://time-price-research-astrofin.blogspot.ie/2015/06/raymond-h-wheelers-100-year-cycle-of.html
Also “We are headed for various breakdowns of economic, social, political and international regimes. This period will stretch into the mid 2020s and will be followed by an overall social and economic recovery…”.
I’ve mentioned this 2024-7 period several times before – it ought to be very positive from now until then (solar cycles, lunar declination and long-term planetary aspects on the position of the sun relative to the barycentre), but the source of that economic positivity (the birth of a new credit cycle following the widespread defaults and banking crisis at the death of the previous cycle) has been taken away by QE etc.
We could well see a 7-9 year period of confusing tug-of-war in the markets, with deflation in some areas (like debt) and inflation in others (like taxes and services prices). I wonder if people will maintain their faith in government currencies during this period?
Gary – in the Margin Debt “acceleration” graph you linked to above, do you know exactly how the “YoY%” measurement is calculated? It seems to be simply the current month compared to the corresponding month one full year before – ie. without taking any of the intervening months into account – so its interesting that its timing has been so precise.
Measured like that, the 2007 peak acceleration was 65% (in July, so there was a few months warning of the eventual market high). In 2000 the peak acceleration was in March at 78%, so little warning then.
Also, the release of margin debt figures is delayed by around three weeks, to give insiders a chance to act on them. But this acceleration/deceleration will definatulily be worth keeping an eye on this year…
The latest March 2017 acceleration is 20%, same as the previous month, so no acceleration/deceleration and therefore no indication of a top yet:
http://www.nyxdata.com/nysedata/asp/factbook/viewer_edition.asp?mode=table&key=3153&category=8
Mark, sorry I don’t.
Turning to markets, some individual stocks I follow as possible tells are the credit card companies (V, MA, COF, and DFS) and the Dow Jones Transports. While the top tier card companies Visa and MasterCard are acting well, the same can’t be said for Capital One And Discover Financial Services. In addition, the Transports have slipped back below their 50DMA, a possible warning sign as it constitutes for now a significant divergence from other indices.
From a UBS broker friend: 10 stocks in the S&P 500 have accounted for all of its gains over the past two months. The other 490 have basically been flat.
Gary, COF/DFS/Transports/very narrow breadth – pointing towards a dwindling appetite for credit and an increasingly exhausted stock market?
The lack of breadth is similar to 1999, but NASDAQ continued higher for more than a year before it finally turned the market over.
I still believe SP500 can reach 2555 by July 2017 (see the chart I published above on 4 April), but the less likely alternative that it has already topped cannot be discounted (see 9 March chart above).
The 4 April chart shows my short cycle as negative until 28 May, but the medium one going positive on 18 May. To complicate matters, the thin dark blue and light blue lines in early May each mark the start of a very bullish phase (derived from previous bubbles).
So I’m expecting nervousness early May to be taken over by strong bullish moves by the end of the month.
Thanks, Mark. The market is anticipating a Macron win and European bourses are at new highs. Agree with your point about the market being able to move higher even as breadth narrows. But the biggest positive in my view are the credit markets. Spreads continue to be tight, there’s no worries in CDX indices, and money continues to pour in from corporations, both in direct buy backs and pension plan contributions.
“However, the kind of deflationary depression or long period of negligible growth predicted by demographics that may first come to pass historically gave rise to unrest and war” (John Hampson, above);
http://time-price-research-astrofin.blogspot.ie/2017/05/a-demographic-theory-of-war-gunnar.html
This EWT forecaster has been pretty good over time. Mark, his ultimate target is similar to yours on the upside, he just sees a correction first before a final move up (which would mark the top): http://www.marketwatch.com/story/a-stock-market-decline-may-be-around-the-corner-according-to-elliott-wave-analysis-2017-05-10
Levels are very similar. Although the timing appears different to my favoured July top, it is not far away from my final timeline for SC24 speculation – November 2017.
If my wee solar-V-luar timing cycle inverts and we see stocks dip into the summer, then that would set up a final opportunity for an ultimate top late this year (possibly extending into very early 2018).
Ok. From a DeMark point of view on a ST basis 2383.89 is an important line of support. Mark, at what point (price level or solar-v-lunar timing cycle) do you say the buy mania you are looking for has been postponed? In other words, assuming you’re long here, do you put in a stop loss according to price or to time?
My medium term cycle turns from negative to positive tomorrow, and my short term one from negative to positive on 28 May. So given that they’ve both been negative, I would regard any current market declines as “catching down” and part of the nervousness I was expecting for early May.
Declines during after 28 May would mean that the short term one is inverting – but I’m not expecting that to happen. My SP500 levels for the rally since January 2016 are 1833, 1987, 2108, 2193, 2278, 2384, 2555. A sharp drop to around 2278 before 28 May would not be surprising. By the way, the 261.8% Fibonacci backwards on this sequence is 666, so the rally since early 2016 is in the same proportion to the full rally since March 2009.
I personally wouldn’t use stop loss orders for anything other than quick intraday trades – the market’s function is to match buyers with sellers, so an order to sell below the current market price (ie. a stop loss) is going to find a buyer. I used to place stop losses where the experts said I should – “a few pips below the previous low” – only to repeatedly watch the market go down and take it out, then rally strongly back upwards. It took me a while to realise that it is the popularity of stop losses at those levels which actually moves markets!
Last news from the astrologer : major volatility starting in the middle of this month and lasting till 2e week of July after that run for the hills.
Buy every big dip and sell the bounces..
This prediction is made end of 2016.
Good luck
“…sell the bounces”. So no new higher highs?
SP500 has finished the week within one point of 2284, so this sequence with its high at 2555 continues to be very strong. If it cannot be reached this year (Dow equivalent is 22128) then it will have to be reached later – that suggests stocks moving higher after a severe correction probably into early 2018.
And that, in turn, suggests that markets will follow their natural inclination to go higher into the next major standstill (2024-6) driven by a credit boom. A renewed credit boom in the west seems unlikely to me, unless we see a spectacular debt implosion soon.
But apparently only about half the world’s population have a bank account. The banks will not have to go through the process of building new branches for them – the infrastructure is already there for anyone with a smartphone, and those are increasing very rapidly.
New bank accounts for half the world’s population (which also happens to be half with more positive demographics) would give them to opportunity to borrow.
I still think the late 1800s/SC12/13 scenario is more likely – stock markets making a higher high soon, and then years of failed attempts to go higher with several drops of 20%, eventually losing around 50%
Hey mark,
His top target for SP500 is 2406 maximum and he said that this level will hold but for now we will see a market with big falls and bounces till second week of July after that the market can drop non stop 15 or 23 %..
So let’s see
I bought call options and will sell them by monday if we reach 2400 again.
My best guess is up till May 22/25 after that we will drop till end of the month and bounce again.
Let’s see what will happen.
John.
.
My comment about 2383.98 being important was, while accurate, for short-term (hourly) traders only so not particularly useful for medium term trading. From a DeMark daily perspective there is risk in the S&P 500 down to 2280.85, very close to Mark’s 2278 level. That said IWM is right at important support (in DeMark terms), as are the Transports in traditional 200 day moving average terms. Since the Transports and to a lesser degree the Russell 2000 have been the laggards I’m watching them closely for clues as to the depth of this correction.
Well, the Transports and IWM have bounced strongly and the correction was very short-lived. That said, from a DeMark POV the equity market is due to stall here at the very least. Mark, it seems all systems go with the market about to embark on the mania phase you’ve been calling for (quite correctly, I might add.) I assume nothing has changed in your prognosis?
This is the latest free post from Mahendra,the market went higher so that was wrong.
but i think there is a good chance we will see a correction after July 8.
But from what level 2500 or 2600?
Click to access 29_-_2_june_2017,_weekly_financial_letter……pdf
So far you are spot on Mark keep posting what your thoughts are?
Best regards and good trading John.
A very important period coming up between now and 27 June. If SP500 is not convincingly above 2415 by that date, then my short term solar-v-lunar cycle will have inverted, and that will (somewhat ironically) indicate a very bullish period until 26 July.
But my separate bubble pattern indicates an ultimate high around the first week of July (blue vertical line on the SP500 chart above dated 4 April). So I would estimate the top most likely between 6 and 26 July, with the exact date depending on what US stocks do over the next two weeks.
Meanwhile, gold is also at an interesting juncture – threatening to break out of its bear market trendline, with a bullish cycle due to start on 4 July: https://www.mql5.com/en/charts/7211898/xauusd-w1-ig-group-limited?bind=1
Thanks for this, Mark. Do you pay any attention to the Bradley Siderograph turn dates? There’s a cluster coming up:
June 21 (100/100 Bradley Siderograph Power)
June 30 (100/100 Declinations Power)
July 4 (100/100 Middle Terms Power)
I do – I think they’re reliable indicators of changes in sentiment, within a timescale of a few weeks. With the major Bradley turns being calculated mainly by the angles between the outer planets, I personally don’t pay too much attention to the exact dates. Here’s another calculation showing two equal major turns on 22 June and 07 August: http://time-price-research-astrofin.blogspot.ie/search/label/Bradley%20Index
As I understand it, the scaling to 100 in your dates means that they are the most prominent of the year (?). It is also useful to compare the relative strength of each year’s most prominent Bradley to previous and subsequent years – I’ve previously posted here about 1931 and 2010 being the weakest Bradley values, and 1995 the strongest (so far: 2027 will be higher); so the weaker the Bradley value, the weaker the market and vice-versa. There are many other examples, these are just the extreme ones.
The June 2017 Bradley value is very high, then downhill to a weak value on 02 December 2020.
Putting a simple integer value on each year for comparison I get:
2015=5
2016=5
2017=10
2018=8
2019=2
2020=minus 3 (mid year)
2020=minus 16 (December)
See also John Hampson’s comment above about the next solar max around 2020. There is also a close correlation with lunar declination (Gann’s Financial Timetable). The last time lunar declination and solar cycle matched like this was the late 1880s into 1890s.
So I don’t expect a historic crash soon, until possibly late 2020 – more likely we’ll see several multi-month declines of 20/30% with bounces during the next three years…
Would we get new highs between now and 2020, even if the historic crash is absent? I am just trying to picture the path with multiple -20% to -30% declines in my mind.
I don’t think so – not for the current “leading” markets like the US.
The similarities between SC24 and SC12 continue (we’ve been discussing that for several years here). If that continues through SC25 then we should see a complete inversion in solar-induced speculative behaviour – that’s what happened under SC13 (stocks BOTTOMED at both SSN peak and ISN breakdown).
Other similarities to the 1873-1895 period are collapsing bond yields, deflation and low interest rates; which led to social upheaval and “populist” parties. These came to an end – eventually – due to rising money supply (gold was money in them there days) and protectionism.
I think there is more chance of new highs by late 2020 (and even more likely after 2024/5) in countries which concentrate their efforts on commerce (rather than protesting against the results of democratic elections etc).
Wow Mark…that is very insightful. Happy Solstice.
Mark, I really appreciate your comments. They certainly are food for thought. Your most recent post mentions: “Other similarities to the 1873-1895 period are collapsing bond yields, deflation and low interest rates; which led to social upheaval and “populist” parties.” However, previous posts of yours have pointed to the wild card of the financial crisis of 2008 being short-circuited by QE, Under current conditions, I think it extremely unlikely that Central Banks would permit collapsing bond yields and deflation. More likely they would begin a panic phase of helicopter money in a possibly vain attempt to maintain stability. Could this jump start the final manic stock accent to higher targets or instead trigger a world-wide financial collapse?
Thanks. I would say that we’ve already seen collapsing bond yields and [debt] deflation; and are closer to the end of that period than the beginning. Solar-wise, we are at H2 1886.
So I’m not convinced we’ll necessarily see much more QE/helicopter money – Central Banks would not survive hyperinflating away their own currencies.
Forgot to say that even though the Central Banks might not want to risk hyperinflation, that does not guarantee that the public will not lose faith in their currencies anyway.
Thanks Mark,
You are still on track, Mahendra is bearish on the market after July 8.
with 2 dark periods after august 15 and Okt 2017.
Click to access 5_-_9_june_2017,_weekly_financial_letter……pdf
good luck…
I can’t get the link to work
Hi John,
Click to access 5_-_9_june_2017,_weekly_financial_letter……pdf
Did you try to copy the link in google that should work?
I thought Mahendra turned bearish a month ago. Did he change his mind?
No this is still a buy the dip till july 8..
Thanks. I confess I didn’t read Mahendra’s brief and only inferred his bearishness from the brief comments here.
Thank you Mark. Your insights are greatly appreciated. FWIW, another timer with a good track record is projecting a Flash Crash sometime between now and the end of July.
“If SP500 is not convincingly above 2415 by [27 June], then my short term solar-v-lunar cycle will have inverted, and that will (somewhat ironically) indicate a very bullish period until 26 July” (above).
In term of these cycles, 2420 is not convincingly above 2415, but neither is it a convincing inversion. So that looks indecisive; but assuming it has inverted then we should see a very positive phase until 26 July (the medium term cycle is also positive until 07 August).
My separate bubble pattern (since early 2016) ends next week, but could easily be out by a couple of weeks either way. A problem with it is that there hasn’t really been a true bubble in SP500, which is one reason why I’m not expecting a 1987-style collapse.
And looking at popular websites, everyone is talking about the “coming collapse”. There’s no sign of any stocks mania in ETF fund flows either (some money out, some in) – interesting though, that there’s little interest in anything else other than stocks and some bonds: http://www.etf.com/etfanalytics/etf-fund-flows-tool
Also, ISN for June is not going to break down significantly below 20 (it has been trying to do so since June 2016 while stocks have been climbing).
I have been eyeing July 26th myself. I am not sure if you care, but it is also the next FOMC announcement day!
Mark, do you still think july is going to be very positive after this pull back?
thanks
John.
I would only expect significantly higher prices by 26 July if the period up to 27 June inverted – but I can’t be sure that it did (ie. because SP500 was not convincingly above the 28 May value of 2415 on 27 June, but wasn’t below it either).
A pullback doesn’t matter to these cycles; it is the price at the end compared to the start that matters.
My long-standing expectation has been for a stocks top late June or July 2017 (but November 2017 remains a lingering possibility), but these cycles are not currently helping to narrow that down to a day or even a week.
Wall Street analysts are very bearish for the rest of the year (by their standards – they’re still expecting a 0.6% increase): http://www.zerohedge.com/news/2017-07-01/wall-street-strategists-forecast-most-bearish-second-half-1999
Overall, I still think we’ll see another new high during July…
Thanks Mark.
http://time-price-research-astrofin.blogspot.ie/2017/07/presidential-seasonal-decennial-and_19.html
Mark, we are still not seeing weakness in the advance-decline lines (cumulative) for both the NYSE and Nasdaq, a bit surprising if the market is nearing a peak. Option-adjusted spreads in lower rated bonds continue to be near lows, again usually a leading indicator of stock market weakness. Unemployment rates are at lows, and still haven’t begun to tick up. Margin balances might be rolling over, though it’s too soon to say.
On the other hand, C&I loan growth is slowing, as is the ECRI leading index growth rate.
All in all, I’m looking for negative divergences and don’t see many. The most anyone can point to is the recent breakdown in the QQQ and Nasdaq Composite. Historically, do your studies we should expect to see these types of divergences prior to stock market peaks?
Agreed re. the lack of negative divergences. One exception is the MACD Histogram (the only technical indicator I use) – it has been diverging since late 2016, and then especially since February 2017.
There has not (yet) been the mania I expected in leading stock markets. SP500 is up 268% in the last eight years, compared to 484% in 1920s Dow, 733% in Nasdaq 2000, 433% in Nikkei over similar timeframes. Even if we see significantly higher prices during the next 3/4 weeks, I think there will then be a painful rolling over during the summer (rather than a historic crash), which would give more divergences the time to develop.
Many people are calling for the “coming crash”, and I see comments today that short bets on the Faangs have increased dramatically over the past six weeks. So another surge upwards should also get rid of many of these.
(1) Grain prices have surged recently, as they usually do at each solar minimum – (2) ISN has dropped close to zero during July so far (early days), and (3) cosmic rays have reached typical solar min levels already: http://cr0.izmiran.rssi.ru/mosc/main.htm
Each of these three things indicate that my long awaited ISN dropoff might have arrived (if sunspots remain scarce for the next three weeks), marking the end of SC24-induced speculation in the stock market.
Mark, I can’t recall if I’ve ever posed the question of whether investing in commodities can be timed using your methodology, but take a look at this. From a strategic point of view it certainly looks like the time is propitious to allocate out of financial assets and into real ones (you mentioned your work says it’s time to buy gold):
http://www.marketwatch.com/story/if-this-ominous-pattern-holds-it-may-be-time-to-bail-stocks-and-load-up-on-commodities-2017-07-06
I am inclined to agree with both of you. The returns are very mediocre, and other markets/indices such as Hang Seng or Biotechs are way below all time highs.
In addition,
(i) The VIX is extremely low vs previous bubble peaks (if this is a bubble peak at all). There is hardly any excitement to lever up with options.
(ii) Option skew is relatively high vs previous bubble peaks — despite low VIX, more investors are concerned with downside protection rather than upside speculation. The fuel for short covering still exist.
(iii) SPY volume is low and declining since 2015, reinforcing a boring market, rather than a parabolic frenzy.
I have lost faith in ISN. They are so close to zero that it seems that we are reading tea leaves or random noise. I would be really happy if JH would slap some sense into me, but from how I see it, ISN high was 146 and we hit 18 on 12/2016. That is a fraction of a fraction of the ISN peak. Whatever should have happened has already happened, and perhaps it did in China’s stock market way off the 2015 highs. I am not saying no crash is possible. We crashed in 2008 and that was a ISN min, not max. I am just saying that it is meaningless to draw any conclusion from ISN.
Do cosmic rays affect grain yields? I am reading on CNN that they are trying to build a Mars station, but inflatables are made from polymers which are not good due to higher cosmic rays on Mars. It is better for them to use minerals native to the planet.
This can be interesting :
Andy Pancholi FREE video – “Week Ending 14th July 2017”
http://tinyurl.com/td9tjaj
http://www.marketoracle.co.uk/Article59234.html
good luck..
Found this interesting – from Tom McClellan:
In the chart above, the plot of the CPI-U Inflation rate is shifted forward by 2 years (24 months) to reveal how the U.S. unemployment rate follows in the same footsteps. That is important because the inflation rate bottomed in early 2015, and so the echo of that bottom is coming due right now for the unemployment rate.
This is not a perfect relationship, though. Sometimes exogenous events put a thumb on the scale. We saw that especially in 2008, when the commodities bubble sent the inflation rate up to an unnatural high, which was followed by a crash of equal magnitude to the downside. Two years later, the unemployment rate did not exactly match those dance steps. But after a few months, the relationship got back into step again.
The CPI-U inflation rate rose from the low in April 2015 to its high in February 2017. Add two years to those dates, and we get a low for unemployment due in roughly May 2017 and a high in February 2019.
ISN -inflation – market tops and bottoms
There is still some way to go for ISN to drop off completely: http://www.sidc.be/silso/monthlyssnplot
This month ISN got off to a slow start but has picked up already. It has dropped down to below 10 in every solar cycle so far (since SC1). After reaching zero in late 1886 it bounced around (mostly below 20) for 3.5 years, which is equivalent to late 2020. As JH says above, these solar minimum periods are associated with panics etc.
Previous ISN dropoff years were 1933, 1944, 1953, 1965, 1976, 1985, 1996 and 2007. The years 1965, 1976 and 2007 were particularly bad times to buy stocks. The others were particularly good times to buy. It seems to me that those bad years are associated with the onset of increased inflation or deflation, and that inflationary pressures have recently been building (because of apprehension about the value of money as well as traditional cost or wage pressures).
G1-G2 (Minor-Moderate) geomagnetic storms are likely on July 16th due to the anticipated arrival of a CME from July 14th.
Interesting to see a sunspot still producing flares and CMEs at the onset of the solar minimum – these are the short-term events normally associated with the solar maximum and hightened speculation.
Does anyone have a view on the solar eclipse 8/21/2017?
Last year I remarked on the symbolism of this eclipse dividing the US in two, especially at Jackson Hole just a few days before the Fed has it symposium there.
But it turns out there is more than symbolism, with more than a thousand minor earthquakes under the eclipse path at Yellowstone – a major earthquake and eruption there would be one for the history books.
There is a definiiite relationship between solar eclipses and earthquakes, but it seems the timing is not straightforward: https://exemplore.com/astrology/Profiling-the-Total-Solar-Eclipse-of-August
Mark, it does seem as though a mania is about to set in in markets. We are at the point where even professional investors are questioning what is going to cause markets to reverse because every slight set back has been met with buying. At some point, bears are forced to capitulate buy in a market where there are no sellers. A parabolic move up may be right ahead…
I’ve been waiting for July 2017 for a long time, and with SP500 and Dow getting close to the last target levels I mentioned above we could be very close to a major top.
I still don’t think that US stocks will see a major crash; more likely persistent periods of steady declines and intermittent bounces. Gold should benefit, but in a tentative way until early 2018 – I still don’t rule out a quick, sharp decline to $880 (but I’ve been wrong about gold so far this year).
I am not basing this on anything solar anymore, it does seem to me that markets are still breaking up for another month or two before the peak for 2017 is set.
Perhaps coincidence, perhaps serendipity (relative to Mark’s call of a top in the July 27th timeframe): in John Hussman’s latest post he frames market action from the perspective of Didier Sornett’s log-periodic power law bubbles. According to John, “….the estimate that best fits recent market dynamics would place the critical point in the first week of August, within less than 2% of current levels. Indeed, the 30-day crash probability that we estimate from this particular model is rising vertically, and will continue to do so with every market advance from this point. In practice, based on a much broader set of historically reliable evidence, we already view the market as highly vulnerable to steep, abrupt losses.”
Hi Mark, still on track, What is more important in your systeem time (july 26) or target SP 2550?
I have a possible turndate on July 23.
Good luck.
John.
I reach my time and price estimates separately, so I can’t say that one is more important than the other. Dow has already been within 15 points of the last estimate I gave for its top. The 2550 SP500 estimate could arguably be closer to 2525.
I’m not going to doggedly hang on for every last point, and especially not significantly beyond 7 August.
Thanks Mark.
Hi Mark, the date 7/27 has been singled out as a likely turning point. Knowing it’s almost impossible for any system to pinpoint to the day a turning point in the market, what in your opinion are the odds your system calls this date accurately? I know full well that if the market turns anytime around this date, give or take a few weeks, it would still be a remarkable call.
The little wobble in SP500 and Nasdaq today confirms that there is still some validity to my solar-V-lunar timing, but the Dow did the opposite. This strengthens my view that this top (if indeed it is one) will be messy process and difficult to trade – I still don’t expect a single decisive reversal day in all markets with a large crash immediately after.
Dow has now reached my lower target, but SP500 hasn’t.
A quick scroll down the headlines at popular sites like ZeroHedge shows that most are still expecting “crash now or crash soon”.
Absolutely ideal, for me, would be a spike up to around 22100 (Dow) and 2550 (SP500) by 7 August.
http://www.zerohedge.com/news/2017-07-01/us-government-prepares-space-weather-event-nasa-warns-solar-minimum-coming
They are confusing the solar minimum (sunspot minimum with 11.1 year average recurrence) with grand solar minimum periods (several successive weak solar cycles).
There were two solar-induced geomagnetic disturbances, in 774AD and 993AD, which were between 10 and 20 times stronger than the Carrington Event: http://joannenova.com.au/2015/10/extreme-solar-storms-hit-earth-in-774-and-993ad-what-would-happen-if-one-hit-now/
With about 150 years expected between Carrington-type events, it seems that we should be expect one soon.
http://www.mcoscillator.com/learning_center/weekly_chart/why_are_bond_yields_staying_low/
http://www.cnbc.com/2017/07/27/jpmorgan-quant-drops-the-whole-market-with-report-comparing-to-1987.html
I thought this article was interesting.
http://www.marketwatch.com/story/what-the-solar-eclipse-on-aug-21-will-mean-for-stocks-2017-07-25?siteid=rss&rss=1
From Robert Prechter’s EWT on July 27th at 2:30 p.m.: This morning the DJIA appears to have ended five waves up from April 19th. This should prove to be the top of at least Minor wave 3. The Dow may have also completed Minor wave 5 and therefore the entire bull market.
https://www.seeitmarket.com/nyse-margin-debt-peaks-now-rolling-over-investing-17149/
Mark, if the correction is indeed upon us, do you have price targets for how low the indices might fall?
I think we are now entering a roughly three year period where it will be much more difficult to set targets, especially in the longer term. In the meantime 2445 might provide some temporary and tentative support for SP500 (almost there already). More support near 2423, then 2275, with a bottom for this bearish phase at or just below 2000 (although 1740 could be an outside possibility).
Time-wise, I would anticipate a bounce between 25 August and 23 September, and I wouldn’t be surprised if SP500 exceeds 2500 before larger drops until 23-27 October. One problem with that scenario (a major decline during October) is that there is already some publicity about October crashes in years ending with 7 – if that causes an inversion, then we might see some sort of mini crash during the 27 October to 11 November period.
November will still be an important month solar-wise, even if August sees a significant ISN dropoff. And there’s a planetary configuration then which nearly always coincides with major market declines.
Interesting. I pay close attention to J.P. Morgan’s quant strategist, Marko Kolanevic, who has a firm grasp on market participations’ positioning, particularly as it relates to strategies such as selling the VIX, risk parity, and the like. He thinks we’re in a higher vol regime but the real fireworks might not happen until September when three CBs outline their balance sheet plans.
https://www.cnbc.com/2017/08/10/jpmorgan-quant-who-called-volatility-spike-says-expect-more-of-the-same-in-september.html
There have been many historical “analogs” over the past few years which have failed once they received public attention, but this one nevertheless caught my attention because of similarities with lunar/solar/planetary (Bradley) timescales and patterns: http://www.zerohedge.com/sites/default/files/images/user3303/imageroot/2017/08/14/20170814_WTF.png
Difficulty for US stocks until 2020, and then a release of natural exuberance until the next Major Standstill. If this is to happen, then the world’s debt problems will have to be resolved somehow over the next three years or so…
Growth in margin debt occurs when investors pledge securities to obtain loans from their brokerage firm. The New York Stock Exchange releases margin debt data on a monthly basis. It’s important to avoid looking at the nominal amount of margin debt outstanding, as any credit-based indicator will steadily grow over time with the economy. Instead, I like to look at the yearly change in margin debt.
Articles: A Look at NYSE Margin Debt by Short, Margin Debt and Market Cycles by Felder
Filter Rule: If the yearly percentage change in margin debt is negative, be out of the market
Notes: Margin debt data is lagged to reflect the NYSE release delay
Current Reading: +20.5% YoY
Data Source: NYSE
You flagged this up a few months ago Gary, and its now very useful to see it graphically – it makes the lack of speculative excess and confidence now compared to 2000 and 2007 more obvious.
The big step up in Margin Debt from June to July 2016 means July 2017 will have to be very good just to maintain that 20.5% YoY. But July was a great month for US stocks. Perhaps September 2017 will be more critical because of the big step up into September 2016 – we could easily get a negative YoY % then.
http://www.nyxdata.com/nysedata/asp/factbook/viewer_edition.asp?mode=table&key=3153&category=8
Worthwhile summary – don’t think we’re there yet.
https://www.bloomberg.com/news/articles/2017-08-22/wall-street-banks-warn-winter-is-coming-as-business-cycle-peaks
As we continue to refer to JH’s post from 1/2016, I think it is fair to say that this time is different. We might crash eventually, but the dynamics are not what we expected. (Or at least everyone except Mark, who continues to be the grand wizard.)
I found this chart which shows that we have more spotless periods in SC24 unlike SC16-SC23. Could this be why animal spirits have changed given JH’s calibration to SC16-SC23?
I would say the answer to your question is defintutilly yes. I’ve been prattling on here for several years that we should be looking at the more naturally similar period during the 1800s – back beyond the human lifetime of SC16-SC23.
An important day today, I think. Should be the start of 29.5 days short term positivity within a medium term bearish period, but I think it might invert and cause severe weakness which could continue until 23-27 October…
Hi Mark, is this 29.5 days based on a lunar cycle? It seems like the solar cycle cannot possibly be that precise! Thanks!
Yes, its just based on the lunar synodic month (ie the interaction of sun and moon from where we see it), but not exactly in phase with new and full moons. It is the short term cycle in the Solar V Lunar timing model I’ve mentioned many times (the medium term cycle in that timing is shown in the gold chart I showed above: https://www.mql5.com/en/charts/7211898/xauusd-w1-ig-group-limited?bind=1
Back around November 2015 I mentioned that mid-January 2016 would be an excellent time to buy more stocks, and gave an 80% (and later 90%) probability that the rally would continue until late July 2017, with a smaller probability of November 2017. I gave two specific dates for the end of the rally, 26 July and 07 August 2017.
But now we’re past those dates, I don’t have anywhere near the same level of confidence in what will happen next – everything seems very mixed to me now. The rally could possibly continue until November, especially with ISN bouncing back above 20 this month (but then again it could drop away next month rather than wait until November). There are many obvious reasons to sell US stocks now; but also some showing that the rally should continue… Gary has already pointed some of the less obvious ones out above.
So at the moment I would only marginally prefer a stocks bottom in early November 2017 rather than a top, within a period of general nervousness lasting until late 2020, then a very positive phase until 2024/5/6.
Thanks Mark. The sun is heating up again, and so are some dangerous hurricanes. It feels like the solar maximum is not ready to give way to the minimum just yet.
Not much sign of trouble here, yet: https://www.southbankresearch.com/wp-content/uploads/sites/9/2017/08/CTC230817.png
But there wasn’t in October 1987 either!
Gary – in the margin debt chart you posted on 17 August, has the YoY % Chg just turned down from a perfect descending trendline connecting 2007 – 2013/4 – 2017?
Mark, I didn’t create the chart but in going to the site where I access it, I’m almost certain it does not include the most recent margin debt data from the NYSE, i.e., July’s data. Once it does, then I can answer your question. By the same token, here is the raw data from the NYSE that does include July :
http://www.nyxdata.com/nysedata/asp/factbook/viewer_edition.asp?mode=table&key=3153&category=8
Yes, it seems to show up to June’s 20% YoY. So with July now at 16% YoY, it looks like it has turned down perfectly at a descending trendline (I am simply using a ruler against the green YoY indicator on your chart). I suspect that September’s figure will be close to 0% YoY, but we will not know that until near Halloween.
The more the US indices can sustain their rally towards 23 September, the more I think that will finally mark the end of this bull market. But I would like to see estimated ISN dropping away significantly below 20 by then…
September seasonality: http://jayonthemarkets.com/2017/08/31/september-good-then-bad-then-ugly/
My view of the SP500 chart: https://www.mql5.com/en/charts/7563572/spx500-d1-ig-group-limited?bind=1
Testing the underside of an ascending wedge with bearish MACD Histogram divergence (even more so on weekly); and a very negative period coming up for a month after 23 September.
But – it has not reached my anticipated natural high between 2525 and 2550; and there is a bubble pattern which does not complete until after November (start and finish in light blue verticals, in-between pattern not shown); and there is still a lot of negative sentiment around.
SP500 around 2525 by 23 September should finish this bull market; failure to break the 7/8 August high should mean a short term shorting opportunity, with a subsequent rally above 2500 by the end of the year.
Thanks for this, Mark. I always like to step back and think about these price targets in the context of risk/reward and asymmetric bets. In the case of a S&P 500 moving to 2525 from here vs a move to say, 2,300, we’re talking about a 50/175 reward to risk tradeoff, yes? Not to mention if the bull market is entirely over, perhaps lower than 2,300. How much to risk on being long versus cash or buying long-term puts on the various indices?
I agree that its worth concentrating on risk/reward now that the bull market is (probably) coming to an end – ie. buying and holding will not work as well as it has done over the past several years.
I think that 7/8 August was a major high, and that now (up until 23 September) is a tradable selling point akin to JH’s “second chance”, but I have less confidence about what will happen over the next several months.
There is still a lot of negative sentiment around, and calls for a major crash, but its hard to tell if they are putting their money where their mouth is, or just commenting from the sidelines (I suspect the latter in most cases). So if there is to be a market decline soon, I expect it will be sudden and sharp rather than a typical topping process. You mention 2300, which seems realistic, but I am looking closer at 2000 and just below it by late October.
I mentioned “by the end of the year” above – in fact I have two dates for a final top if we haven’t already seen it – mid December 2017 and early April 2018. I’m becoming reluctant to keep extending into the future, but ISN is very high at the moment and is indicating that my long-standing November timeframe is still in play (November and mid-December are essentially the same given the length of the solar cycle).
So far I’ve mentioned July/August, September, October, November, December, April – this is why I’ve recently been pointing out that I’m nowhere near as confident about post-August 2017 as I was before it, going back to November 2015.
Fair enough – regardless, your calls have been fantastic. You’re certainly entitled to a little uncertainty 🙂
Thanks Mark. Your calls are a God-sent!
Mark, is there a point where if the market declines a certain percent you feel more confident the August 7/8 top IS the top?
I should have added that from a Demark point of view, 2420-2 on the S&P 500 is an important level, below which a correction call can be asserted with greater confidence. In the most recent downdraft, we came down to almost this exact level before bouncing back.
Maine Lobster yield have dropped from their 2014 peak, signalling a cooler ocean as the 2014 solar max has passed. Yield was also high in 1990 and 2000.
Gary – I don’t have any specific percentage in mind, but I would regard a daily close below 2455 as short term bearish, weekly below 2430, monthly below 2300.
People get ready… https://wavecount.blogspot.co.za/
Just to add to the confusion: as well as the current very high sunspot numbers (temporarily comparable to the solar max levels), now we have a significant CME on the way (will hit us late Wednesday) – exactly the sort of short term event associated with elevated solar max speculation:
The geomagnetic field is expected to be at quiet to active levels, with isolated periods of G1 (Minor) storming periods early in the period, as the CH HSS influence tapers over the next day (05 Sep). Days two and three (06-07 Sep) are expected to be elevated due to the arrival of the 04 Sep CME. G2 (Moderate) conditions are expected, with isolated G3 (Strong) conditions likely on both days.
Now another much bigger solar flare and earth-directed CME (midday UT on 6 September).
X9.3, by far the biggest flare of SC24 so far, and the 15th biggest ever recorded. Likely to hit us late this Friday, so Monday will be a day to watch out for.
http://tesis.lebedev.ru/en/sun_flares.html
Mark, all other things being equal, this solar activity is supportive of a move up in markets and mitigates the likelihood of early August being a potential top, is that fair?
Wow, I was just about to report this, but you beat me to it. The biggest of SC24 — I didn’t expect it so far from the solar maximum.
SC24 only had this one flare that made the top list — the previous SC had half a dozen in the top list. This shows what a weak SC24 this is…unless more are to come.
http://www.spaceweather.com/solarflares/topflares.html
Its fair to say that this recent phase of high sunspot numbers and short term activity (flares and CMEs) is typical of a solar maximum, and that that causes increased speculation and risk taking.
But the sun is definitely near its minimum (confirmed by the low latitude of current sunspot groups, and even John Li’s lobsters). Most large geomagnetic storms occur during the year of solar max and then three years afterwards (near solar min), so its not unusual to have such storms now (they also mostly happen in November, October and September: http://ilwsonline.org/presentations/08-10/eecher.pdf
But geomagnetic storm intensity has been remarkably low during SC24; barely half of what we’ve all lived through since 1932. So I think it is especially difficult at the moment to estimate how we will be affected.
The effect of today’s storm is being muted by a northerly oriented Interplanetary Magnetic Field (Bz=+7.0), but that could flip southwards later today.
I was wondering why we focus on the extreme distribution (max or min), so I accumulated the daily sunspot numbers to the maximum. By this measure, SC24 is the smallest of all cycles for the daily ISN data series. That is, not only does SC24 have a small solar max, it also has more spotless or near spotless days that other solar cycles.
https://postimg.org/image/ushwrd6h1/
Interesting to see a different interpretation, and surprising to see that SC14 is the most similar to now. Back then, ISN made a final surge nine years into SC14 which corresponds to where we are now in SC24. Stocks then behaved similarly to SC12 and 13 by challenging but failing to make new highs; losing around 20% after each challenge and eventually losing 50% during the following several years. http://www.solen.info/solar/cycle14.png
SC7 was similar too – but then, notably, stocks did break out to significant new highs over the next 3/4 years. However that stocks bull was into a Major Lunar Standstill (1836/7) – significantly different to where we are now.
So I think that all further indicates that US indices will not make significant new highs over the next three years. The difficulty in the meantime is in determining the exact timing of the “current” high…
Mark, in regards to your September 1st post on YoY% change in margin debt, you were correct – the percentage change when including the July figure is 15.7%.
I have a rather random question. The moon changes from right to left, and so now that we are moving to a new moon, it is dark on the right and bright on the left. Why is this the same view in Australia? Everyone is hanging upside down and so left and right should be opposite. http://www.calendar-australia.com/lunar-calendar/
OK I answered my own question. The moon changes from left to right in Australia. I was misinformed! Proof that the world is not flat! LOL.
From Quantifiable Edges:
From a seasonality standpoint, there isn’t a more reliable time of the year to have a selloff than this upcoming week. In the past I have referred to is as “The Weakest Week”. Since 1961 the week following the 3rd Friday in September has produced the most bearish results of any week.
And Tom DeMark was on Bloomberg TV Friday saying we are very, very close to an important top: https://www.youtube.com/watch?v=UBf9eGH9UdU
I hope that convincing bearish arguments will not become too popular amongst the majority as we approach 23 September. But I notice there are only 1156 views of that DeMark video on Bloomberg TV, so it does seem that relatively few are interested in bearish warnings.
SP500 is getting very close to my target – a surge above 2515 would do it. The gold cycle I mentioned above (same length as my medium term stocks cycle, but on a different phase) also happens to go bearish on 23 September too, which I think implies that any market sell-off will be severe (ie general selling, pushing USD higher).
But I’m still not expecting a crash of historic proportions; more like a 20% decline over four or five weeks.
Thanks, Mark. And here’s a call from Avi Gilburt, a respected market technician:
http://www.marketwatch.com/story/this-is-the-big-test-facing-the-sp-500-this-week-2017-09-18
ThSTOCK MARKET VS. EQUINOX
Tuesday 23rd September is the Fall/Autumn equinox. Equinoxes occur twice a year, the other being around 20th March.
The last 4 major tops and bottoms in the SP500 all fell within 2 weeks of an equinox:
Graphic did not copy
Extending this to include major turns in the period that took place within 2 weeks of an equinox, we get this:
Graphic did not copy
in total 10 bottoms and 4 tops. The dominance of bottoms fits with the seasonal model of the stock market, which is based on the seasonality of geomagnetism, and has lows near the two equinoxes:
Graphic did not copy
The two red arrows on the ‘seasonality of geomagnetism’ chart show when stock market crashes have predominantly occurred in history. Therefore, bottoms or lows not far from the equinoxes make sense.
Highs around the equinox? Inversions happen occasionally in lunar phasing. Full moons bring about pessimism and typically mark lows, but now and again they can invert as a high. As geomagnetism is a similar sentiment phenomenon, I expect the same sometimes happens here, but I can’t be more scientific. Nonetheless, if next week’s equinox is to have any relevance, then it would most likely be as a top, or inversion high, because we have not seen a period of selling into it for it to mark a low, as we did into the lows 1998-2011 shown above.
Looking further back in stock market history, in 1987 stocks peaked 1 month before the Fall equinox and completed their devastation one month after, so centred around it. The 1976 top and 1978 bottom in the Dow were both within 2 weeks of equinoxes, but other major tops and bottoms in the 1970s secular bear didn’t align, clustering rather at the turn of the year and seasonal high. In 1929 there was a mini-crash March 25 (equinox), the Dow topped 3 September, the London stock exchange crashed 20 September (equinox), and the whole combined crash process was done by November 13.
In short, I would summarise that maybe there is an equinox phenomenon. The most compelling reason for it is the stock market seasonal lows that occur close to them (circa March and October), driven by geomagnetism which affects human sentiment. On these grounds, most major turns would be lows at equinoxes, and just occasionally we would see an inverted high.
One more add: next week’s equinox falls one day from the new moon and new moons typically mark highs (both minor turns and major peaks) so if it were to mark a high then there’s an additional reason for it to do so. For this to have any merit, stock market indicators would need to be signalling such an imminent peak. September 19, 2014
Here’s the direct link: https://solarcycles.net/2014/09/19/stock-market-vs-equinox/
Credit spreads remain at cycle tights – the one big factor imho that continues to support the bullish case.
Agreed; and there are some other factors too – for instance, your YoY Margin Debt change measurement will increase to 16.9% for August.
And, as you already suggested, all this recent short-term solar activity (sunspots and flares) is associated with increased speculation, indicating that my November 2017 solar timeline for the stocks top is coming into play (Sept 2015 – Feb 2016 – Dec 2016/Jan 2017 – July 2017 – Nov 2017). But those dates are determined from only six previous similar solar cycles, out of gazillions that the earth has witnessed. The seventh most similar cycle was SC14…
…John Li’s chart above shows that SC14 is arguably the most similar to SC24. It also indicates an ISN breakdown/market peak around October/November 2017, but that could be extended a bit further because SC24 is even weaker than SC14. I think to try to work out an exact month from that alone would just be difficult, but it does suggest that speculation could conceivably extend into early 2018 (I would estimate April).
If that is to happen, I think we’ll get a sharp market clear-out first – between now and 23/27 October.
I had been expecting this measure to reach at least 5.5% before indicating any trouble for stock markets (ex-commenter Jigs was the first I saw mention it).
https://fred.stlouisfed.org/series/BAMLH0A0HYM2
But looking in detail at that spike from 3.4 to 6.5% in 1998 (July – October), I notice it coincided with a sharp 20% decline in the Dow.
I think we are facing something similar soon.
I agree. From someone I respect:
Investment grade credit spreads obviously are not sounding any alarms however there have been some downside weekly Countdown exhaustion ’13’ signals recently that also occurred in 2014 prior to a big spike. Risk can happen fast but right now nobody is going to care at these levels.
Since 1950, the SPX in Q4 has been up 79.1% of time. When September makes a new all-time high (2017?), Q4 is closes up 94.1% of time (16 of 17).
I could see where we might get a sell off into month end if the tax “reform” program fails to impress –
Heightened solar activity over the next few days:
Rationale: G1 (Minor) storm levels are likely on day one (27 Sep), with a chance for G2 (Moderate) storm levels, with the passage of a CIR, and the subsequent onset of a recurrent, polar-connected, positive polarity CH HSS. G2 (Moderate) levels are likely on day two (28 Sep) due to continued influence from the CH HSS. Day three (29 Sep) is expected to be primarily at active levels, with a chance for G1-G2 (Minor-Moderate) storm levels being reached.
INDUSTRIAL PRODUCTION
to
$0
$500,000
$1,000,000
$1,500,000
Buy & Hold
Industrial Production Filter
1994
1996
1998
2000
2002
2004
2006
2008
2010
2012
2014
2016
-10%
0%
10%
Industrial Production YoY % Chg
PNG
Industrial production measures the total value of output for all manufacturing, mining, and electric, and gas utility facilities located in the United States. It’s a leading economic indicator and is good way to quickly gauge how the manufacturing portion of the U.S. economy is doing.
Filter Rule: If the yearly percentage change in industrial production is equal to or below 0%, be out of the market
Notes: IP data is typically released 16 days after month-end and my data is lagged to reflect this delay
Current Reading: +1.5% YoY
Apologies, the pic didn’t copy over –
A good synopsis from one of the best analysts around:
http://www.businessinsider.com/stock-market-news-jpmorgan-explains-next-financial-crisis-2017-10
Have no idea how good Bulkowski is as a forecaster but thought I’d post:
“This is a chart of the forecast I do from time to time, quarterly this year. Notice that peak A comes well before B, and it’s higher than B, too. Bad timing. The index dipped and has recovered up to C, nearly matching the prediction.
Here’s where the ride gets scary. Notice how the market drops, and fast, too, after C. That’s about a 1,500 point drop in a month. Ouch.
This forecast isn’t guessing. It’s based on what has happened in prior years. Click the above link for more details. However, just because it’s a mechanical forecast doesn’t make it right. So we’ll just have to see what happens in the next four weeks.
— Thomas Bulkowski
“… I would only marginally prefer a stocks bottom in early November 2017 rather than a top…” (28 August, above).
My marginal preference for a bottom was wrong, as my solar-V-lunar extreme negative period from 23 September to 23/27 October has inverted. So I will be very interested to see if the extreme positive period starting next week will also invert, creating a top late October/early November.
On 1 September I posted a chart showing SP500 2550 as a natural high, and mentioning “…there is a bubble pattern which does not complete until after November (start and finish in light blue verticals, in-between pattern not shown)…”.I did show that in-between pattern on an earlier chart (4 April https://www.mql5.com/en/charts/6843469/spx500-d1-ig-group-limited ) , where the penultimate light blue vertical shows the final manic phase starting during the week of 27 September 2017. So that is exactly what has happened – its a pity I didn’t give it a high probability…
So now I have two distinct times for a US stocks top: from 23 October into early November, or mid December 2017. I think SP500 will find it very difficult to sustain above 2550, indicating a top sooner rather than later. Also, ISN will, at long last, almost certainly drop significantly below 20 this month, although two old sunspot groups are due to reappear this weekend. A lot will depend on how much they have deteriorated while far-sided.
We are now right at the final November 2017 timeline (derived from previous similarly weak solar cycles) for ISN drop-off. These have a very different affect on speculation to the SSN peaks of the recent strong solar cycles: SSN peaking in a strong cycle means a peak in speculation; ISN drop-off in a weak cycle means a huge change in sentiment, with the direction of that change depending on the prevailing circumstances at the time.
Thanks, Mark. So is it fair to say you have a high degree of confidence the market will peak in 2017 rather than April 2018? Or is that a tossup?
My confidence for 2017 rather than April 2018 is building, but I still have too many alternatives to put an exact percentage on it (say 66 to 75%).
I’ve mentioned before that the natural environment will not allow a crash until early November 2017. One reason for that is a bit of hocus-pocus (the less believable it is, the more it will affect sentiment): http://www.crawfordperspectives.com/documents/Mars-Uranus.pdf
Simply look at what happens when each opposition ends. I’ve looked at the crashes, panics, burst bubbles etc of 2008, 2007, 2000, 1973, 1970, 1966, 1962, 1937, 1929, 1893, 1881, 1852, 1797, 1720, 1637 and all of them coincided very closely to the end of this opposition (1946 was an exception, and the 1987 crash was five months late). The current opposition ends during the next two weeks or so.
Its worth bearing in mind that this opposition happens on average each 703 days (very short in astronomical terms) so it will by definition coincide with some important events, but I think its remarkable that it should so accurately and persistently mark so many market crashes.
I should have pointed out that wheras Arch Crawford was looking at bull markets from conjunction to opposition and bear markets from opposition to conjunction, I am looking only at severe declines in the few weeks after opposition.
http://www.fourmilab.ch/cgi-bin/Solar
I just wish I could find some evidence in the bond market of trouble brewing. So far, nothing…
Interesting article on AI and the finance industry: http://mathinvestor.org/will-artificial-intelligence-upend-the-financial-world
mean reversion
Mark, market action is reminiscent of the investor mania in 1999-2000:
The only time since 1990 that the S&P 500 was up this much (> 0.75%) and at a new high, with this few advancing vs declining stocks, was November 18, 1999.
I still believe we are watching SP500 searching for a top. I agree that market action is reminiscent of 2000, but can the same be said of sentiment? Back in 2000, I don’t think many were calling for a top. Nowadays there are many popular websites giving lists of reasons to expect a major crash – but I wonder how many of those bears are putting their money where their mouth is.
I’ve mentioned the 2550 area several times (2515/25 as the lower extreme, and 2573 in my chart of 04 April 2017). I also mentioned 2571 a year and a half ago (as part of a larger sequence up to 3225): https://solarcycles.net/2015/06/12/the-conundrum-of-our-times-part-1/#comments
In those comments I said that the current speculative phase could “arguably [extend] as far away as 2017Q4”. Chien-Jen’s solar comparison charts from back then have slightly different timing to mine, but show, in my opinion, that it could extend into Jan/Feb with an outside possibility of August 2018.
I don’t regard this natural high as broken even with SP500 above 2590, especially as we’re so close to my final (November 2017) timeline for ISN breakdown. I’ve also mentioned before that around 11 November would be the earliest that a natural crash environment could develop. Then there’s the “bubble pattern” which completes mid-December, and which the market has been following exactly so far.
So my timing problem continues – I think a top is developing, but don’t know whether it is more likely over the next few days or the next few months…
Thanks Mark. I agree with your assessment, and will throw in another possibility. Even if we do get a top around 9 November (my timing), we don’t need to have a crash but rather some mild volatility as traders take the rest of the year off for the holidays. We seen this at the end of 1906, as well as to some extent at the end of 2007, with the fireworks postponed to the new year. This would certainly frustrate the heavy VIX call buyers with December expiration, as noted in your “popular websites”.
https://pbs.twimg.com/media/DNbq3FjUEAAbaPu.jpg:large
Elevated solar activity expected over the next couple of days:
Rationale: G1 (Minor) geomagnetic storm levels are likely for the next
three days (07-09 Nov) due to a CIR, and a recurrent, positive polarity
CH HSS.
Margin debt YoY growth: closer and closer to going negative:
Filter Rule: If the yearly percentage chain in margin debt is negative, be out of the market
Notes: Margin debt data is lagged to reflect the NYSE release delay
Current Reading: +6.1% YoY (as of September 2017)
Posting a few times here today.
Mark Hulbert is one of the smartest, rationale market observers around and I always find his work worthwhile. Today he writes about investor sentiment and makes several cogent observations, including one analyzing the exuberance of investors were back in 1999:
https://www.marketwatch.com/story/this-bull-market-gets-more-respect-than-you-think-2017-11-07
There seems to be little consistency across all the sentiment surveys, so I don’t think they are very reliable. And I’ve never believed that there’s a population of people so dumb that they repeatedly go bullish/buy at every top and go bearish/sell at every bottom.
Where the population is “dumb”, is where they have allowed themselves to be convinced that consistently losing 2% of their money every year is a good thing. In the US, prices halved during the first half of the 1800s, and then stayed there during the second half: https://minneapolisfed.org/community/teaching-aids/cpi-calculator-information/consumer-price-index-1800
All that lack of inflation – and yet the country progressed mightily anyway. It took a world war and many millions dead to create some of our much-loved inflation. And now, unfortunately we’re back in the same situation. In fact we’re back in late 1886, with the same solar influence (end of a weak maximum), the same lunar influence (two years after a minor standstill), the same interest rate environment, the same populism, the same rapid expansion in money supply (gold then, bytes now) … but not the same debt levels (eg. US government debt declined from 1879 to 1893).
Under these circumstances (and for other reasons such as oil’s 9.3 year lead) it will be difficult for stocks to go significantly higher over the next three years or so, unless there is some debt-related loss of faith in the value of currencies (Bitcoin might be an early warning sign) or if war starts to physically engage continental US (stocks don’t like the outbreak of war, but usually bounce back very strongly).
Time for a little musical interlude to celebrate the top of the market, from someone who appreciates how everything repeats: https://www.youtube.com/watch?v=B7IVI4AvGG0
“The sun, the moon and the stars
they make the wind blow
It took me twenty years to understand”
The father of it is the sun, the mother the moon. The wind bore it in the womb. Its nurse is the earth, the mother of all perfection.
https://en.wikipedia.org/wiki/Emerald_Tablet
We are finally seeing a bit of unsettlement in credit markets. High yield ETFs have sold off strongly (but be careful here as bond ETF action taken out of context from how derivatives/cred spreads & performance of recent corp issuance are performing is completely useless) and credit derivatives / cash prices are backing up a bit.
Mark, while I understand your point about sentiment, I thought the article made several interesting points, including the one that even during the tech mania of the 1999-2000 sentiment didn’t appear all that bubbly and yet it turned out to be the top (to your posts above about how today some market observers are worried about the possibility of a crash and why that might mean such an event might is a ways off). In any event, I think we can agree sentiment is rarely if ever to be employed as a primary indicator(s) of market direction.
Gary, I agree that the Hulbert article raises some interesting points – some of these were news to me, so I’m glad you posted it.
He makes the point that newsletter writers were correct to be very bearish during late 1999:
“Believe it or not, the HSNSI reached its lowest level ever in mid-October 1999, when it fell to minus 81.8%. That meant that the average short-term market timer monitored by my Hulbert Financial Digest was recommending that clients allocate 81.8% of their equity trading portfolios to going short. That’s a whole lot of bearishness.”
But, in mid-October 1999, Nasdaq 100 was at 2400. Five months later, it was at 4800.
These newsletter writers, and consequently the Hulbert Stock Newsletter Sentiment Index, were right in a LONG TERM view that a major top was approaching – but they were all wiped-out in the meantime by being 81.8% short while the market doubled.
Arguably the best contrarian sentiment indicators I have ever seen were the barking guard dogs here on JH’s site, but sadly they have all been wiped-out too.
All very good points, especially the last one 🙂
I still think of John’s work and how good it was. He originally called the market as it’s played out but changed his mind after analyzing global demographics. I don’t fault him at all for being wrong as his analysis was insightful and well laid out. At the end of the day, it all has come down to famed market technician Marty Zweig’s admonition “Don’t find the Fed” or in this case, the world’s central banks.
You, on the other hand, have been right all along, and in the face of what turned out to be foolish criticism from long departed crickets.
That’s “don’t fight the Fed”, obviously..now hopefully, this graph will show up. If not, the link to it will help. My question: where is the reduction in the Fed’s balance sheet they promised beginning last month?
https://fred.stlouisfed.org/graph/fredgraph.png?g=fHRT
Are we already in SC25? Will it be stronger than SC24? I heard it both ways. Just wanted to share.
Click to access Prediction-of-Solar-Cycles.pdf
A series of three supermoons will appear on the celestial stage on December 3, 2017, January 1, 2018, and January 31, 2018.
https://science.nasa.gov/science-news/sciencecasts/a-supermoon-trilogy?utm_source=TWITTER&utm_medium=NASA&utm_campaign=NASASocial&linkId=45414122
I mentioned this here a couple of years ago, and think it is becoming increasingly timely now: http://davidmcminn.com/pages/greatwave.pdf
With such a long term cycle it is difficult to put an exact timescale on it, but in my opinion it is most likely that December 2017 will with hindsight mark the move into the 5th stage.
“5th Stage. The price revolution [long term inflation] peaks and then collapses resulting in demographic declines, economic breakdown, political revolutions, wars and social violence”
Demographic contraction. https://www.goodreads.com/book/show/32082.The_Great_Wave#other_reviews
I read this on the site from Peter Temple :http://astrohoroscope.info/stoycheff/?p=69
From a DeMark perspective, the market is due for a respite at the very least on a longer-term (monthly) basis, aligning with Mark’s suggestion this month will mark the top:
The monthly S&P 500 (SPX) has recorded a TD Combo Sell @13. This opens the window for momentum to stall anytime. Making an attempt to hone in on the timing, we can try to synchronize the timeframes. The first test comes now since the daily TD Sell Setup has recorded a 9 last Friday. If markets are ready to sell off on a larger scale, the SPX should look to trade under the daily TDST Support level at 2578.24. Hold 2578.24, the SPX should continue higher until the monthly reaches a TD Sell Countdown @13 at the end of December.
“We are finally seeing a bit of unsettlement in credit markets. High yield ETFs have sold off strongly (but be careful here as bond ETF action taken out of context from how derivatives/cred spreads perform & the performance of recent corp issues is completely useless) and credit derivatives / cash prices are backing up a bit.”
This unsettled action I mentioned back in November didn’t last long and sure enough equity markets shortly moved to new highs thereafter. While everything is set for a credit dislocation, it may have to wait until next year when the Fed begins to trim its balance sheet in earnest and the ECB / BOJ ratchet back their purchases.
Hi Mark, per your comment:
“I don’t regard this natural high as broken even with SP500 above 2590, especially as we’re so close to my final (November 2017) timeline for ISN breakdown. I’ve also mentioned before that around 11 November would be the earliest that a natural crash environment could develop. Then there’s the “bubble pattern” which completes mid-December, and which the market has been following exactly so far.”
Any update on this?
My problem, since mid-2017, of having more than one convincing timescale continues. The December bubble pattern ends around now, but there is also the early April 2018 one.
My shorter Solar-V-Lunar cycle turns negative on 21 December (but within a positive medium one). If SP500 is mildly bearish between 21 December and 19 January, then I think we will see a final manic phase lasting until the first week of April 2018.
If SP500 maintains its recent strength until 16-23 January, then that would seem like the ultimate top to me (especially if it dips briefly before making a new high then).
One definite development is that ISN did in fact break down as expected. This means a big change in sentiment is due: not necessarily a simple positive to negative swing; more likely I think the start of a few years of huge swings without significant new highs. After that, lunar declination and Bradley strength etc would dictate a very positive phase until 2025/7, but that positivity was negated in previous weak solar cycles.
To make matters even more complicated, we are now nearing the end of this roughly 100-year inflationary period; but it will probably end with a final surge of inflation (which under the current circumstances might involve a loss of faith in government money). Perhaps the recent stock price inflation is forewarning us of something more widespread to come.
Thanks Mark, We should dip into 21/22 Dec and after that up again till Dec 27.
Why do you think that carpediem01site?
@John LI,,it’s not thinking but trusting the stars, after Dec 27 down again till Jan 5-7.
2018 Spring Equinox, DJIA 30,000 ?

Thanks for the timely reminder.
Spring Equinox plus two weeks = first week of April 2018.
YoY margin debt growth has rebounded to +16%
It will be interesting to see the November figure – should be out in the next few days. December 2016 to April 2017 figures were strong, so the next six months’ releases will be worth a close watch…
I notice that available cash and credit have been weakly diverging from Margin Debt for the last year and a half or so: http://www.nyxdata.com/nysedata/asp/factbook/viewer_edition.asp?mode=table&key=3153&category=8
I’m not sure of the exact details of what this means, but it seems to suggest that investors have been becoming increasingly over-committed in the sense that relatively small market declines will see relatively large numbers of investors receive margin calls (?).
Mark, that jump in YoY growth does include the November figure, I’m almost certain.
It is worth keeping an eye on oil now, for at least three reasons:
It tends to form a top like equities at this point in the lunar declination cycle (c.1981 and c.2000).
It reliably leads the stock market by half a lunar declination cycle (oil July 2008 = stocks December 2017, but its too long a cycle to tie it down to an exact month in practice).
Sentiment towards oil is very optimistic, while commercial hedgers are short like never before: https://kingworldnews.com/we-have-never-seen-this-before/
Agree, Mark, about oil. Tom McClellan has done a fair amount of work regarding oil and equities:
https://stockcharts.com/articles/tac/2017/02/tom-mcclellan-crude-oil-foretold-the-trump-rally-10-years-ago.html
Several posts over the year by Tom regarding the relationship –
Correction: “Several posts over the years…” not year.
Also, for those interested in rates and inflation, check out the recent pop higher in this chart: https://fred.stlouisfed.org/series/T5YIE
Well, I’m finally joining the bear camp. The market played out in structure as I called it last January. I predicted the deep and rather quick 4th wave, then new all time highs toward year end. Now, I’m ready to call an end to the bull market. The top may be in, or we could creep toward SPX 2731, but I’ve exited equity longs and entered equity shorts, precious metals and selective commodities longs over these last couple of weeks.

Alphahorn, thanks for posting, good to have you back.
I didn’t realize the community continued on, just happened by
While many have gone, there are still a few of us posting here. Your call for a top aligns pretty well with Mark’s thinking and DeMark methodology. Personally, I’m looking for some evidence of dislocation in the credit markets – so far, they remain quiet.
Long a number of commodities including Coffee via JO. Look at the inverse relationship between SBUX and JO

Interesting about coffee – my DeMark work has focused on JO as a long opportunity.
And resources in general: Jeff Gundlach at DoubleLine has this wonderful long-term relative performance chart of commodities and stocks. What it shows is we are due for a mean reversal in a big way in favor of commodities.
i couldn’t agree more, i’m very bullish and very long commodities
Nice to see you back alphahorn, Mahendra is also very bearish and his last date for a final top is today so let’s see if this will be true.
Are you bearish for a long run or just a sizeabale correction?
Certainly seems we’ve entered that manic phase Mark has referenced in the past. Even Jeremy Grantham has mentioned as much: https://www.marketwatch.com/story/stock-market-investors-should-brace-for-a-possible-near-term-melt-up-jeremy-grantham-2018-01-03
Do you mean to go long for this GMO 60% rally in 6 months?
John, the DeMark methodology I use in part is suggesting we have reached an exhaustion point in markets on daily, weekly and lastly monthly (as of the end of 2017) timeframes. And some DeMark users say that the longer the time frame for which a signal is rendered, the more important, so a DeMark exhaustion signal on a monthly time frame is important.
That said, we saw daily and weekly DeMark exhaustion signals several times in 2017 and they were only met with pauses in price, rather than corrections. Perhaps with the monthly now signaling exhaustion it will be different this time, we’ll see.
Bottom line, I’m leaning bearish along with Mark and Alphahorn but I need to see two things: an actual move down of consequence to confirm the trend has changed by DeMark standards and some evidence of upset in credit markets. As far as the latter is concerned, it may be as simple as a breakout in the 10-year yield. Certainly a longer-term chart looks set up for that to happen.
20 January 2015: “What would really be unprecedented, would be SP500 failing to go manic from current levels!” https://solarcycles.net/2015/01/17/saturday-markets-update/#comments
At that stage it was up 210% over 5 years, compared to 1920s Dow +484% over 8 years and NASDAQ +733% over 8 years. Today, SP500 is still “only” up 311% over nearly 9 years, so there’s defintutilly a possibility of further mania.
I still have two competing scenarios though-
1 – medium term and short term Solar-V-Lunar cycles both turn negative on 16 and 19 January respectively (if SP500 holds above c2685 until then),
2 – my single remaining bubble pattern enters its final manic phase during week beginning 22 January, finishing early April 2018.
Obviously only one of these can be correct, but I don’t have any objective way of favouring one over the other. I think a big move is coming though, and I personally will bet that it is downwards.
About three years ago I mentioned this Fib sequence for SP500: 455-1110-1515-1840-2166-2571-3225; but more recently I’ve thought its been moving too slowly to achieve 3225.
This week, SP500 has reached the upper (thin blue) trendline on this chart from 04 April 2017: https://www.mql5.com/en/charts/6843469/spx500-d1-ig-group-limited
That trendline is currently at 2723 (and will be 2730 on 16 January), so with SP500 being above 2723 all day today it will be very interesting to see if it can hold that for the next two weeks…
Thank you, Mark. I wish there was a new age “like” button, and I would like every one of your posts.
Thanks Mark, I think the turn will come Jan 16.
Well my bearish call didn’t last long. I’m back on the bull train thinking we’ve got another year bullishness. I’m looking for the largest pullback coming end of August, early September with a Puetz crash window and intermediate wave (4), but the market will make another new high after that

AH, your two channel charts tor the S&P 500 (the one immediately above and a prior one) show two different trend lines. In the one immediately above, the index looks like it can move higher before hitting the top of the higher trend line, the prior one (December 31, 2017) showed the index had exceeded the top channel line.
I’m curious what changed between the two.
top one is linear, the lower one is log
I should have guessed that.
Mark has postulated that the mania we seem to be experiencing could go as high as 3225. (“…there will be a huge stocks crash in the meantime, but that will be after we’ve seen a huge bubble first (SP500 450-1106-1509-1837-2166-2566-3225 by Q2/Q3 2017, then a steep decline of around 40% to below 2000 again.”)
AH, does the top line of your log chart see 3225 or thereabouts in the future?
For those watching the 10-year, 2.63% is the Maginot Line.
With regards to this week: http://quantifiableedges.com/january-opex-a-weak-week/
Mark,
Do you still see the US top here or will we go higher into April?
Thanks
John.
I do think this is a betting opportunity to go short (and long UVXY), but I’m still 50/50 on whether the mania can keep going into early April. SP500 is now in-no-mans-land between 2550/70 (which was my November/ December target) and 3225 (where I originally thought, and then rejected, it could reach – 450-1106-1509-1837-2166-2566-3225).
On 19 June 2017 I mentioned some simple relative Bradley strengths (comment above); the 2018 value is only slightly below the 2017 one (both relate to June), which is one reason why I think stocks weakness will not start to really accelerate until later in 2018. So I don’t know whether we’ll see a top now (and subsequent few months of topping process); or another increasingly manic stage (possibly 3225 as early as April 2018). I don’t have any other convincing options.
I am stunned by the low Ap/Kp levels. I don’t think I have seen since a low peak before. The data starts from 1930. Could the absence of geomagnetism mean there is no peak?
Yes, geomagnetic disturbance levels have (since the last solar minimum 2009) been only about half of what we had previously been used to. But the aa index goes back to 1868 and shows how similar the late 1800s/early 1900s solar environment was to the last ten years or so: https://tallbloke.files.wordpress.com/2015/08/image-601.png
The similarities between back then and now are remarkable, with one huge exception:
– then we were at the conclusion of a long period of price stability (and the economic progress, peace etc it induced),
– now we are at the conclusion of a long 125-year period of price inflation (and debt, wars, discontent etc).
The progress we’ve seen recently has been the result of oil and electricity – both discovered more than 125 years ago. Medicine has improved greatly, yet hospital queues are longer and you’re more likely to die of cancer or diabetes, and the treatment for flu is still “drink plenty of water”.
Not to worry; we can send instantaneous photos of our dinner to absent friends, buy and sell our houses to each other for higher and higher prices, and improve our social standing with a visit to the dentist!
A gamble to be short. That is for sure! Even if the market rise seems insane, it is more insane to be shorting a meltup, IMO!
From 13D Global Strategy and Research –
Downturn in US $’s 15-year cycle & rising global reflationary-forces poised to accelerate. This, combined with massive liquidity created by many years of central bank money-printing, could trigger one of most dangerous & opportunistic climates for investors in decades
There is a bolded red Bradley Date a week from today (the 29th).
Yes, geo bradley Jan 28 and helio bradley feb 1, I think we will see a a top today or tommorow. and a bottom on Jan 31, full moon and moonwobble period.
From Mark Minervini: “Melt-Up” Update: The largest melt-up occurred in 1929 when the Dow rallied 29.9% in 94 days. The current rally – which I believe is in a melt-up – has lasted 95 days and is up 21%.
After this weekend we will go down a bit but we will peak into the fed meeting ( lunar eclipse) after fhat choppy sideways action untiil March.
So we found a bottom today and I see the us moving up again.
We’ve now had as decisive a breach and turn of this moving average as I’ve ever seen: https://www.mql5.com/en/charts/8269861/spx500-d1-ig-group-limited?bind=1
I expect to see a retrace back up to the turning point approaching 2820 for SP500 for another chance to go/add short. But there’s still the chance of further mania until early April 2018.
And this is merely the daily chart – a breach and turn monthly will be needed to confirm the end of this bull market…
… https://www.mql5.com/en/charts/8269870/spx500-mn1-ig-group-limited
The monthly moving average is way down at 2475, but rising quickly. 18 February is my next solar-V-lunar short-term turning point, but these have been inverting more than usual since July 2017. Could be a lot of volatile uncertainty until early April.
Thanks, Mark. One of the most interesting aspects to this reversal is the utter lack of empathy from the 10-year. Normally, we would have seen a substantial decline (relatively speaking) in yields in a flight to safety episode. So far during this brief correction, however, yields have hardly budged; in fact, they’ve moved upwards. That’s quite unusual.
So are markets saying we’ve entered a new interest rate regime driven by wage growth, huge Treasury supply coming down the pike, or, gasp, an uptick in inflation? Whatever the reason(s), I agree with others who suggest if we see yields above 3%, equities will have difficulties.
I will say credit (not rates) continue to be very well behaved, arguing for a retrace back up.
“… a retrace back up”. Or even further gains.
This is the trendline I mentioned recently (an obvious one). A bounce from it could act as a launchpad for significant further gains; but a break back below would look very bearish: https://www.mql5.com/en/charts/8270531/spx500-w1-ig-group-limited
Mark, do you have a chart that has a price bar on the side?
Gary, if you scroll your page down you’ll find a horizontal scroll bar at the bottom of the chart – scroll it to the right. These are not the charts I actually use for trading by the way – I have to use Windows to create them to get each link. My own chart shows that that trendline was right on yesterday’s close, so we are now well below it.
John Li recently mentioned insanity, and I recently mentioned volatility – looks like we’re getting both today!
Yes, and obviously a larger correction than I anticipated given credit behaving well.
Small comfort after the fact but this article below provides some real insight into what we’re seeing.
Risk parity, or the old 60/40 stock/bond model has worked very well for decades. However, this year we’re seeing something peculiar, i.e., government bonds declining in price at the same time that equities are. That’s unusual and means the 60/40 model is losing on both sides. Not supposed to happen that way, and as a result the models’ that run these risk parity strategies move to a second line of defense to reduce risk, i.e., sell.
That and all the other leverage in the system (e.g., margin calls) is what’s hitting today.
https://www.bloomberg.com/news/articles/2018-02-05/mom-and-pop-keep-risk-parity-afloat-amid-selloff-for-now
Well, support from that trendline didn’t last long. The heavy selling-buying-selling started when it was breached. It is interesting that SP500 received temporary buying at each long term trendline, so it wasn’t simply a complete panic.
Also, I’m interested to see that SP500 bounced neatly overnight at 2550, one of my two natural highs (the other being 3225), so that is still an important level. Will it provide enough support for another manic phase towards 3225, or will it break down over the next few weeks? I mentioned above that I’m 50/50 on that, but am not starting to favour the latter.
Mark, some suggest the cryptocurrencies are a leading indicator for stocks (ground zero for investor mania, if you will). They’ve led on the downside and appear well on their way to completing their own crash cycle. If there is causation in this correlation, it argues for a breakdown in stocks.
The other thing I’d say is that people will now be talking about how the fundamentals are still very positive (and they are). However a financial shock, if large enough, can also cause an economic shock, with real impact on demand. We’re not there yet, but it’s something I’m watching.
Sounds sensible.
And I see some headlines today about “Picking up the pieces” – a clear assumption that yesterday might have been bad, but at least its over now; a mini modern day version of 1987 (and what a great buying opportunity that was). This seems to me to be a very risky assumption.
I’m increasingly convinced that these next three years will be wild and bewildering while the value and very nature of money becomes increasingly uncertain: when more and more people wonder why paying 2% per year more for everything is supposed to be a good thing; how buying more and more expensive stocks is not actually a road to riches; and when will we benefit in a material way from trading our houses to each other at higher and higher prices with borrowed money?
Mark, another piece of the puzzle is the trillions in pension and social security promises that are unfunded and can never be funded. I suspect that is why govts generate inflation as it is the only hope to save those programs.
An EWT perspective:
https://www.elliottwavetrader.net/marketupdate/Let-s-Calm-Down-201802584459857.html
In a nutshell: “So, as long as we hold the 2400SPX region, my expectation is that we will develop another rally phase into the end of 2018, which will likely point to at least the 3011 region, and potentially up towards the 3223SPX region. It would be from that region I am going to expect a 15-20% correction which seems to be lining up with the 2019 calendar year, with the remaining part of this year completing wave (5) of v of 3.”
Interesting that Avi’s upper most target coincides with Mark’s.
There was a nice correlation with the tides High -Low Jan 31 high tide and the low on Feb 9.
see:
tidal_coefficient.
http://www.tides4fishing.com/us/new-york/new-york-city-east-41st-street
What is your view at the moment Mark?
I have a turning point on Feb 17 ( tides and planets) .I think it will be a high.
“18 February is my next solar-V-lunar short-term turning point…” (above). I’m happy that the sun and moon (and tides and planets) are still in charge!
I think its unlikely we’ll see further significant highs in the US markets; but if there are they’ll be short-lived.
Lately, for me, its been a time to get off the US hamster wheel and look elsewhere.
This week should be down, we have seen the top last Friday, we will go down strongly into Feb 26/27 after that sideways for a while.
Mark, don’t you think a double top is possible like Aug/Okt 2007?
Yes, I think that’s likely for the US indices John. But for some markets like DAX I think it will be a lower high.
My first bubble pattern topping mid-December 2017 was several weeks premature, and my second one for early April 2018 hasn’t happened. My solar-V-lunar timing indicates a very strong period from that first week in April until the end of June, but I can’t be more exact than that as the short-term cycle inverted a few times on the run-up to the market top and that uncertainty could continue. At the moment I would say a double top should occur between mid May and early July, but more likely nearer the end of that period.
Also, the big Bradley at the end of May/ start of June is especially important as its relative strength is only slightly less than last summer, but then starts a process of accelerating downwards until late 2020 (I’ve mentioned my simple integer values for that a couple of times above).
I have a weak period for gold starting now until the third week of May, so we might see a major gold bottom coincide roughly with a major stocks top.
Thanks Mark,
The turning points of the Bradley respond very well lately,It is only difficult to spot if it is a bottom or top.
Next turn tomorrow a top?
Agreed about Bradley turns – the direction of each individual turn is unrelated to the direction of the market. But I am convinced that the relative strength of successive Bradleys causes risk aversion to change in the longer term.
For example, the weakest Bradleys were 1931, 1875 and 2010. The strongest were 1998, during WW2, and 1966. 2027 will be the strongest (stronger than 1998). But, of course, there are inversions like 1648 – that was the weakest Bradley of the last 500 years, but coincided with the stocks major high of the Dutch Golden Age. It took until the South Sea Bubble in 1720 to break through that high, but it was repeatedly back-tested until 1784 until stocks finally broke permanently higher than 1649.
So I believe there is convincing evidence that the strength of the Bradley calculation is very important. But before it rises up to the very high 2027 peak, it will continue its downward slide from 22 June 2017 until 02 December 2020 (with 01 June 2018 being only slightly weaker than June 2017).
Thanks Mark, At the moment the party has made it’s return again,so maybe we first will slide again till Mercurius retograde midpoint April 4. What do you think?
Usually Mercury joining us would create enough tidal force on the sun’s plasma to increase geomagnetic disturbance, but I’d be surprised if the disturbance is very high during the solar minimum. But I did have the first week of April to be a potential peak of a manic stocks phase; that hasn’t happened, but I still expect that week to be one marking a change of sentiment.
Both of my solar-V-lunar cycles will be bearish from 19 March then both change to bullish on 07 and 18 April. Both do not go bearish together again until near the end of June.
So a sharp drop starting next week for three or four weeks, then perhaps another convincing (but ultimately final) attempt at new highs…
I use EW and cycles and I see it exactly like Mark.
DAX is done lower high and the US indexes I think we have ending diagonal with a top May/June.
Thanks Mark, Bulls eye, do you think we are heading for new lows or a retest on the SP500?
Today a bradley turn (geo) next one April 25.
And also important mercury at midpoint ( zero) from the sun April 1.
I’m not too sure of levels at the moment, especially in the short term, but I would expect the 2525-2570 area to be tested with a temporary dip below there.
Then I think we’ll see JH’s “distribution-shakeout-second chance” scenario continue to play out. The distribution and shakeout have already taken place, with the second chance being a marginal new high in some markets and a lower high in others. Looking back through his charts above, with hindsight, the distribution happened during 2015.
I still don’t think we’ll see a 1987 style epic crash though – I expect more of a gradual unconvincing weakening which slowly gathers pace towards a big sustained plunge in late 2020 and into early 2021.
Thanks again Mark, the tide made a turn on March 25 next one April 1.
I know this economic research organization and find their work very insightful. What’s particularly interesting about this particular piece is its very out of consensus call on the global economic outlook. Most everyone else is focused on how well economies are performing right now while this article says the long-term trend is changing and not the better:
https://www.businesscycle.com/ecri-news-events/news-details/economic-cycle-research-ecri-lakshman-achuthan-business-cycle-the-global-economy-s-wile-e-coyote-moment
Now this is a longish multi-month call and is designed to give the reader a head start in understanding how the economy will be performing out a few quarters. At the same time, if its forecast turns out to be correct, it’s interesting how the weakening global growth this report says is on the horizon will align with Marc’s call of a final top in the U.S. markets (others having already topped).
We shall see…
Jay on the Markets’ latest piece shows a graph detailing the growth of $1,000 invested in the S&P 500 Index (using monthly closing price data from 1932) ONLY from the end of January of each Mid-Term Election Year through the end of September of each Mid-Term Election Year (i.e., the latest iteration began on 1/31/2018 and will extend through 9/30/2018).
The cumulative performance for the S&P 500 Index during the Mid-Term February through September period is a fairly painful -44.3% (for the record, the cumulative gain from buying and holding the S&P 500 from 12/31/1932 through 2/28/2018 was +39,288%, so yes, this qualifies as a period of some serious under performance).
That being said, it should be noted that this Mid-Term Feb through Sep period showed a gain 12 times and a loss only 9 times. So a “rough patch” is no sure thing. The problem is that when this period is bad, it is “very bad”. This period experienced 6 losses in excess of -17.5% (FYI, a -17.5% decline from the 1/31/2018 close of 2823.81 would see the S&P 500 Index hit 2330).
A useful illustration of how the sun is still dominating the moon at the current stage of the lunar declination cycle, on its way the the next Major Lunar Standstill during 2024/5: http://time-price-research-astrofin.blogspot.ie/2018/03/declinations-of-sun-moon-and-planets_28.html
People have been dragging 25 ton stones around for thousands of years trying to measure this cycle. The monthly extremes of the moon will catch up with the yearly extremes of the sun during early 2020 – Gann’s Financial Timetable details what this means for sentiment and the markets.
I think the stock markets (and house prices) are now facing two years of slow, painful, volatile weakening which gradually accelerates downwards. It will be interesting to see which areas of the world cope best: I expect we’ll see an increasingly bipolar world – east/west; inflation/deflation; business/violence. And there’s an elevated probability of major earthquakes during the next few years.
Mark, I know little about Gann’s Financial Timetable but in googling it I see years ending in 8 are positive in his system, and specifically it calls for high prices in 2018 with panic to follow in 2019-20. Is that an accurate read?
Gann’s Financial Timetable is the 18.6-year Lunar Declination Cycle. The green rows and red rows in this updated version are the Minor and Major Lunar Standstills respectively: http://time-price-research-astrofin.blogspot.ie/2012/03/wd-ganns-financial-time-table-extended.html
At each Major Standstill, debt reaches unsustainable levels and begins to decline; land and house prices peak and decline, reducing the value of security on loans; default on those loans increases; banks suffer; much debt is wiped out; the process of new borrowing begins. This process can also happen at Minor Standstills, but usually not so severe, and not as often. It also happens to some degree when the dominance of the moon as seen from earth matches and overtakes that of the sun (eg. 2019-20).
This cycle is the most reliable and consistent measure of market sentiment I have ever seen. It still works for two reasons:
1- very few people take it seriously
2- the standstills are three-year processes, so timing is difficult and requires patience (eg. maximum declinations in 2005/6/7/8 were 28.594, 28.725, 28.600, 28.043 degrees compared to 18.650 at the other extreme).
So we are approaching another panic, but by this timing method it could be in 2018, 2019, 2020, or 2021. I am very interested to see SP500 bounce so strongly for a second time from my “natural high” at 2550, and especially so that it is precisely at the time I anticipated a conclusion to the manic phase. So I have to be open to the possibility of an inversion, with a final manic phase starting now. I’ve bought some calls on the world’s most hated stock market (FTSE100) just in case.
This cycle April1 till 11 should be slightly positive
Mark, do you think that the rates for mortgages in Europe will rise in the comming years?
I’ve no doubt that we’re in an environment of rising interest rates. Normally they would increase slowly and gradually as borrowing increases following the previous financial crisis (ie. the previous Major Lunar Standstill). But a major debt wipe-out was artificially avoided by QE/ZIRP/NIRP.
Banks, having been saved by extremely low interest rates, have been making it clear that they want a return to normal rates so that they can increase their profitability. And LIBOR has been showing warning signs recently.
I think that Central Banks will not want to raise base rates much or quickly, but that they will lose control over marketl rates as consumers, businesses and the financial industry become increasingly nervous about getting repaid.
Thanks Mark, I will fix my mortgage rates for 3 years.
John, don’t make financial decisions based on what I say – these are just my current views, and they will possibly change as circumstances develop. I’ve got some things right, but I’ve also got plenty of things wrong too!
Hello all,
I stopped visiting here regularly after John Hampson took ill. Do we anything about him, his health and hopefully his recovery?
Thanks Mark, but the difference is very little 1 year 1,85% or 5 year 2,1%.
Does anyone else have the problem of posting a comment and it not posting? I’m trying to figure out what’s going on.
This one has been making the rounds of late:
https://macromon.wordpress.com/2018/04/20/jfk-trump-sp500-analog-its-showtime/
I don’t think I’ve ever seen one of these analogs continue its correlation after it has been published and become popular. But this one is interesting for two other reasons:
Firstly, the 1962 bear coincided with ISN breaking down below 50 (reliably marks a major change in sentiment). That happened again April-July 2016 marking the breakout start of a manic phase: http://www.sidc.be/images/wolfjmms.png
Secondly, 1962 was a “Panic” year in Gann’s Lunar Declination Timetable (written 53 years earlier). 2020 will be the next one, but I would extend that to 2018-2021 (comments above).
Also, we seem to be back in a “crash now or crash soon” mentality; “bubble looking for a pin” is the current way of putting it. That pin is widely anticipated to be a major war (as if there aren’t any already) – but the epitome of modern technology, the cruise missile, has recently been proven to be largely ineffective, so we’ll hopefully see a period of relative calm for a while western powers re-evaluate their position. That should also provide a lift for the stock markets.
Mark, question: when you say the 1962 bear coincided with the ISN breaking down below 50 and happened again in 2016, only to the upside, you’re pointing out that the change in sentiment that accompanies an ISN breakdown can move in either direction?
Yes; see comments on 04 and 05 January 2015 about stock continuing to rise for another 2 to 5 years after the solar max in some cycles (eg. SC7,9 and 16): https://solarcycles.net/2015/01/02/more-indicator-updates/#comments
And also leading up to 22 March 2015, when John Li and I were looking at the detail of sunspot-V- geomagnetism timing: https://solarcycles.net/2015/03/15/zirp-vs-solar/#comments
From 22 March 2015:- “…During SC20 (late 1960s) and SC13 (late 1890s) US stock prices had been volatile, before surging upwards (taking commodity prices with them) in both cases as ISN fell from its plateau. Then 2-4 years later, after very large gains, they lost around half their value while commodities accelerated upwards. That is what we are facing over the next few years, unless US stocks do during April 2015 what they did during September 1929”
So, another 2-4-5 years from 2015…
Thanks Gary interesting:
We are now entering the moonwobble fase till May 9 with a peak energy around May 1.
So we should decline again.
http://bathtubbulletin.com/moon-wobble-peaks-may-18/
Looking at my asto,we should see a sharp sell off with a new bottom om May 5 or 6.
Just a reminder, we have a significant Bradley turn date for the end of May / June 1st. There are only two major turn dates in 2018; the last one on January 29th worked brilliantly.
Interesting read: http://quantifiableedges.com/spx-performance-based-on-soma-action-during-the-present-qt-initiative/
“Prior to the next solar max comes the next solar minimum, which historically has been the scene of bottoms, panics or crises. So circa 2020 we get a major low in equities before the deeper one of around 2025” – John Hampson (above).
We entered the solar minimum period in Q4 2017 and are heading towards what will be the officially defined month of the “exact” minimum. Judging by previous weak cycles, that could be 20 months away from now – month 40 on the Solar cycle 24-25 Minimum transit chart here: http://users.telenet.be/j.janssens/SC24web/SC24.html#RSC24
But the inclusion of the unusually-lengthy minimum into SC24 in the calculation of the blue SC12-15;24 line means that the current minimum is likely to be slightly earlier than 20 months away. So the official solar minimum should have occurred by late 2019/ early 2020.
On Earth there is no sign of cosmic ray counts turning back down yet. But there have already been three high-latitude reverse polarity sunspots (the first of SC25) around 9 April; however these were too short lived to be officially numbered.
I think the next year and a half is going to be particularly awkward, with two main possibilities:
1 – (as mentioned 21 September 2016) an historic crash H2 2018 and subsequent bear market rally into 2020, or
2 – (more likely) a gradual weakening of the US markets accelerating into late 2020. But first there’s a small but still significant chance of the SC12 scenario repeating (solar and lunar-wise, 1888 is the closest to 2018), with a final c20% rally putting SP500 above 3000.
Here is an EWT-based narrative on where we may be headed over the next several years:
https://seekingalpha.com/article/4176376-sentiment-speaks-lot-financial-pain-coming-united-states-america?li_source=LI&li_medium=liftigniter-widget
An older comment (February 2018) from an investment website about the solar minimum: http://www.effectivevolume.com/showthread.php?10757-Grand-Solar-Minimum
Makes a change to see anyone talking about solar cycles these days! That’s typical of a solar minimum period, in direct contrast to the hundreds of comments here on each of JH’s articles during the solar maximum.
Yet, as some of us have been saying for several years, the solar minimum of a weak cycles is when crises occur, speculation falters and markets break down.
Counting the number of months since the previous Max indicates Q3 2019 as the likely SC24 Min (ie. the official start of SC25). But counting from the first spotless days indicates late 2021. Having said that, I don’t think the exact timing will matter much to the markets as crises and market tops could occur anytime between late 2017 (ISN breakdown) and late 2021.
Speaking of ISN, July 2018 could be the first whole month without a single countable sunspot, if the next two weeks are like the last two…
Mark, I know you have pointed out before that marking stock market tops is much more difficult than bottoms, but is there something about solar minimums that make doing so particularly problematic? Also, a four year window is quite wide, and while I understand your point is we’ll see during this four-year period a series of crises and tops, is there any way to narrow the timing of your prediction? Over the past year it seemed you had greater confidence in your ability to time markets, but now it seems you are giving yourself a lot more leeway. (Not a criticism, by the way.)
You’re right – during July 2017 we briefly discussed that the things I look at would become much less certain for timing purposes. Its not that they have become mixed or inconsistent; its that they then became diametrically opposed: half of them point in one direction, but the other half point in the opposite direction. In fact, it seems to me that the whole world is going like that where the familiar “normal distribution” has been split into two opposing extremes (Brexit and the Trump election are two obvious examples).
Lunar declination only narrows the four-year solar cycle window down slightly, to 2019/2020/2021. But the two are acting in unison for the first time since the late 1880s (there was a lot of “populism” and money creation then too), so the coming crisis will be a big one.
Looking at shorter term timing, the period around early November 2018 (four weeks either side) will be critical. My solar V lunar timing combination shows stock markets struggling to make new highs until the second week of September 2018; then a very positive period until 07 December 2018 when both short and medium cycles simultaneously go negative.
But I’m still only 50:50 on whether SP500 can meaningfully break the January 2018 high. If it does, then we might see my old higher target of 3200 reached by December 2018…
Some impending influences on our natural environment, none of which are looking positive in the medium and long terms:
1. Earth and Sun: early stages of a solar minimum ( a time of crisis as discussed above)
2. Earth Moon and Sun: early stages of a three year panic window (lunar declination)
3. Earth Moon and Stars: North Node moving through Leo (typically marks the end of a long speculative period). Transition from Leo will complete 06 November 2018: http://time-price-research-astrofin.blogspot.com/2015/06/spx-vs-north-node-louise-mcwhirters.html
4. Earth and Planets: Earth moving out of the combined influence of Mars and Uranus has often been coincident with market tops and severe declines (some similarities to the CrawfordPerspectives link above on 23 October 2017)
I have an important top on Tuesday August 21, with a sharp decline till August 29.
G3 (Strong) geomagnetic storm conditions occurring today – first time in a long while.
Transition to New Sunspot Cycle May Have Already Begun
“New sunspot AR2720 is not only large, but also strange. Its magnetic polarity is reversed. The North and South ends of its enormous magnetic field are backwards compared to the norm for sunspots in the current solar cycle, decaying Solar Cycle 24. What does this mean? AR2720 may be the first big sunspot of the next solar cycle, Solar Cycle 25, popping up now in the middle of solar minimum. Solar cycles always mix together at their boundaries. The slow transition between Solar Cycle 24 and Solar Cycle 25 appears to be underway.” From SpaceWeather.com
In the post above, John Hampson shows examples of previous “Primary Distribution/ Shake Out/ Second Chance” scenarios, and proposed a current one lasting a total of two years during 2014 and 2015.
Here, I think, is a bigger picture showing a huge such pattern during which the Primary Distribution alone lasted ten years: https://finviz.com/futures_charts.ashx?t=ES&p=m1
Whether SP500 tops at 2916 or 3225, will not seem that important when it has all played out…
A graphic reminder of how different it is this time: http://users.telenet.be/j.janssens/SC24web/SC24.html#AreaAp
The two main influences of speculation and risk-aversion (solar activity and geomagnetic disturbance, respectively), have recently been and will continue to be very different to what we have all previously lived through. The HIGHS in geomagnetic disturbance for SC24 have barely reached the LOWS during all previous cycles since 1933, and are more comparable to the period from 1868 (when the “aa” measure started) to around 1933. The most similar period of all to today was 1905/6.
All new to us, but the sun and earth have previously experienced similar highs and lows in solar activity several times, going back almost 9000 years (Chi Ju Wu et al. April 2018).
Difficult to estimate how we will all react to this, other than look back 100/150 years; but the current state of “populism”, tension, impatience etc looks likely to continue for a couple of years…
Hi Mark,
I have been reading your posts with much interest and wonder where/how I can calculate the long term bradley siderograph. Or at least find more info on it.
Cheers
There’s a very useful chart covering 1852-2040 near the bottom of this webpage: http://www.amanita.at/en/interesting/articles/bradley-siderograph-archive-since-2007
The exact timing and strength of recent and future turns can be found on sites like this one: www(dot)bradleysiderograph(dot)com
I don’t bother to calculate dates myself, as there’s enough information on these sites for my purposes. But software can be purchased at places like www(dot)alphee(dot)com and www(dot)timingsolution(dot)com
Thank you very much Mark. The websites you mentioned had a lot of info.
From Avi Gilburt who’s been very good throughout this long bull market:
At the end of the day, we are left with one uber bullish path left, and there is there is no more room for error. For this to point us to 3225SPX, we must hold 2880SPX. We must then rally through 2980SPX, without breaking back below 2930SPX. Should we be able to thread that needle, then the probabilities remain on the side of 3225SPX being our target in 2019. And, any failure within this pattern places us clearly in the ending diagonal pattern, which will likely complete at the end of 2018 or early 2019, and kick off the start of the 30% correction we are expecting with a strong reversal targeting the 2500-2600SPX region for just the a-wave of wave 4 off the 2009 lows.
Well after about a 2 week bearish turn back in early January, I went bullish equities until now. I exited my commodity longs back then too. But I’m rolling out of non commoditiy based equity longs now and into commodities and equities that deal in commodities
compare this chart to the one I posted back in January

AH, what I like about Avi’s prognostication is the sheer precision, if that’s the right way to put it, of the pathway(s) he’s laid out. In other words, you can determine which path is the correct one (if Avi is correct in his analysis, of course).
What short of pathway(s) are you expecting and what would tell you you’re topping call is incorrect?
AH, does your longer-term count match Avi’s? Here is what he has to say:
“Moreover, the market moved deeper than the 2,770 region I wanted to see hold for a continuation higher, so we must now strongly consider whether wave 3 off the 2009 has completed, and if a 4th wave taking us down toward the 2,100 region has now begun.”
From the NOAA: G1-G2 (Minor-Moderate) geomagnetic storms are likely on October 7th and 8th due to the influence of a positive polarity coronal hole/high speed stream.
Gary’s Year-on-Year margin debt measurement has now suddenly turned negative (see comments above). http://www.finra.org/investors/margin-statistics
Credit spreads have turned up, but have still not reached the 5.5% level I would consider critical.
MACD Histogram for SP500 shows negative divergence.
9-month smoothed moving average (applied to “Typical Price”) is one of the most convincing divisions between major bull and bear market. Eg. it was crossed to the downside November 2000 and January 2008. It is currently at 2660 for SP500, so a monthly close below it will be a very bearish sign.
On 18 July 2018 I commented above that my Solar-V-Lunar timing indicated a positive period between September and 07 December 2018: the in-between dates so far have been perfect, but the direction of the turns have been the opposite. I regard the recent bearishness as an inversion (others will regard it as simply wrong), so I think we’ll see a bounce from around 2660 and very strong positivity from around 07 December – the last up-leg of this bull market, to last until early March 2018.
I agree, Mark. The longer-term indicators are turning indicating a bear market will soon be upon us. But as you say, one last up-leg before a 20-30% correction.
I’m still maintaining a 50:50 stance on whether SP500’s last up-leg will reach significant new highs, or whether it will fail near or below the recent highs.
For several years my comments here have been mostly about how SC24 would materialise as a weak solar cycle compared to the strong ones we have all lived through since the 1930s; and that speculation would therefore peak not at the solar (SSN) max, but rather when ISN broke down from its “plateau”. That breakdown happened during October and November 2017.
Looking at DAX, Nikkei and even the Dow, that argument is still valid. Those highs from around late 2017/ early 2018 have still not been convincingly broken.
Also, the “contrarian” view that there’ll be another big rally to higher highs has become quite common. Contrarianism has never been so popular!
An article on margin debt: https://seekingalpha.com/article/4224403-chart-week-bear-market-warning-light-turns-yellow?isDirectRoadblock=false
By the way, we need to credit AlphaHorn for a timely call turning bearish at the beginning of October – well done.
Lastly, an update from Avi Gilburt whose September call of a trap door should the market break 2880 on the downside (see my post above) proved VERY prescient:
Within the market, I still think we are working our way down to the 2100/2200 region in 2019. However, I don’t think it will be in a straight line. In the coming weeks, I am still expecting more potential whipsaw.
Most specifically, should we hold over 2585/2600 support in the coming week, and then break back out over 2660SPX, the market can develop another rally back over 2800 again before the next decline phase takes hold.
However, should we see a direct breakdown below 2585SPX in the coming week, I am going to expect that any corrective rally will likely remain below 2660SPX. And I would anticipate working our way down to the 2450-2490SPX region before we are able to set up another larger “bounce” back towards the 2800 region or higher.
In regards to Avi’s comment above, we are there, i.e., the 2450-2490 level. A lot of indications a bottom is forming, among them today is a #GannTurnDate and usually creates a meaningful turn in trending markets.
A look back at the Bradley Siderograph for 2018:
Based on my own personal experience using the Bradley Siderograph, I have found the Long Terms to be the most useful of the three elements that combine to create the Bradley Siderograph (i.e., Long Terms, Middle Terms, and Declinations). Sometime the Middle Terms do have a high correlation with the price of a security, but they are obviously more focused on the intermediate term (i.e., relative to the Long Terms, which focus on a longer time horizon).
Overall I would say that right now the Long Terms Turn Date with a Power of 100/100 on August 28, 2018 is proving to be an outstanding Turn Date. This date represented the approximate top in the S&P 500 for this year, which makes sense given that it is one of the “largest turn dates in years.”
https://bradleysiderograph.com/largest-turn-dates-in-years-in-2018/
Mark, are you still looking for an up market through March 2019?
Yes, but I still think there are strong forces acting in opposite directions (a sign of the times generally). May and July look like strong months, but the shorter (29.5 days) of the two I use for Lunar V Solar) has been inverting a lot recently – a sign of a major trend change.
Also, I mentioned a couple of years ago that 3% daily ranges would become common as this secular bull market reached its peak, and that has started to happen.
I’ve noticed lately that behaviour (not just the markets) has become typical of what we’d got used to during the previous strong solar maximums since the early 1930s. This time of course its a solar minimum, so that is a complete inversion too. The type of behaviour I’m referring to includes making major changes/ getting fed up with the status quo etc.
If we see another sizeable rally (I still wouldn’t rule out SP500 exceeding 3000) then it will be the last in our lifetimes. There are some natural forces indicating a very bullish period from 2021 to 2024/5 (eg Gann’s financial timetable, which is just lunar declination; and Bradley strength) but these are also likely to invert I think.
The monthly close of SP500 below 2660 (current value of a 9 period smoothed moving average applied to “typical price”) was the beginning of the end. That MA was also breached during H2 2015, but I said here early January 2016 that that was a buying opportunity. Not so this time, although shorting now is not a low-risk option either.
So overall I anticipate continued rallies with volatility into May (specifically mid May), then a final rally until late July 2019 – but I’m not at all sure about it…
Margin debt now declining year over year: https://www.marketwatch.com/story/weak-hands-may-be-signalling-a-major-market-decline-fund-manager-warns-2019-02-11
Re margin debt, I am sorry to say, this time just seems different. It is dropping like you said, but the markets are not (yet) following. I wonder if this is a lagging indicator or if things have changed because of zero interest rates.
Solar Cycle 24 is not quite over yet; a sizeable CME from big sunspot 2736 is due to reach us at 4Pm (UT) today: https://www.swpc.noaa.gov/products/wsa-enlil-solar-wind-prediction
It’ll be interesting to see what effect this increased geomagnetic disturbance will have, the last surge being back in August 2018.
Hi Mark, don’t you think the may month is going to invert, and June will be very bullish?
Looks like you were/are right. My “mid-May” date (specifically 18 May) for SP500 did invert. So today, 03 June, should now be the start of a bullish phase – probably the last of this secular bull market. But I’m not betting on it myself!
Thanks, I also think it will be a corrective bounce, we have got 8 Hindenburg omen signals at the moment so, The big one down is still in the cards.
Well, we’re not far off from new highs and the advance/decline line is hitting new highs. Someone over at Seeking Alpha had this to say about A/D divergences and the onset of a major secular bear market:
I have a set of the Richard Russel Advance Decline charts going back to 1930. Richard Russel said he couldn’t get enough data to take the charts further back. In every instance before the onset of a major bear market the NYSE A/D line diverged from the Dow and SP500 indexes prior to an index market peak. I thought it had failed to do so in 1937 but there was a very short 4 week divergence where the Dow made a high not confirmed by a new high in the A/D line in February/March 1937.
I found cases where a divergence could last for over two years. One lengthy divergence happened when the A/D line peaked in April 1971 but the Dow peaked in January 1973. That was a one year 9 month A/D line divergence.
Is it now safe to say that this solar cycle theory is debunked? Let’s be scientific about it. We are at the solar minimum. It hasn’t happened.
Its hard to believe how the years have flown by while we’ve been talking about these things here.
Back prior to 2014 I argued that the SSN (Smoothed Sunspot Number) = Stocks Peak theory would not be valid this time, because we were facing the first weak solar cycle in our lifetimes. I thought instead that the peak would occur when ISN (monthly sunspot number) finally broke down towards zero. That breakdown occured Q4 2017, and US stocks made a major high early 2018. SP500 has marginally broken that high twice since. But the Dow hasn’t – not yet anyway.
You produced some excellent charts showing how geomagnetism (usually corresponding to a speculation peak) would peak several years later in a weak solar cycle than in the strong ones we’ve lived through.
I’m still looking at late July as the end of this secular bull market, but I don’t think the natural environment is conducive to a major historic crash either. Instead, I expect a slow-motion arching over into a real bear market – ie. one with plenty of rallies to keep hopes alive, but inexorably sinking lower (both stocks and house prices).
If that is wrong, and stocks do in fact go higher, then I’m afraid we will have hyperinflation on our hands – a loss of faith in government and the current form of money.
Hey Mark! Nice to hear from you again! =)
I would love to hear from John Hampson as well. I am sure he has updated wisdom. His twitter account is at least active, which is good to know he is still active but quiet.
Hampson’s original thesis was that every third solar cycle is a commodity bubble. You can find that in his pdf. So it is 1918 inflation, 1946 inflation, 1980 gold, and perhaps 2014 gold or 2017 Bitcoin. The 2017 Bitcoin would coincide with your Q4 2017 timeframe. So perhaps what we are seeking have come and gone…
Markets still appear frothy. We might get a correction. Or a big one. Or we might not and somehow we inflation on hot air to 2025 solar max. I am open to all possibilites. If we do get a crash in stocks now, I won’t attribute it to SC24 though. It would just be something off-cycle like 2008.
Hi John and Mark,
I had forgotten by John H’s twitter account, so I looked at it this morning. His last post on twitter was in January 2016, 3 1/2 years ago. That’s the same timeframe that the comments on this post on solarcycles.net began. John H had become ill about that time or a little before. I keep hoping he’s made a recovery and he’ll pop back in here, but it hasn’t happened yet 😦
“forgotten about”
So good to hear from you Mark.
I am also looking for a potential ATH in July. The global financial picture has grown increasingly cloudy. The only thing positive is we are on the verge of an election year in the US. They will do everything within their power to goose economy. Didn’t work for Bush. We will see what Trump can accomplish.
Yes, it would be great to have more from John Hampson. Looking again through his post above, I think it is more valid now than when it was written (having argued here during November 2015 that mid-January 2016 would be a good time to buy stocks).
I believe we are in the late stages of a huge wave of inflation. Others were approximately 1180-1310, 1500-1640, 1750-1810, then 1896-(now?). Solar-wise, these were associated with the sun going “retrograde” (its normal trefoil pattern around the solar system barycentre being interrupted due to the relative positions of the outer planets) – 1275, 1632, 1811 and 1990. These retrograde times are also associated with the Grand Solar Minima, another of which we have recently entered.
The characteristics of those previous inflationary waves were:
Early stages:
– inflation becomes regarded as the norm
– response was to create more money
Late stages:
– increasingly wild price swings
– food production dependent on weather (due to increasing population)
– increasing government interference in money
– money moves to where it will be debased least
– export/import controls
– restrictions on moving money
– banks overextended
– taller buildings
– increasing crime
Final stages:
– weather causing food shortages
– widespread/ uncontrolled crime
– disease epidemics
– wars
– removal of powerful people who were growing richer
– foreigners victimised
We are at least in the late stages, and some of the final ones have started (again).
As John says above, a long period of difficulty could be unfolding.
excellent post, Mark! Many thanks. Have a great summer!
Hi Mark, could this be the top of this secular bullmarket?, I have a big turning point on Monday, We are still in Mercury retograde wich can surprise us all.
Also there is an important bradley turn on July 23.
Yes I think the top is forming around now and over the next few weeks. This summer’s major Bradley turn is a long and indeterminate process lasting from mid May to the third week of August, and I think any market top will be similar.
Stocks declines should then build up downwards momentum until late 2020 (nothing to do with the US election). After that, the natural environment gets even more complicated…
Some scientific but practical information on how solar retrograde motion affects out climate/ earthquakes/ volcanic activity etc: https://www.researchgate.net/publication/322134156_INFLUENCE_OF_SOLAR_RETROGRADE_MOTION_ON_TERRESTRIAL_PROCESSES
More detail on the timing of the forthcoming “cold” spell (2020 to 2055):
https://tallbloke.wordpress.com/2019/06/25/zharkova-uses-solar-planetary-theory-in-new-paper-predicting-earth-temperature-rise-to-2600-following-imminent-grand-solar-minimum/
More detail on the timing of the forthcoming “cold” spell (2020 to 2055)
https://tallbloke.wordpress.com/2019/06/25/zharkova-uses-solar-planetary-theory-in-new-paper-predicting-earth-temperature-rise-to-2600-following-imminent-grand-solar-minimum/
https://www.zerohedge.com/news/2019-07-29/major-solar-storm-strike-earth-week-black-supermoon-looms
Hi Mark, What I can see is we are at the top of the second wave, the bradley will turn down tomorrow till Okt 7.I sold my house for a very good price and we are in a rental right now.I hope to buy a cheap house somewhere in mid 2021.
The last bull run is ending by the end of November what are your thoughts Mark?
I am not following. Nov 2018 or Nov 2019?
I meant november 2019, friday okt 18 should be an important turn and next week will drop like a rock, november we will rise again till 21-25 after that the bearmarket will resume… let’s see if this comes true..
04 February: “… a final rally until late July 2019…”
03 June: “…today, 03 June, should now be the start of a bullish phase – probably the last of this secular bull market.”
That timing projection still stands, although I would have liked to see SP500 around 3225. I’ve no real financial interest in the main stock markets now, as I don’t think betting on them either way has a good risk:reward ratio.
Some commodities look more promising. Gold wants to head for $2300: https://www.mql5.com/en/charts/10808842/xauusd-w1-ig-group-limited?bind=1
The final stage of the c120-year inflationary wave I mentioned above is starting; we just need to see the “weather causing food shortages” soon. I suspect that will start during 2020 after a cold and late Northern Hemisphere winter leads into a relatively cold Southern one…
Mark, this statement: “The final stage of the c120-year inflationary wave I mentioned above is starting;” is certainly counterintuitive, what with interest rates at historical lows and deflation talk all the rage (as it has been for several years now with data to back it up, e.g., technology-induced overcapacity, price indexes at lows and CBs not being able to hit their inflation targets, etc.).
How do you reconcile this?
In my estimation, people have completely misunderstood the effect of QE programs on inflation. That said, if the U.S.actually begins printing money (as opposed to engaging in, effectively, a securities swap) and the ECB truly adopts a dual interest rate police (see Eric Lonergan for more on this), that might jump start inflation.
I remember briefly mentioning here at one point that we would see both deflation and inflation at the same time; when I scrolled up that was way back on 23 April 2017!
There has been “deflation” (ie. steady prices) in food for example; but many other costs have been increasing rapidly – I recently had to pay €200 for 20 minutes of surveying work; £220 for 20 minutes in the dentist’s chair; £185 for electronics that cost £35 less than ten years ago; £10000 for a not particularly unusual 1960’s motorbike; and of course a new tax every time the authorities need a few more bob. For me in the EU and UK, many costs are spiraling upwards. In the US, CPI is 9.4% (calculated by John Williams the old-fashioned way). Some countries have annual inflation rates in the thousands of percent.
I think the very meaning of money and its value is starting to be questioned – the sense of “worth” is being lost, and a sense of “entitlement” is taking over. This could be the cause of the extreme volatility I see coming especially between 2021 and 2027.
Looking backwards:
For many years I argued here that the stocks speculation peak would not be at the SSN peak, but that during this first-in-a-lifetime weak solar cycle it would be at the ISN final breakdown; and that that would be either July or November 2017. It turned out to be late 2017, and several important stock markets (eg DAX, Nikkei) did peak then (well, January 2018 to be precise). A couple of us here then anticipated that US stocks could temporarily go marginally higher, and SP500 has since climbed 5% higher during Q3 2019, although only 1% for the Dow.
Now:
Previous solar minima following weak cycles have usually been excellent times to buy stocks, but that was because solar minima are typically times of crisis (see JH’s comment above). This cycle, so far, we haven’t had such a crisis. But this solar minimum is not over yet – the timeframe is very wide, from Q3 2019 to Q4 2021. I estimate the most likely time is December 2019/January 2020.
Looking forward:
I think the most likely course for stocks is a slow but volatile arching over until at least mid 2020, and possibly November 2020 (not because of the US election). If the decline is large enough by then, it would typically be a good buying point – but so many things are inverting that I am expecting the usual bull market into Major Lunar Standstill (2025) and relative Bradley strength (2027) to be somewhat of an inversion (ie. a proper secular bear with large falls and recoveries in an overall downwards trend).
If however, we see stocks indices continuing to rise after January 2020, and especially after 2021 towards 2025/7, then I think we will be witnessing a loss in faith in government/Central Bank money with hyperinflation. Money moving to where it is likely to be debased least, typical of the final stages of previous inflationary waves and bringing a final conclusion to the current one.
Mark,can you explain this, we still have a healthy A/D line, if you look at 1929,1987 and now?
I can not explain this, if we look at the US with all there repo interventions?
Thanks in advance..
John.
For a few years I have been remarking how everything (from political attitudes to market values etc) is becoming more polarized, including these market indicators. Its not that they’re mixed; more that they’ve formed into two diametrically opposed positions.
Perhaps one answer lies in Tom McClellan’s remark “…no-one knew about it…”. Nowadays I think all these standard market indicators are already priced-in, and therefore not very effective. For example, JH mentioned around four years ago that he could list a hundred or more indicators all showing that stocks were topping, but it didn’t work out that way.
On the other hand, maybe the healthy A-D line is simply showing that US stock markets are far from running out of steam. P/E values while high are not in bubble territory: https://www.wsj.com/market-data/stocks/peyields
SP500 P/E would need to double to around 50 to compare with previous bubbles. If SP500 reaches around 3225 relatively soon then I’d feel more confident in moving away from my 50:50 position.
Mark, if the CB banks all go to negative interest rates and QE, also in the US, would that not lead to asset inflation and a much bigger bubble (SP500 at 5000)?
John -yes, but I think there’ll be an increasing divide between CBs official interest rates and those charged on ordinary people’s bank accounts. It will not be possible to impose negative interest rates on ordinary people while cash still exists – ie. if you were charged interest on money held in a bank, then you would simply withdraw it as it would be cheaper to hold banknotes.
So I would not be surprised if negative rates are confined solely to government borrowing (with a few minor exceptions). We are probably in the early stages of a lengthy period when the value and very essence of money will be increasingly called into question (eg. being paid to borrow doesn’t make sense, and governments doing it is essentially just artificially creating money for themselves).
I don’t know how all that will work out, but in the meantime I think we’ll soon see the narrative that “CBs and governments will simply never let stock markets decline” become universally compelling – and that will be the top of this secular bull market.
Thanks Mark, my turning point is tomorrow till end of the month after that recovery till november 21/25 so let’s see…
I use Tom DeMark’s work and it suggests, like John, we are at a turning point here (down), the depth of which is difficult to say. That said, a professional investor who I respect recently wrote:
The point is when the market is unable to decline in the face of negative news, it’s usually indicative of significant underlying buying pressure. We see this in the relatively healthy underlying technical breadth of the stock market as measured by the NYSE Advance/Decline Line. It would be unprecedented for the market to embark on a serious decline in the absence of more signs of technical weakness from this indicator.
“So I would not be surprised if negative rates are confined solely to government borrowing (with a few minor exceptions).”
Mark, this is possibly already happening…or at least in its earliest stages. Eric Lonergan writes about the changes Draghi made to ECB interest rate policy before exiting – https://www.philosophyofmoney.net/draghis-historic-farewell/
Very few seem to be paying attention to this but it was at least coincidental that global rates bottomed upon Draghi’s announcement (give or take a few days). For those interested, I’d also seek out a Bloomberg interview of Eric where he explains all this.
It seems then that some Central Banks are widening out a spread between their lending and borrowing rates (“dual rates”), but of course in the opposite direction to commercial rates – so they are guaranteed to make a loss. The beneficiaries will be those with whom the CBs do business – governments and commercial banks.
So the more a government borrows, the more it is paid to do so by its Central Bank… Sounds like an irresistible offer to me!
Mark, amazingly we are at your much forecasted 3225 level with few signs of the market stopping here. Any thoughts?
Yeah, how much greed can the market take on?,,, the fear&greed index reached 92… on last friday, That was the highest ever someone told me.How long can the fed keep printing money and pump up this market?.Maybe this solstice or the eclipse december 26 will turn this market down.
Since 2009, the US markets have been moving in Fibonacci proportions which indicate a natural high around 3225, but I have nothing to estimate how big the overshoot will be. Weekly and monthly timeframes certainly have the look of a market about to launch into its final vertical bubble phase; but that is based on studying previous bubbles, and that approach has been wrong in recent years as everyone can see what should be coming.
The chart of the last twenty years is broadly reminiscent of 1905-1927 (roughly), which would mean SP500 at 4500 in a few years’ time before a huge crash; but I don’t anticipate that happening.
As JH mentions above, the solar minimum typically marks a crisis. I’ve also mentioned how past crisis lows have been the best times of all to buy stocks. But we haven’t had a major crisis yet as the solar minimum scrapes along its bottom. However I continue to believe that that minimum will most likely be December 2019/ January 2020 (but could possibly extend right into 2021..!). I also continue to believe that we have entered an extended period where many things will invert – so if this solar min. marks a high peak, then we’ll see a very volatile, negative and chaotic period until at least 2026/7 with a true bear market in US (and similar western) stocks.
I have been interested in this DAX forecast over the past several years due to its close similarity to my own solar-timing projections: https://time-price-research-astrofin.blogspot.com/2017/01/dax-vs-iris-treppners-astro-forecast.html
It has been fantastically accurate, and is now at another critical turning point. If German stocks continue to rise significantly to new highs then we will be seeing the effects of money-creation (fear of holding money in the banks or in cash) rather than economic promise (investing in future prosperity).
The EU is about to lose one of its 28 member states – not a big deal on the face of it – but it will be losing its second biggest economy; one-seventh of its population; around one-fifth of its economic activity; almost one-quarter of its income… Perhaps that’s one reason why the US has been doing so well?
Thanks Mark, It’s amazing how this bull keeps on running, fear/greed at 96 by now..I m curious if the chart ( Iris Treppner) will be right and we will witness a sell off this month?.Dumb money is very high and smart money is low at the moment.
Yes, there are many measures by which stocks should sell off, but it was like that during January 2016 too. I think these are mostly already priced-in to the markets nowadays.
I’m still just 50:50 on whether SP500 is forming a lengthy topping process, or whether it is about to finally go euphoric. Commenters here and elsewhere have for several years been continually astounded that stock markets can be so high against all these measures, but P/E ratios could still double to 50 or 60 before we get to previous bubble levels. I would roughly estimate that could take SP500 to around 4500, but haven’t looked at it very closely and have little interest on betting on it (either direction).
Current SC25 sunspot 12755 has been relatively sustained, so that could indicate that the sunspot cycle is close to turning up. Two previous modest surges were the third week of March and all of May 2019 – both coincided with market negativity.
A relatively minor change in sentiment is due mid January and then again mid March, but the BIG ONE is mid August 2020 – the end of the topping process (or bubble).
We don’t just have uncertainty in the world at the moment – everything is increasingly becoming more opposed. One important example is something we mentioned before: interest rates. Governments desperately need very low (preferably negative) rates, but our ageing populations need higher rates (pension funds). There is no conceivable way to reach a balance or compromise under current arrangements, so something completely new will have to emerge in the way we treat the future value of money. Humans hate change, but then quickly adapt to it.
Neues kommpt, gutes bleibt…
Thanks Mark, the bradley geo and helio are having turningpoints on Jan 15 and Jan 20… after that April 24…
So far so good,Irish Treppner could be right from here and the market is making a low this summer.If the fed is not able to control the repomarket,intrest rates will rise and the stockmarket goes down..
So what’s next Mark, Irish Treppner is right again, the bradley geo had a move from Feb 17 till March 2., after that up into March 17.So a could bounce is in the cards this week?
From vedic astrology this is interesting.
Rajacar
@TimeandCycles
·
28 feb.
The 3 largest Crash waves in History had Mars opposite Rahu, the Moon’s North Node: 10/29, 10/87 and 9/01!! More recently Ma op Ra was on 09/25/2018 => 9/21/18 major High, crash into 12/26/18L and Ma op Ra was on 2/25/20 => 2/19/20H, crash ongoing.. https://timeandcycles.blogspot.com
We finally have our crash. No one is posting and JH is still absent.
I’ve argued here before that betting against the lunar declination cycle (Gann’s Financial Timetable) is unnecessarily risky: 2020=PANIC
Now we have a self-induced panic – the death rate in the worst hit country, Italy, from coronavirus this flu season is much the same as flu deaths from previous years:
https://www.sciencedirect.com/science/article/pii/S1201971219303285#bib0075
There’s no reasoning with the herd when its stampeding.
This is the first of a series of panics during which the world will be flooded with free electronic money…
Hi Mark, Appreciate your input. I do have a semantic problem with the way you are interpreting that article. Excess deaths is a demographic term; it is not the same as directly reported flu deaths. According to today’s NY Times, (https://www.nytimes.com/2020/03/19/world/coronavirus-update-cases.html) there have been 3,405 deaths directly due to flu in Italy since the outbreak began. This is more than the total deaths in China.
While I agree there is a panic component to this epidemic, this pandemic is the real deal and quite a bit more deadly than the seasonal flu.
Jim Foley
Thanks Jim, I wondered what exactly was meant by the term “excess deaths”, but couldn’t find a definition. I also wondered why medical experts would have to use statistical analysis to estimate the number of deaths, rather than just add them up, but with most flu victims having pre-existing illness (92% according to WHO) perhaps each cause of death is recorded as that pre-existing illness rather than influenza itself.
As pimacanyon points out, its impossible to know exactly how many people contract flu each year. But I don’t see any evidence that the number of excess deaths in that study would be significantly different to directly reported flu deaths. I don’t know much about it though, so could be completely missing something…
Looking at the timing and extent of previous flu epidemics and pandemics (there have been plenty of them) and the current state of blind panic (as I see it!), it seems to me that this current one is now peaking in Italy, so I expect to see more good news emerging soon but very slowly at first. If I’m right, then there’ll likely be a tremendous surge of confidence that humans and our technology have conquered nature. The much bigger problem would then be if this virus returns in a mutated form next flu season, as in 1918.
This looks like an opportunity for speculative longs to get in on a final buble phase in US stocks – even if no new high is made, its still a long way up to challenge the recent one. Also, buying at crises during solar minimums has historically been very profitable.
I totally agree with you Mark about a major buying opportunity coming soon. While the preponderance of informed opinion says 4 to 5 months for a bottom to be in, my gut says otherwise. I am thinking weeks or days not months. If you look at a chart of the market in 1917-18, it sold off quickly but bottomed in December 1917 long before the peak of flu-related deaths occurred in 1918. I think the rebound began when people started to realize that things weren’t quite as bad as they feared at first. The steepness of the curve in this sell-off is also much greater than 1917-18 or virtually any other crash in history. The closest analog is 1987. Then the market bottomed quickly, oscillated a little bit and took off higher. Both 1987 and today are sudden panic crashes in an otherwise positive economic environment. The fact that China and So. Korea got a handle so quickly on this epidemic also augurs well.
If this general supposition is right, better things may start to happen soon.
Jim
At this point, death rate of this new virus is a guess, but Fauci, whose career is in this area, believes it could be 1 to 2 percent. Seasonl flu is 0.1 percent. So if Fauci turns out to be correct, covid-19 virus is 10 to 20 times more lethal than seasonal flu. The reason it’s difficult to get an accurate death rate is we don’t know how many have had this virus whose symptoms were mild enough (or nonexistent) that their cases aren’t being counted. If you look at seasonal flu and calculate the death rate based on number of hospitalized cases, you get a death rate of 8 percent! But of course we know that’s not correct because there are many more people who get the flu and don’t end up in the hospital. In fact, many don’t even go a doctor. So even with seasonal flu, the death rate is somewhat of a guess because we don’t have absolutely accurate numbers on how many actual cases we had. But if covid-19 is 10 to 20 times more lethal than seasonal flu, and if we just let it run its course and didn’t do anything in the way of trying to slow down the spread of the virus, hospitals, clinics, and doctor’s offices would be overwhelmed. It’s true that what we’re doing is having a devastating effect on the economy, but what other choice do we have? Damned if you do, damned if you don’t!
I haven’t commented before, but recently ran across this site and read these comments with interest. I found this site because I’ve been wondering if the 11 year bull market in stocks is finally finished.
Based on lunar cycles, the current market action appears similar to April 1930 where there was a lunar eclipse on April 13, followed by a solar eclipse on April 28. The rebound high from the 1929 crash occurred 3 or 4 days after the lunar eclipse (April 16 or 17 – one day was the closing high and the other the intraday high). The action around this year’s lunar eclipse was similar, with the eclipse on June 5 followed by a high June 8.
Does anyone here have an opinion as to whether last week’s high may be a significant high? Mark or anyone else?
That high was at 3225 for SP500, so I believe the secular stocks bull market is over. We are also in the process of what I regard as a long and indistinct major Bradley turn – lasting from mid-May until mid August (centered around now).
So for the time being, I would personally not want to be either long or short SP500.
The recent pattern from June 8 looks a lot like the pattern from the April 2, 2012 high at 1422. In 2012, absent any more Fed intervention, I thought 1422 was a candidate for the end of the bull market based on 666-1044-1422. The 3225 looks similar and if the market does the same as it did from April 2, 2012 to May 1, 2012 on a daily basis it may have a couple days left to the secondary top, and the Fed may be out of juice this time. However, the reason this came to mind is on Friday the intraday action reminded me of the intraday action of May 1, 2012. Though the intraday high on Friday came earlier in the session. So my guess is the secondary high may have been Friday and I started a small short around 3145 SPX after it reversed. Probably wrong, but starting there.
Hi Mark, are we in for a turn down now in the markets and how long will we go down? Thanks John.
I’d like to know the answer to that myself John!
It was easier trying to pick a bottom on 23 March than picking a top now. I still think there’ll be a prolonged, messy, awkward topping process with early November 2020 being the next very big change in sentiment after the current one. The possibility of a final bubble phase still exists, but confined to some markets like biotech and technology.
Many things continue to be diametrically opposed; including of course human opinions. Even this influenza virus had everyone divided, and I think this division will continue until 2024/5/6 with a series of crises.
Back in 2017 I mentioned the closest comparable time was 1886, both lunar-wise (declination cycle) and solar-wise (first weak solar cycle after a series of strong ones). So we are now in a very similar position to late 1889. Back then, stock prices continued higher into 1890 before a panic caused lower prices into mid-1893, with an eventual extreme low Q3 1896.
So that would indicate a possibility of higher stocks into 2021, with another panic marking to ultimate top before a major bottom late 2024, and an eventual lower low around late 2027/ early 2028…
I also mentioned here several years ago that we would see the ordinary people of the world forced to engage in a battle with those they elected to serve them…
ChrisCarolan believes that to be the case. I also think this is the time for a high but am open to the idea that the next full moon ushers in the top for the marquee indices, secondary top for other indices.
Your mentioning Chris reminded me to check the 58 year cycles from 1942 to 2000 and 1962 to 2020. There were lows on April 28, 1942 and June 26, 1962. 58 years less 14 days from April 28, 1942 was the April 14, 2000 springtime panic, 4 days before the full moon. This cycle from 1942 to 2000 was noted by Chris years ago. I think the ideal 58 year cycle is 58 years less 10 days. 58 years less 10 days from June 26, 1962 would be in the current time frame. Seems to me if the selling panic were to occur on this 58 year cycle it would have already happened over the past month but maybe it morphed into a buying panic.
Maybe the top of this rebound since March is in, but it might take the passage of the second lunar eclipse in early July for the real downside to get going. At least, that’s what happened when the South Sea Bubble broke 300 years ago in 1720. Like 2020, there was a lunar eclipse, followed by a solar eclipse 2 weeks later, then another lunar eclipse 2 weeks after the solar. That’s not the usual sequence, but it happens every so often; I remember one in 2011. The South Sea Bubble peaked a few days before the first lunar, went down some as the eclipses passed, then accelerated down after the passage of the second lunar eclipse.
I think there is sufficient evidence to conclude the top is not likely in so next full moon lunar eclipse is front and centre on my radar. And I think we can rally quite hard into that time period.
SC25 has officially begun. 2008 crash was solar minimum. We now have 2 datapoints against crashes happening at solar max (the original thesis of JH’s post)
Interesting article on ElectroVerse that suggests SC25 has not started yet. https://electroverse.net/why-a-strong-solar-cycle-25-still-spells-disaster/
The thought of an unexpectedly strong SC25 is particularly interesting.
NASA are now announcing that SC25 has begun, with the minimum having occurred back in December 2019: https://tallbloke.wordpress.com/2020/09/17/solar-cycle-25-is-here-says-nasa/
They have a seven month delay due to their smoothing process.
I mentioned on 17 October and 23 December 2019 above that December 2019/January 2020 was the most likely solar minimum, but that it could conceivably extend as far as Q4 2021. The exact timing of the official minimum is of limited use anyway, as it will occur somewhere during several years of virtually no sunspot activity…
With regard to levels on the SPX.
666 – 2009 low
1422 – 2012 high that held for several months
2134 – 2015 high that held for several months
2872 – 2018 high that held for several months
3588 – recent high
Looking at these levels, these were strong support and resistance every 700 points up: 700-1400-2100-2800-3500, deviating from these levels mostly by fib numbers:
700 – fib 34 = 666 (exact to 666)
1400 + fib 21 = 1421 (one point from 1422)
2100 + fib 34 = 2134 (exact to 2134)
2800 is the one exception where the high did not deviate very near a fib number from 2800
3500 + fib 89 = 3589 (one point from 3588)
If the market rallies into next year, is it possible that it could get all the way to 4200 or so?
I’m noting this pullback is to the key 3225 area and seems to be finding support here.
Today could be the top of the “second chance” rally John mentioned so often and shows at the top of the post above for 1929.
Almost Clark, one day later if the synchronisity with 1929 is correct we will see a panic decline into okt 28….Mercury is retograde till november 3…. so let’s throw the dice..
John, an alternative to a panic decline into October 28 could be that the crash starts today (October 26) and ends around November 12, 91 years less one day from the 1929 low and a couple days before the new moon, as that was also the lunar pattern of the 1929 crash, although that new moon was also an eclipse (November 1, 1929). The past couple weeks may have been some meandering before the big event.
Hi Clark, I think you could be right about that, It’s either a low at the end of mercury retograde cycle november 3 or november 10/11 that’s where I see an important astro turn.Thanks for your thoughts..
Mark do you have any suggestions ?
I haven’t been looking closely at short term market timing recently, but have kept an eye on my longer term indicators. Regarding the coming couple of months; solar and Bradley strength indicate a major bottom in sentiment, but I’ve also commented on how we’ve entered a period of general inversion.
So it looks like US stocks have been forming a top rather than a bottom, but I’m still just 50:50 as to whether they can subsequently go higher still. I don’t see a lot of excess enthusiasm for the stock markets, and that’s not indicative of a major top. If there is a final manic phase and P/E ratios reach previous bubble highs, that would put SP500 up around 4500 (a rough estimate).
My 2017Q2 = 1886Q3 comparison is still holding. IE., the interaction of a weak (after a series of strong ones) solar cycle (SC12) and lunar declination cycle puts us now under the same natural influence as 1890Q2. I had thought that the unusually long 3.3 year minimum between SC12 and SC13 would upset this comparison, but lo and behold we have just had a similar one.
This would put the ultimate market top at March 2021 (=June 1890), but then a 25/30% drop over 6 months (keeping the lunar declination cycle intact) before a strong but volatile recovery to late 2022, then an extremely bearish phase until at least mid 2024 during which stocks would lose half their value. The ultimate bottom in August 1896 equates to May 2027.
Also, oil’s 9.3 year lead (half a lunar declination cycle) is in general agreement.
So solar and lunar, and the interaction of the two, all match exactly. One thing is different though: 1895 marked the start of the now-fading inflationary wave…
Thanks Mark, for now I m looking at november 10/11,Mercury retograde will end november 3.
(Mehr) neues kommt…
Early-cycle sunspots normally appear at mid/high latitudes, migrating closer to the equator as each solar cycle progresses to its maximum.
This is one of the first big sunspot groups of the new SC25:
Surprisingly similar latitude to the monthly sunspot peak of SC23 max:
Hi All,
Wondering if anyone is seeing the possibility of a top in the next few weeks. I started building a short today based on the upcoming eclipses, a fibonacci turn sequence from 1932-1966-1987-2000 being 89-55-34-21 years back, the length of the long bull market from 1932 to 1966 being nearly matched from the 1987 crash low to date, and the usual canaries like margin debt, recent hedge fund troubles, etc. Maybe this crazy bull is close to being finished? I think a reasonable end point from a solar/lunar standpoint could be April 11 or so in this odd year.
Clark, I agree with you, but the problem for me has always been the timing. Do we top now, just as SPX hits 4000, on the bullish news from the Jobs Report? Or do we continue higher and top later this month or even some time in May? (Sell in May and go away?) I have been concerned about a big drop for a while now and as a result I’ve missed out on some of this rally. Frustrating time to be in the markets in my opinion. Good luck to you
Greg, Despite many well reasoned arguments made by the owner of this site years ago that still seem to apply, the market has continued to defy. Years ago, I asked myself whether reason would prevail or whether so many who appeared to be so right about what they were saying would be proven wrong by the market just because that’s what markets do. And I thought reason (demographic fundamentals, etc.) might prevail just this one time, but it didn’t. At this point, I’d be happen to catch this top within 3 months and 400 points in the S&P. That difference may look small on a log chart 10 years from now.
I think we are close now for a major sell off, I hope to see a bottom May 26 and after that up again June 3 or 10?….All the best.
thanks John! I’m thinking the same. But I’m thinking the big move down may not start until early to mid June. (I still wonder what’s it gonna take to turn sentiment negative enough that traders/investors start selling instead of buying?) I’ve been “expecting a top” since last summer! I am mostly on the sidelines now. If we get to mid-June and we haven’t started a move down, I will reassess and try to put funds at work even if that means cautiously going long on some higher dividend stocks/etf’s (e.g. covered calls).
Hi Greg, My best guess what will be the trigger?, Trump wil show the public the fraud of the election in Arizona etc…He will become president again.Biden will be unmasked because this is not the original Biden.It’s a clone or they use CGI..
For what it’s worth, I don’t see the major trend ending soon. The first possible inflection point is September but I suspect the ultimate top will not occur before December 2021.
Anybody think that the current Daily SP500 chart for 2021 so far looks almost identical to the Nikkei 1990 chart posted by JH above..? Just before the crash.
Hi Mark, it sure looks like it, let’s wait and see..
These historical “analogs” always look convincing, but I’ve never seen one come true after it was published.
The natural background (eg relative Bradley strength) is extremely positive for speculation until 2027; yet everything continues to invert, and everyone continues to polarize. Many have become convinced they can control markets, that they can maintain a steady climate and temperatures, that they can eliminate viruses etc…
Starting 2024 we have a Major Lunar Standstill coinciding with a weak Solar Cycle maximum for the first time in over a hundred years. Geomagnetic disturbance will remain low until the solar max has passed, but then increase noticeably during the late 2020s.
So I believe an historic record-breaking crash is much more likely from 2027 onwards. In the meantime either a prolonged tug-of-war with stock markets trying to make new highs (but usually failing), or hyperinflation, with the latter becoming increasingly likely as time goes on.
The Panic of 2020 didn’t last long in the stock markets; the crash low at a Solar Minimum did turn out in fact to be an excellent time to buy, as it was in most previous occasions.
The general health panic is fading much more slowly, with plenty of data-blind “I’ll die if I get this” persons still keen to stop living in order to avoid what has been just a normal background chance of dying. Figures published by the UK government at the Office for National Statistics show the total deaths (all causes) in England and Wales last year at 561529 – that’s the sixth highest death toll in the last 31 years, and right on the 1990s average.
Here’s the June 2020 SARS-CoV-2 Technical Briefing from Public Health England:
Click to access Variants_of_Concern_VOC_Technical_Briefing_16.pdf
Table 4 (about the dreaded Delta Variant) is especially interesting. Since 01 February, a couple of thousand people in England required a visit to Accident & Emergency, and 73 (really 71) died “within 28 days of a positive test” of the dreaded Delta Variant. England’s population is around 56 million.
Even more interesting is that 34 of those dead were unvaccinated, and 37 vaccinated.
Even even more interesting again, is that (bearing in mind that the sample size here is very small, because the number suffering is very small) a fully vaccinated person was 26 times more likely to die than one who has recently received a first dose.
Could it be that these vaccines are messing up peoples’ natural immune systems..? …
Could it be that these vaccines are messing up peoples’ natural immune systems..? …
Looks like it:
https://rumble.com/viwq25-the-truth-about-covid-19-lockdowns-and-mrna-vaccines-steve-deace-show.html
Another attempt to link to the Public Health England Technical Briefing:
Click to access Variants_of_Concern_VOC_Technical_Briefing_16.pdf
The link to the Public Health England Technical Briefing does not want to copy, but is easy to find with a search.
I was looking at Briefing 16, and I see no. 17 is now published where the figures are even worse.
For example (Table 4), 44 unvaccinated people have died with the Delta Variant (out of 53822 “cases” = 0.08%). And 50 fully vaccinated have died (out of 7235 “cases = 0.69%).
So statistically, according to the authorities in England, a fully vaccinated person is 8.6 times more likely to die with Covid Delta Variant than an unvaccinated one.
The story of this “pandemic” has been all about the vaccines from the get-go. Virology Journal in 2005 reported that HCQ was effective at stopping SARS. So it makes sense that when covid hit, doctors who read the journals would try HCQ. They did and started doing small trials. The trials looked promising, however, the corrupt CDC, FDA, NIH, and WHO were against HCQ from the beginning. Why? Because it worked if applied early. So they did everything they could to suppress all effective treatment protocols for covid because the FDA is prohibited from issuing an EUA for a new vaccine if there is an effective treatment for the disease.
Big Pharma knew this, FDA knew this, so they worked together, with the useful idiots at the media and the bought-off politicians, to suppress effective treatment. The medical journal The Lancet published a FAKE paper in May 2020 (unprecedented) that was based on FAKE non-existent data that concluded HCQ was dangerous! (It’s actually one of the safest drugs around, been used for 65 years, and is safer than aspirin or tylenol). After the FAKE paper in The Lancet, the media went crazy, telling everyone HCQ is dangerous. But some researchers thought the data in the FAKE paper looked suspicious, so they requested to see the dataset from the company that provided it (Surgisphere). The company refused to release the data, so The Lancet issued a retraction and an apology in July (also unprecedented). But the damage had been done. The drug Ivermectin also works against covid, but it’s gotten the same treatment as HCQ from the corrupt bureaucrats and politicians. These people who have suppressed effective treatments for covid are guilty of MURDER and should be prosecuted. They are responsible for the deaths of millions. It’s the crime of the century.
I agree on this a 100%, but the scarry part is that those vaccins will damage your immune system and the this fall when the flu season enters all those people that took the jab will get sick.They and these corona gangsters will blame the people that dit not take the jab for spreading the new corona variants.I m no doomsayer just warning do your own research
pimaCanyon and John, You might have already seen the first video here:
https://www.armstrongeconomics.com/world-news/tyranny/prof-sucharit-bhakdi-why-do-not-get-vaccinated-or-booster/
In this great information age its hard to know what information is true and what’s not, but what this well-known Professor says has already been coming true; also Wikipedia claims he has been spreading misinformation, which of course strengthens his credibility.
At the SIGCOMM 2021 data communication conference on Thursday, Sangeetha Abdu Jyothi of the University of California, Irvine presented “Solar Superstorms: Planning for an Internet Apocalypse,” an examination of the damage a fast-moving cloud of magnetized solar particles could cause the global internet. Abdu Jyothi’s research points out an additional nuance to a blackout-causing solar storm: the scenario where even if power returns in hours or days, mass internet outages persist.
Click to access sigcomm21-cme.pdf
An interesting and thorough article Gary.
Potential solar storm damage is usually estimated by reference to the Carrington event, but there were solar storms in 994AD, 775AD and 660BC which were ten to twenty times more powerful:
https://www.nature.com/articles/ncomms9611
How much will digital money be worth after the next one..?
“In short, something much more devastating may be seeded in these themes and a long period of difficulty for the world could indeed be unfolding” (JH)
I think the earliest that period of difficulty could end is 2025, but quite possibly 2027.
In England (Public Health England Technical Briefing 22, Table 5), now only 22% of Delta Variant deaths are amongst the unvaccinated. Worse still, the percentage increase in total Delta deaths over the past two weeks was 51%, with a 37% increase amongst the unvaccinated and 61% for the fully vaccinated. I had thought the purpose of a vaccine was to reduce the chances of dying from a disease. Another chance to use my favourite english word: iatrogenic.
The solution to all this in most countries? A) now get your children vaccinated; B) prepare yourself for another shot…
We are on the cusp of the worst public health catastrophe in history. The alternative, which I still believe and hope is more likely, is that nature will win and this particular virus will continue to do what viruses do – continue to mutate to become gradually more infectious and less harmful, so we can all get it and not even notice.
Who could have known that these vaccines would not protect against death?
Pfizer and the US FDA knew, at least as far back as 1 December 2020:
https://www.fda.gov/media/144245/download
Table 11 shows that one person out of 17411 in the fully vaccinated group, and three in the Placebo group of 17511 people developed SEVERE COVID. Pfizer’s “Predefined Success Criterion” was “…that true vaccine efficacy > 30%…”. A surprisingly modest target!
The final column in that table asks if that Success Criterion was met? Pfizer’s answer: No.
Also surprising, is that they define minor symptoms like sore throat as “Primary Efficacy Endpoints”, but severe symptoms as “Secondary Efficacy Endpoints”. Strange priorities.
The United Kingdom continues to make headlines as one of the world’s worst Covid hotspots; and Northern Ireland as one of the UK’s worst regions.
NI’s official 2020 death toll was 17613 deaths (all causes mortality). That was the 55th worst year out of the 134 years on their official record:
https://www.nisra.gov.uk/publications/death-statistics
Their worst year was 1892 (26044 deaths), and best year 2011 (14204 deaths), and there has been a clear upward trend over the last ten years. The worst years tend to be longer ago (no doubt due to improving heathcare), but more people died in 1973 for example, than 2020.
What will humankind do when something comes along which kills unusually high numbers of people? Plead to be put under another 223 days of house arrest? Inject everyone with largely ineffective investigational vaccines?
At least one thing is starting to become a little clearer: a timeline indicating some series of world-changing events during 2025, 2026 and 2027. Seems a long way away though…
https://www.indiatoday.in/science/story/geomagnetic-storm-coronal-mass-ejection-solar-flare-sun-storm-1870952-2021-10-29
Abomination no.1:
https://openvaers.com/covid-data
Abomination no.2:
https://www.iltempo.it/attualita/2021/10/21/news/rapporto-iss-morti-covid-malattie-patologie-come-influenza-pandemia-disastro-mortalita-bechis-29134543/
Italy’s Higher Institute of Health reduces the number of “Covid deaths” from 130468 to 3783.
Some science; from the Canadian Covid Care Alliance:
https://rumble.com/vqx3kb-the-pfizer-inoculations-do-more-harm-than-good.html
It’s been quiet for a longtime here, I think the stockmarket will top first days of June, let’s see what happens.
Early to mid-2020’s: time for another change in climate and a “new decentralizing trend in government”…
https://time-price-research-astrofin.blogspot.com/2015/06/raymond-h-wheelers-100-year-cycle-of.html
Hi John,
Long time since this last post – I hope you are well in the meantime.
I was an avid reader of your site back when you were posting regularly, and revisiting this I’m just looking at the quarterly chart of the FTSE World Index: https://www.tradingview.com/x/3RcnLWP2/
Personally speaking, I managed to miss the greatest bull market in history, looking for the whole thing to collapse in one way or another since 2010.
Hilarious really, I guess I can put it down to ego – trying to be smarter than the dumb money, when the majority have made out like bandits by just buying the (U.S.) indices these past 15 years.
Anyway FWIW my trading style is more about simple trend-following strategies on shorter timeframes today.
Kudos to you for leaving all your content up after all this time. It would be great to read an update sometime.
Best regards
Historic times, in my eyes the beginning and battle between light and darkness. Do we see an important turning point in early November this year with a panic drop, that can last for a few weeks?
This post by John Hampson is now nine years old, and I believe now more relevant than when it was written.
January 2019 was the ISN drop-off I said would mark the effective peak of weak Solar Cycle 24 (the first weak one any of us have lived through).
I also anticipated that 2025 and 2028 would be the pivotal years in a decade typified by ordinary people fighting (literally) against their elected representatives. We will have SC25 peaking this year at the same time as a Major Lunar Standstill; another new experience for us.
And the extremes formed by the strength of Bradley Turns will reach a peak during 2028 which will exceed the previous extreme during 1929.
All told, it looks to me that we are facing a unique and extreme four years of excitement, aggression and speculation…
ISN drop-off 2016 (not 2019)!