
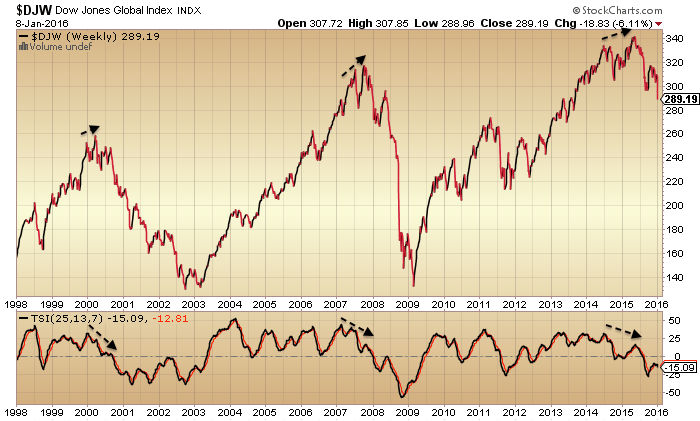
The Dow Jones World stock index shows a strength divergence on a higher high followed by a breakdown, equivalent to the 2000 and 2007 major peaks.
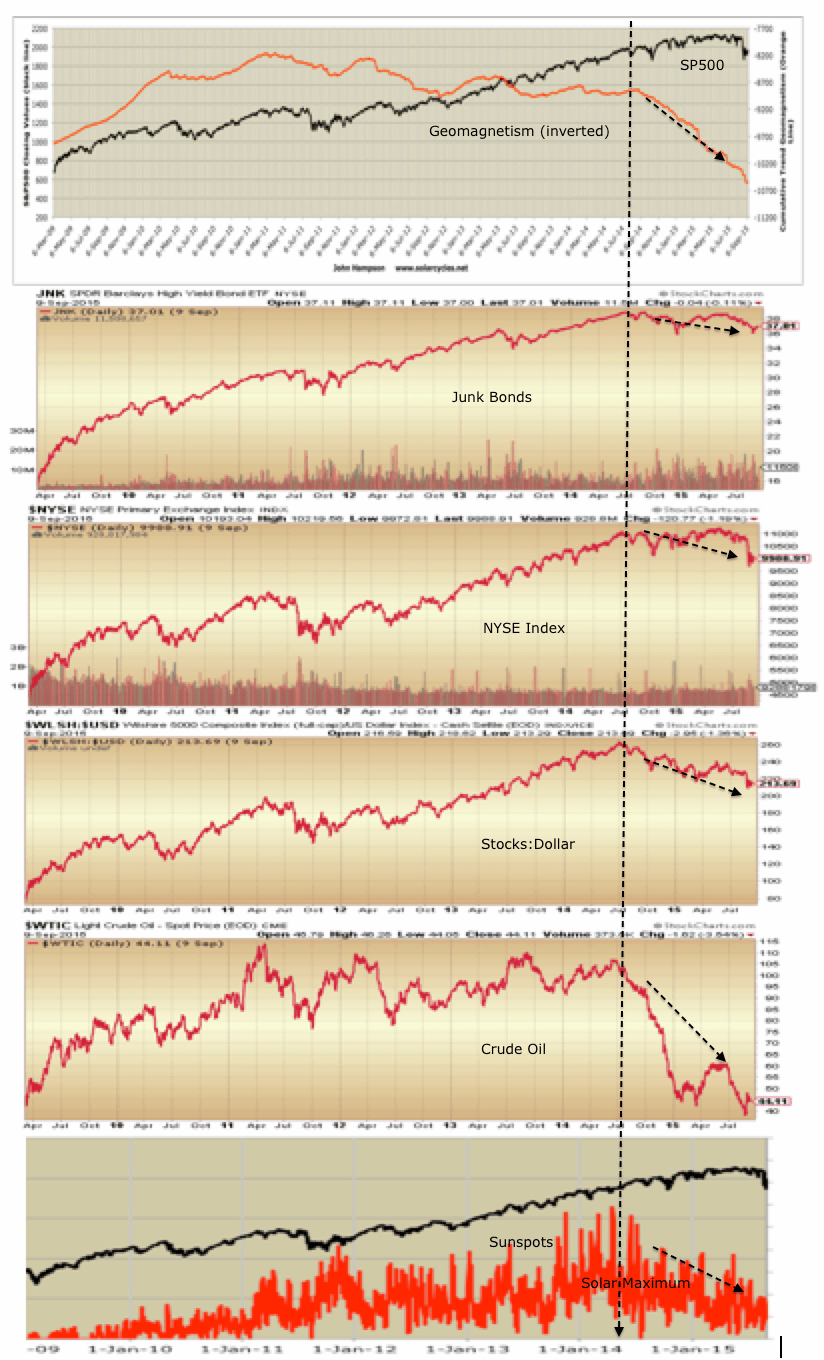
The MS World stock index, which excludes the US, shows a mid-year 2014 peak, which was the solar maximum. The same occurred at the last solar maximum of March 2000. US stocks:bonds and stocks:dollar ratios, as well as crude oil also broke down at the solar max mid-2014 as shown.

Skew (tail-risk or protection against a large move in price) as a ratio to price (SP500) has taken off similar to the bear market initiations in 2000 and 2007.

The SP500 has formed a rounded or arch top whilst risk (stocks:bonds ratio), volatility (inverted) and breadth (stocks over 200 moving average) all diverged. These negative divergences are the hallmark of a topping process, as they were in 2007.

The mid-year 2014 solar maximum also coincided with peaks in other risk assets, namely junk bonds and leverage loans.

The NYSE index effectively peaked out at that mid-2014 point, measured in price, breadth and stocks:bonds.

The German DAX, Hong Kong HSI and US Russell 2000 all show a topping process similar to previous major historic peaks.


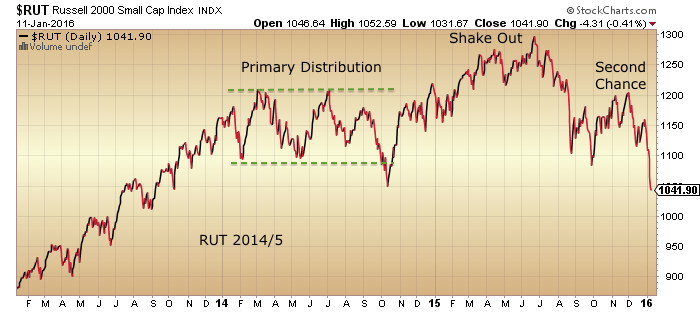
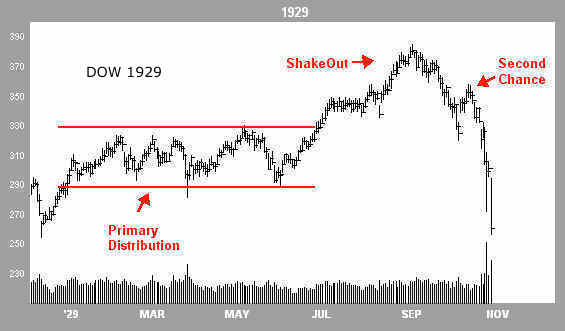
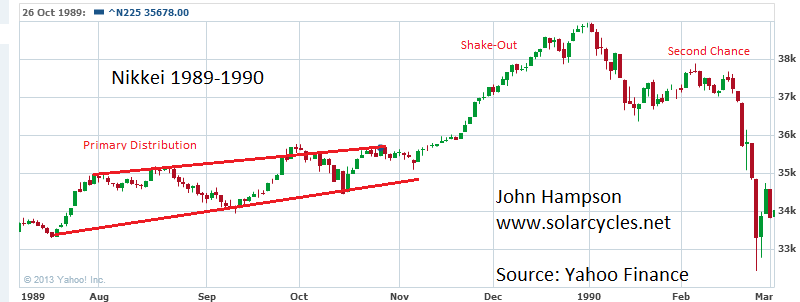

These analogues of major historic mania peaks are particularly relevant when we compare 2014/15 valuations, leverage, allocations and sentiment, and, 1987 aside, the solar maximum is pertinent too.
The FTSE shows a similar topping process and with negative strength divergence like in 2000 and 2007.

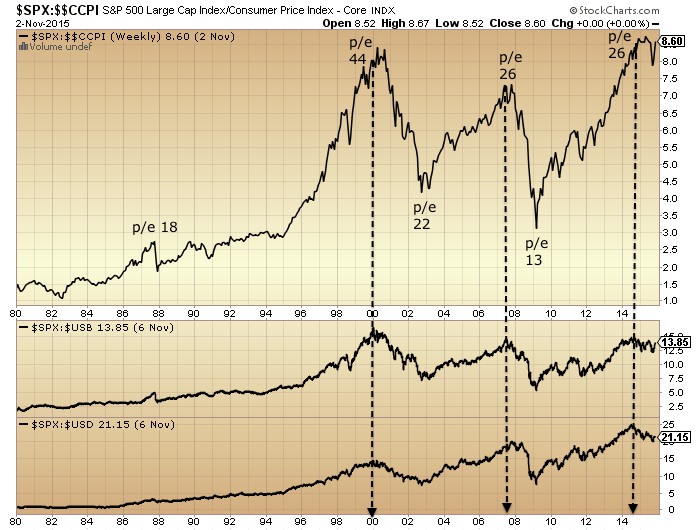
The inflation adjusted, real SP500 casts doubt on the ‘new secular bull’ that nominal price may have suggested post-2013 (for evidence we remain in a long secular bear market since 2000 see ‘Targets’, ’10 Demographic Charts’ and ’10 Solar Charts’). The CPI inflation data is only updated infrequently so is lags development in price, but nonetheless should now have rolled over along with the risk measures. The destination should be single digit p/e valuation, which cross references with demographic forecasts.
A united picture of solar influence reveals a speculative markets mania into the mid-2014 solar sunspot max followed by a reversal under the intensification of geomagnetism. This fits with behaviour at previous solar maxima.
The mania within the mania, or poster boy, has been Biotech, whereby a parabolic price ascent to valuation that even exceeds the 2000 Nasdaq, has now popped and by history ought to now fully retrace as shown.
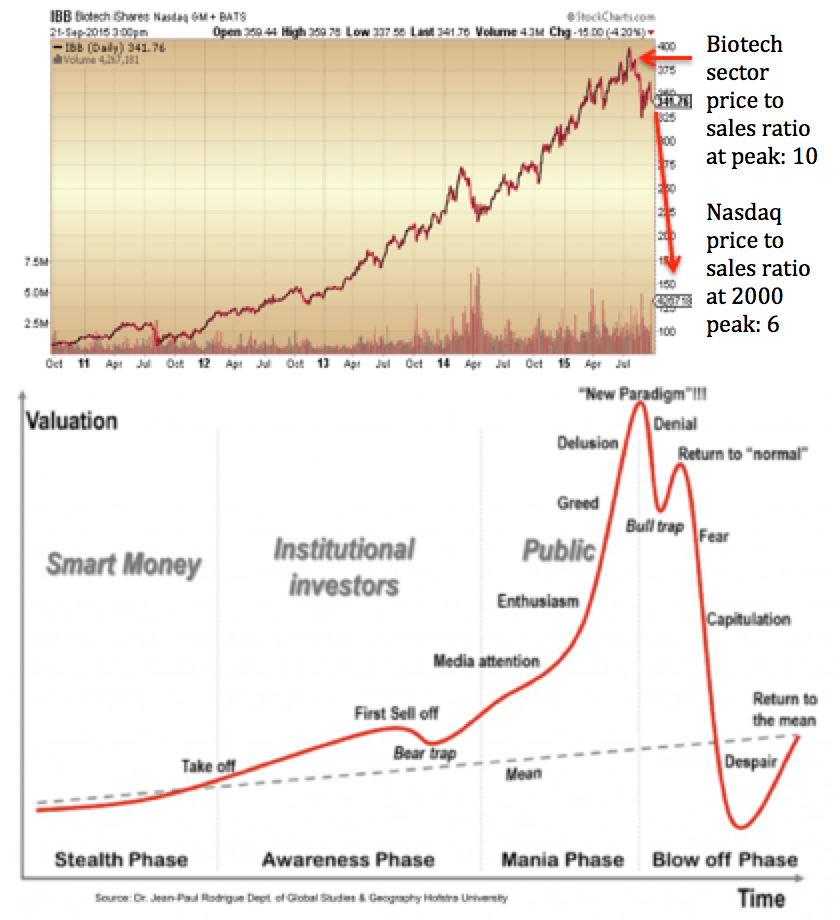
Chart Sources: Stockcharts, Financial-Spread-Betting
Photo Source: National Geographic

John, Your new site layout is looking tidy 🙂
Excellent charts, John. Thanks!
Thanks. Added the topping pattern comparison with 1929, 1987 Dow and 1989 Nikkei.
John, your thoughts on IBB?
Still the same
Agreed. Thanks.
John H, please may I ask whether all of the previous data will be available here at some point?
John H, you may be aware of this but just in case….. I have quite a bit of trouble loading the site on my iphone 4S using Safari. Takes 3-4 attempts before it loads. Also the time taken to load, when it eventually does, is significantly longer than previous site.
It’s almost certainly ‘teething troubles’ but I thought you ought to be made aware. Hope all this can be resolved as I’m quite a big user of your site on my mobile.
Thanks again for all your efforts on our behalf.
Thanks for the feedback Purvez. When you say previous data, what are you referring to? All the blog posts are still available under ‘Blog’. The ‘pages’ that I had have largely been covered by the new solar and demographic charts pages.
Aaah I see John H regarding the previous data. Thx very much. Sorry for not ‘looking around’ first before commenting.
John H, it would appear that the intention on the ‘Home’ page is to have the latest ‘post’ + the Demographics and Solar charts etc. If that is the case then I would like to make a suggestion:
Perhaps the word Blog could be extended to say Block Archive or Blog History to suggest that earlier posts can be found there.
As I say, just a suggestion. Perhaps others here may want to comment in a similar vein.
BTW nice to have ‘time stamps’ showing up with each ‘comment’.
OK, thanks again, all feedback welcome.