
The sun influences the financial markets on Earth in three ways: (1) An ~11 year cycle of solar activity (2) geomagnetic disturbance (3) a cycle of nocturnal lunar illumination of ~1 month.
Psychological and behavioural research links geogmagnetism and lunar phasing with human mood, and sunspots with human excitability.
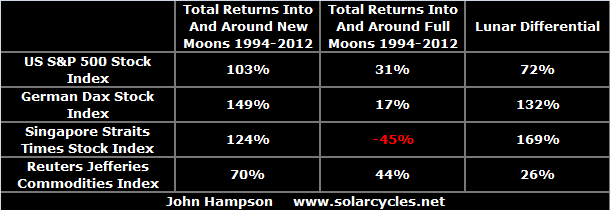
The importance of nocturnal illumination (moon phases) on humans over the course of evolution appears to have hard-coded biological responses which are still operational in an era of artificial lighting. The stock market is a way of measuring this collectively and over time, and the result is compelling:
In chart form it typically looks like this:

It doesn’t work every time or on everyone, but aggregated collectively and over time the influence is clear.
Geomagnetic storms or disturbances on Earth arise from the solar wind and are typically experienced as the Northern Lights. Geomagnetism makes people more irritable and aggressive and affects blood pressure and mood. There is an annual seasonality to geomagnetism which is a key cause of the seasonality captured in the stock markets:

Plus, variance in actual geomagnetism over time shows a correlation with stock market performance.

A closer look at that major topping process versus daily geomagnetism shows how the latter intensifying corresponded to the stock market peaking out.

Geomagnetism intensifies after a solar sunspot maximum (the ~11 year cycle). Typically this brings about recession.

The solar maximum itself brings about peak human excitement (through biological influence) which translates as maximum buying in the economy and speculating in the markets. We see a history of major asset peaks at solar maxima.

For the full picture, this needs to be combined with demographics, with the solar cycle in fact influencing demographics too. Demographics dictate which asset is speculated to a peak at a solar maximum. At the three solar maxima equities valuation bottoms below, commodities / gold made major peaks.

Solar sunspot cycles are in turn influenced by planetary alignment, with Venus, Earth and Jupiter having the biggest influence as captured in the chart below.

That implies there may be a scientific basis for astro-trading.
Lastly, solar minima historically correspond to financial market bottoms, panics or crises.


Chart Sources: EquityClock, SeasonalCharts, Doug Short, Sergey Tarasov, Ching Cheh Hung, SIDC
Picture: Namibia, Source: National Geographic

How do you explain the drop from jan 2000 to jan 2003 in the last chart?
Ok. I think I figured it out.
The Testosterone Hypothesis
How Hormones Regulate the Life Cycles of Civilization
http://testosteronecivilization.com/the-testosterone-hypothesis/