
Demographic trends are set in advance by birth rates. Only radical policies of immigration, war or disease can change what are otherwise fairly reliable predictive tools.
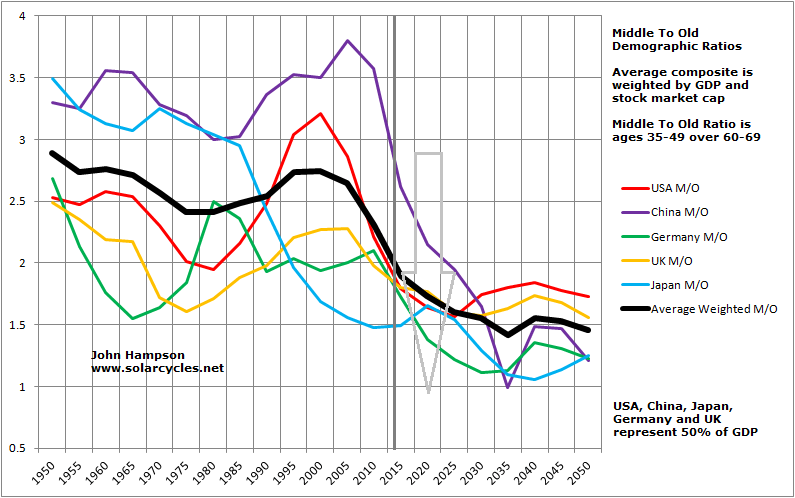
There are four main demographic groups. Children cost money and a swell in this age group relative to the others acts as a drain on the economy. Young adults spend and borrow money but don’t invest and a swell in this age group is inflationary. The middle aged invest in stocks and real estate and a swell in this bracket can cause booms in these assets. The old aged disinvest from equities and housing but buy bonds and can cause a bonds boom. This last age group also act as a drain on the economy as they join kids in dependency and non-productiveness.
For equities, secular (long term) bull and bear markets are demographic. If there are increasing numbers of people joining the buying age group then there will be a protracted boom, and vice versa. Japan enjoyed a 40 year secular bull market into the Nikkei peak of 1989 before demographics turned and dictated a secular bear.
Similarly, swells and shrinkages in the US investor-aged population relative to the rest have dictated the fortunes of stocks and real estate there, and predict a further cyclical bear market to new real lows, following the 2000 secular peak.

The USA, China, Japan, Germany and UK make up 50% of global GDP. Combining their demographic trends, the forecast is for a long period of difficulty for both the economy and equity/housing markets.


Additionally, demographics predict deflation.
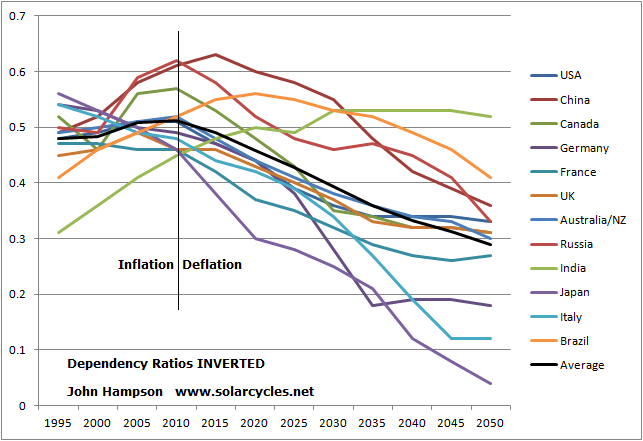
Therefore, a global deflationary depression may take hold again, like in the 1930s. One key difference to then is that we have never before experienced such high numbers in the old age bracket versus the rest.
Gold acts as the anti-demographic (the go-to asset when assets and economy are performing badly) and bottomed as demographics peaked in 2000. The 2011-2015 cyclical bear in gold should be a pause in a secular bull lasting through to the next solar maximum, circa 2025.

Indeed, the big picture is not just demographic, but the interaction of solar cycles and demographics, with the former influencing the latter. When we cross reference both with valuations, we get a more complete forecast.


A united view:

Chart Sources: National Insititute Of Population, Doug Short, Investec
Picture: Death Valley, Source: National Geographic
