

Hat tips to Mark, John Li and Chien Jen.
So what’s similar to 1929?
A stock market mania to extreme valuations.

Source: D Short
A similar low intensity solar cycle.
 Source: Chien Jen
Stock market breadth peaked very close to the smoothed solar maximum (May 1928 vs April 1928, Mar/Jul 2014 vs April 2014) whilst stock index prices didn’t peak until at least a year later.

Source: RW Nelson Source: Stockcharts
Maybe stock prices are following a similar technical pattern.


The timings within the year fairly closely match too. 1929 began with a range. The final push was June to Sept. Therefore, the onus is on the bulls here to push prices back up into the range and out, to prevent the breakdown from the current position.
Now what’s not similar.
Economic growth was stronger in the 1920s.
The fed funds rate was around 4-5% in 1928/9 versus zero now.
It was a demographic climax produced by peak immigration at the start of the century of the age bracket that would buy the stock market in the 1920s.
 Leverage reached 12% of GDP by the peak, versus 3% now.
All things considered, I believe 1929 has more in common with 2000, which was a demographic climax following strong economic growth with fed funds rate similarly around 5%. Post 1929 we saw the Great Depression, post 2000 the Great Recession, then following both we experienced a valuations-led stock market mania into the next solar max set against easy money conditions. Hence 1937 is a better all round fit to now (see HERE for details).
However, what’s common with 1929 is important, specifically that breadth peaked out 16 months before prices, and that is was ultimately leverage that delivered the craziness into the peak. Here in 2015 margin debt is hitting new highs so maybe the game isn’t over yet.
There was always a question mark over why prices didn’t peak with the 1928 solar max but made the anomalous extension into 1929. However, now we can see that breadth peaked at the 1928 solar max, like it has at the mid-2014 solar max, so in both cases marking some kind of speculation peak. The majority of other solar maxima delivered peaks in both breadth and prices close to the sunspot peak. Assuming prices peak out within the next several months (and don’t keep going, new secular bull style) then we are again producing that kind of anomaly that we saw in 1929, namely a fairly long period of degrading internals whilst prices continue to levitate or rise. Why? It’s leverage. Saturation levels in sentiment, allocations and valuations have been in place since the start of 2014. Buybacks were significant for much of last year but now it is leverage which is left holding things up.
So what stopped it in 1929? Answer: nothing in particular. One day the market topped out without any notable trigger, like most tops. Ultimately it was a combination of the fuel for higher prices being spent, leverage at unsustainable levels, prices for stocks being fairly unpalatable, and the whole thing having become a ponzi scheme. Then I would argue that the twin downward pressures of post solar max and the geomagnetic seasonal lows of Sept/Oct produced the timing.
Which brings us to today. What’s to stop prices making a final major leg up like in June-Sept 1929? Nothing, if leverage can keep rising, and the appetite amongst participants is there. However, that ‘appetite’ is under threat due to our positioning post smoothed solar max and the seasonal downtrend from July to October.
Solar cycle 16 had a sting its tail with a final surge in sunspots from September to December 1929. As this rather fits with the declines than the final run up in prices, I don’t think it’s relevant as a cause of the last leg up.
I would summarise that stocks are on borrowed time since the solar max of mid-2014. Breadth, volatility (inverted) and various risk measures all peaked out then. Buybacks also peaked out around then, leaving leverage as the key driver. This kind of anomalous extension post solar max was only seen before in 1929. Given most things in the world are now ‘bigger, better, faster, more’ than back in the 1920s, what’s to stop us blowing that reference point out of the water with an even dizzier anomaly now? Well, I would argue that in the context of negative demographic trends we already have.
A common historic technical topping pattern looks like this.
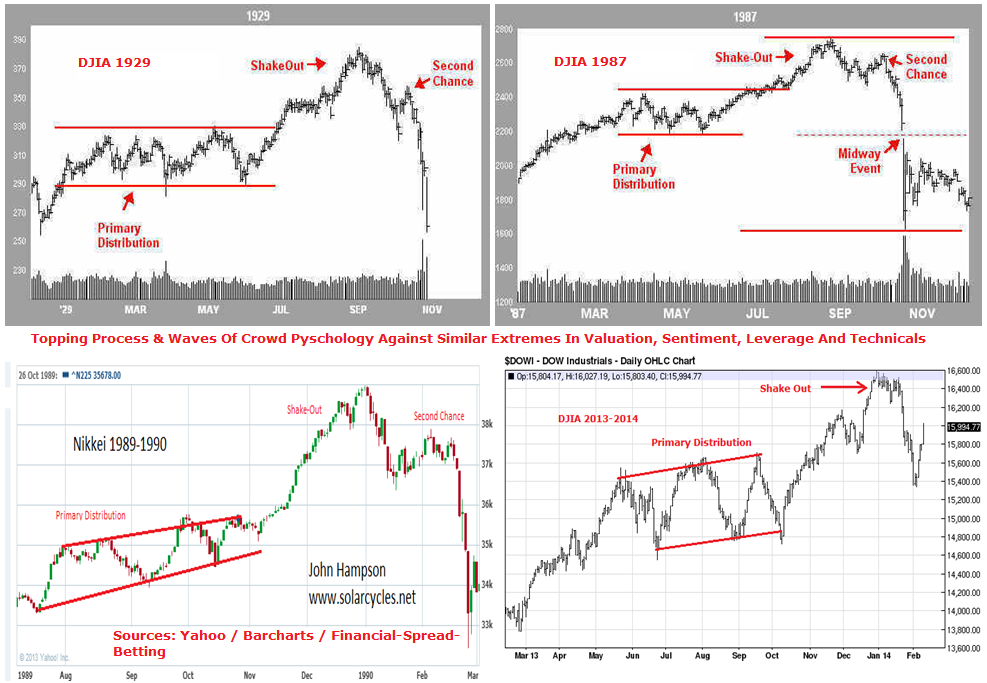
Bottom right is a chart from last year when it appeared to have formed into early 2014, but was a red herring. Drawing together several indices from around the world we could argue it is there again, with the primary distribution across last year and the final leg up in 2015.
 Or we could argue the final leg needs to go higher yet, or has to happen yet on the main US indices. Not easy to call.
So if we stick to what we know, I suggest it’s this. Stocks are on borrowed time since mid-2014 as divergences continue to grow. The geomagnetic downtrend from July to October 2015 together with the post-solar-max downward pressure has a strong chance of killing the bull. The two things to watch are these. Can prices be bid back up into the 2015 range and out of the top? If so, a final leg up would gain weight. And can leverage keep rising? It needs to, if another leg up is to happen.

[Apologies for this second correction to my previous comment. This comment corrects a bad link some other minor elements]
Thank you so much for your posts and your work is inspirational to me…Claudia – president of mcm where I post, referred me to your blog a few times the past months and then insisted I read all your recent posts. Great work…and not coincidentally conveying a similar message from a process I call market structure analysis and projection. A set of cyclic algorithms that I wrote ti help understand statistical probabilities of markets. Something I would love to discuss with you at some depth because i think there is room for lots of development and your work is terrific. Maybe there is an edge for both of us.
My MSP data that shows a serious problem here for the markets on a cyclical/structural level for the next few months – statistically bias is down for the next 2.5 to 3 months from MSP.
Moreover, my daily market structure projection work is pointing to a serious risk here…I am not posting here to promote my blog but because i think you are on it – this is an extreme inflection point is seems.
Here is some detail on my toolset for today as today seems pivotal and ironically it looks like everyone is looking up to me…but almost none of the statistical probabilities I am getting are resolving higher:
http://mcm-ct.com/blog/fed-day-targeted-intraday-msp-probability-analysis/
http://mcm-ct.com/blog/fed-day-intraday-probabilities/
This is more on the longer term MSP i am getting:
http://mcm-ct.com/blog/daily-weekly-market-structure-projection-update-probabilities-down/
and some other rare events:
http://mcm-ct.com/blog/the-big-picture-on-mcm-hindenburg-omen-do-not-take-them-lightly/
PLUS we have these charts: PURE INSANITY:
http://mcm-ct.com/imaginary-numbers-charts/
Thank you, and thanks for sharing
John, excellent post.
I wonder if the Fed indicating rate hikes are assured this year is the proverbial straw that breaks the camel’s back. Given so much leverage in the system, the idea that the Fed is taking away the punch bowl (even if very gradually) may cause some people to move to the exits, which will then begin to feed on itself.
Thanks
Some of these charts are frightening…
https://www.hvst.com/posts/43800-market-indicators-hit-historic-highs?utm_campaign=website&utm_source=sendgrid.com&utm_medium=email
http://www.nytimes.com/2015/06/17/business/investors-turn-cautious-as-fed-edges-toward-rate-increases.html?_r=0
“We’re all looking at each other to figure out who’s going to blink first,” Ms. McDonough said. “You don’t want to give up while the market is still strong and supportive. You’d be giving up on a significant amount of income.”
Why does this remind me of Chuck Prince’s famous quote back in 2007?
John, one of the biggest similarities between the late 1920s and now is the dramatic increases in central bank reserves, causing a bubble in credit the world over.
This paper is worth reading, the section on CB reserves is on page 3 (in a grey box).
Click to access 18_03_194505xx.pdf
@Mark, I replied to your little dig on the previous post. You are amongst many that read a lot, but have difficulty in separating the wheat from the chaff. I remember your outburst directed at Allan a while back, your emotions seem to run a bit hot at times. That’s your weakness, I do hope it doesn’t cost you any more money.
Now,now boys…
I love both your comments.
Mark has been right on regarding a late solar max peak, so he hasn’t lost by shorting early. GM brings a great fundamental perspective.
JH, I appreciate the two-sided view. What is your take on the IBB chart? Could it be a shakeout, or a second chance?
The price range it has entered wouldn’t be a typical topping pattern to such a parabolic chart, but it nonetheless shows the strength divergences of the previous attempts at peaking.
Lunar Chord:
Phase: bull
Distance: neutral
Declination: bull
Seasonal: bull
Planet: neutral bearish(Mercury bull, Venus bear, Mars bear)
News: bull, fomc announcement days “most” of the time bullish in days after.
Summary: Fully invested in US equity etf.
Will remain long only until this Friday as all indicators flip bear next week.
Hello Valley
The asx 200 has been leading the s&p 500 since Monday
Yes it may change any time be care full
7:02 pm Ozzie
Thin volume and ever increasing divergence on SPX makes it mire likely to resolve to the downside. However in my book unless we breach the 9th June low I am not adding shorts at this time.
J
6/17 1:07 ET Spiral update – Lab 7442 Live looking for 2057, 2041 and 2025 possible by Friday.
Also a cautious reminder for those who trade options on SPY that this Friday Jun19 is ex-dividend date.
Doesn’t the option strikes get adjusted?
No, SPY shareholders collect the dividend and option players get shafted.
Steve T, i haven’t seen where it was posted the SPY ex dvd date is 6/19. wouldn’t that indicate the dividend of about .93 cents is priced in through tomorrow’s action and should be down by .93 on Friday excluding trading activity?
Scott: http://www.nasdaq.com/symbol/spy/dividend-history
Yes, on Friday SPY will likely trade down by about a buck unless there is a big bullish upside day to negate it, which seems to occur quite frequently since I think it occurred the last FOUR quarters consecutively. Please look it up if you do not believe me …
Hi all ! Market is up nicely after the FED. The FED doesn’t want to see a down day today. I’m still following my strategy with AAPL, IBB and QQQ, although the past few months have been flat. Nothing to worry about. I’m sure central banks will continue to support the market.
regards.
Tick tock Nick.
Hello all…rainbows, unicorns and glitter for everyone….my credit call spreads continue to pay off. put in some more post fed announcement and run up. all the central banks have to do is have milton bradley produce another 100 trillion of monopoly money to prop the mkt up and all will be well in the world,
kisses
looks like the Central banksters and FeD Frausters are doing all they can after hours to keep SPY afloat, but there is just too much selling….gosh didn’t they pay attention today? 210.41 nearly 1 full point of the yellen induced drunken highs at 211.32
now 210.15 after hours 3:40 CST. below yesterdays close of 210.25, below today’s opening price of 210.59 and well below Yellens’s FED induced punch bowl of 211.32. yep ….sure looks like Nic’s fraudsters have it all figured out. at the moment, i’m diggin my 211/211.50s and my 212/212.50 credit call spreads. of course it can all change in a flash, but I like my chances.
The result of all this confusion… A 3rd Hindenburg Omen in the last 5 days…
http://www.zerohedge.com/news/2015-06-17/flummoxed-fed-sparks-insta-buying-binge-bonds-bullion-stocks-hit-hindenburg
Be carefull with 211 you will be assigned on thursday if you are short, I have done that before and payed dearly..thought I will warn you have good comments
So are they called? Or is it an ex-div thing?
Steve,
Were the calls assigned and dividend charged to you..IB did something like that few months back and I want to Know.
Hasbro, Inc. (HAS) the owner of Milton Bradley gained 2% after the Fed announcement today.
COMPQ 2 hr – NQ falling a/h
A brief Bob Hoye update, as interesting as ever:
http://biiwii.com/wordpress/2015/06/05/pivotal-events-47/
Who’s leading who?
DJIA is up 160+ points and the FTSE is up 16. Used to be that the FTSE used to be approx 50% of the DJIA move.
So I’ll ask again….who’s leading who?
The Dow is leading. Following the excellent FED meeting yesterday, it’s very rational to have a big up day today. It was very easy to forecast.
I’ve added to my QQQ this morning and initiated a position in CRM. Again, there’s no bear market in sight, and central banks are doing a fantastic job. Everybody should be happy.
Congrats again.
I have to agree there is little technical signal that says big bear market ahead to me. I still prefer buying the DAX on the drops as it has far more to rise as european recovery carries on (very slowly though). Greece should find an agreement in the end i think
Are you looking at the same Dax I am Krish?
I recall you buying around 1,000 points higher when it looked ready to roll over.
11,000 was a support level, but I reckon it’s headed down to 10,000 in very short order. It may be worth a nibble at 10k.
The SPY bouncing hard today is just the last twitches of a dying bull IMO, air pockets lie ahead.
I managed to trade the dax and have made 1000 points going long during this decline. A bit of luck was also involved. I can see the U.S. Markets declining 10-15% but I think the dax is close to a bottom if it hasn’t already been. A Greece solution will send it to 12000 in short order as buyers flood in with all the cash they have sitting on the sidelines. I went long at 10816 earlier today closing for 44 points profit. Could have been a lot more if I had been patient!
Greece is irrelevant Krish. I hope your luck holds, but I believe you are now trading against the primary trend. Don’t get wedded to a view.
Nicolas, unless the Brits have ‘gone awol’ you’ll find that they are leading.
Please warn your friends at the Fed too. Would hate for them to be left holding the bag….or maybe not.
6/18 11:44 Expansion high coming in by 6/20. 2115.75 is next likely high. wait for wave 1 and 2 and sell break of w1 low for Singularity low 7/2 http://www.ustream.tv/channel/7442-analytics
6/18 12:25 Next target for high 2122 esu5.
Peggy, I hate to be critical but you did it yet again. Your original thesis of a big up move from Jun 6 to Jun 20 is essentially correct. However, on Jun 15/16 near the lows you or Lab7442 suddenly “switched” perspectives and gave much lower lows like 2041, 2058, 2061, etc right near the market lows.
From my observations I am fairly certain you or that Lab implied the market was going lower first (to new lower lows) before going higher. Why that decision making was done is beyond me because your original thesis had a spiral expansion running right into Jun 20 …
FWIW history backed up a big run up into late this week either Jun 18 or 19, because the last four quarters when SPY went ex-dividend it had huge final two days to end those weeks … Jun 20, 2014 Sep 19, 2014, Dec 19, 2014, Mar 20, 2015, and now Jun 19, 2015.
The reason is because the Expansion high usually comes in during Octet 6 – yesterday and today – which is why the wave down yesterday forecast lower targets. When the next wave 1 down and wave 2 are in place, the trend will be down to near 7/2 (usually the low occurs during Octet 2 – July 3) I’ll post price targets.
Lunar Chord:
Phase: bull
Distance: neutral
Declination: bull
Seasonal: bull
Planet: neutral bearish(Mercury bull, Venus bear, Mars bear)
News: bull, fomc announcement days “most” of the time bullish in days after. And as Steve T. points out tomorrow is ex dividend.
Summary: Fully invested in US equity etf since Wednesday morning. Will not be long past tomorrow as next week lunarily crystal clear bear on all metrics.
I don’t think anyone knows. IBB could go up 5% more and the bulls will say I told you so, 9/2015 parabolic peak. Or it could go down -5% and the bears will say everyone was stopped by marginal new highs, and now it will go down. Staying safe right now, unless I get a concrete signal.
John Li, what’s your definition of ‘concrete signal’ please? I’m pretty much in the same boat as you….but not knowing ‘when’ to ‘dip a toe’.
Thx.
Scratching my head too.
One example tonight: Shanghai is -10% off peak and getting headlines. Could that cause a stampede deleveraging?
Another example: Greece actually defaults.
Another example: For the 2nd weekend, people expect China RRR cuts, but do not get easing.
But yeah, I was just ranting. I don’t know what a concrete signal is until I see it I guess. Something more than the price going up or down, leading me to chase mindlessly, especially how it keeps going up when Greece gets closer and closer to default.
Thx John Li. I understand your frustration & your approach. You’re right to say we’ll know when we see it. Just hope we get to catch some of it.
Surprise surprise, no signal from the Fed on a rate rise now anticipated December 2015.
Does ANY CB have even an a single iota of credibility left?
I’ve said before and will say it again, liquidity is fast being destroyed by zero/negative rates. Bond markets have been all but destroyed and the only game left is equities, which will soon pay the ultimate price for said destruction
I personally know many bond traders and many are close to quitting the market altogether.
Well done Drahgi,Bernanke/Yellen/Kuroda et’al. You have destroyed any chance whatsoever of a return to reasonable long term growth, possibly decades to come.
We had our chance to take our medicine several times over the last decade and a half but instead opted out for the short term scenario.
This sickens me beyond description.
Thankyou again for a great article John……back to lurking.
“The reason is because the Expansion high usually comes in during Octet 6 – yesterday and today – which is why the wave down yesterday forecast lower targets. When the next wave 1 down and wave 2 are in place, the trend will be down to near 7/2 (usually the low occurs during Octet 2 – July 3) I’ll post price targets.”
Yesterday or the day before the spiral was looking for a low of 202x….that was of course wrong, as all systems are on an ongoing basis. It is impossible to predict the future although this spiral seems to catch some of the ebb and flow of trading for periods of time. BUT do NOT be fooled. There is no single system or process that can predict the future, so do not risk more than you can afford to lose.
When Steve T raised a similar point to mine (I think), the above paragraph was the “explanation”…..which smells of bullsh*t to me. I think it far better to be honest and transparent about a process rather than make a “nothing explanation” and hope people do not notice. Let me paraphrase the above to see if we can agree on what it even means:
Q (Jegersmart): the system was looking for a low of 202x very recently. It didn’t get there, not anywhere near. In fact the market over the next session or so went in the opposite direction. I guess I was right about something then: all systems are flawed?
A: (Peggy): No Jegersmart, the reason the spiral was right is because the Expansion high comes in during Octet 6, which is why it forecasted lower targets yesterday. When the buying has stopped we may head down again probably into 2nd or 3rd July.
Q: (Jegersmart): so what you are saying Peggy is that although the price went the opposite way, the Spiral was still right, it just looks wrong because of the Octet 6? But even if the system threw out a wrong number (in hindsight) – it wasn’t wrong because you interpreted it incorrectly? i.e. you should have known that the Expansion high was due in Octet 6 but forgot and therefore it is not the fault of the system?
The problem I see here quite often on this site is that most people are wrong quite often – including me of course. This is normal, it is something to be embraced. No one can predict the future. Not 7442 Analytics, not LTCM and so on.
Please do not take this as bashing the system. Take this at face value from someone who has seen all systems fail along the way….
J
New post
Spiral update – target for low next week 2067